

The DOI matches its Crossref record; 131 of the 131 references it cites were found in a registry or an index.
Single cell transcriptomics of human epidermis identifies basal stem cell transition states
Open accessPublished version of a preprint
Abstract
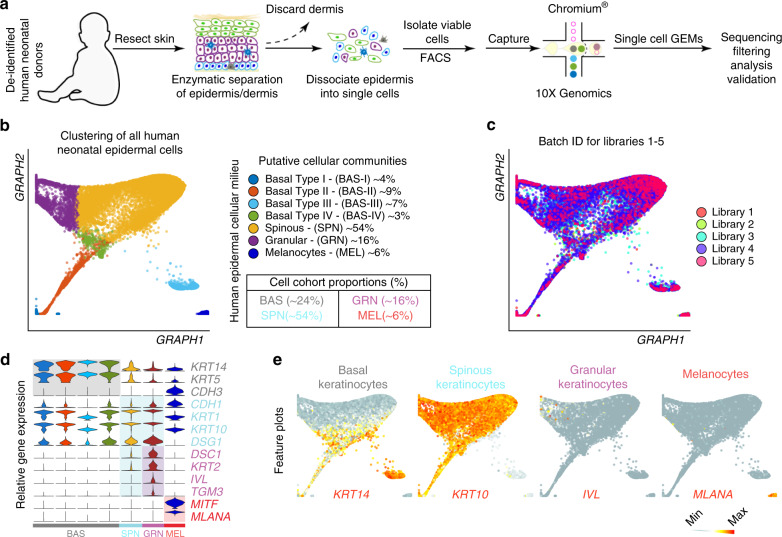
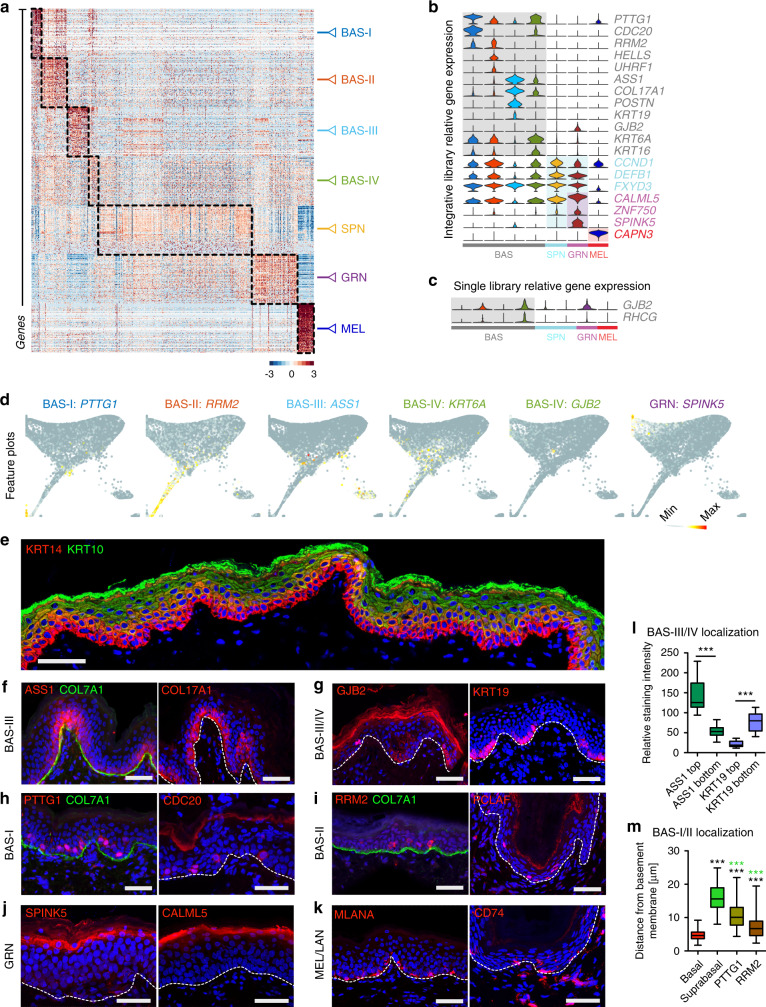
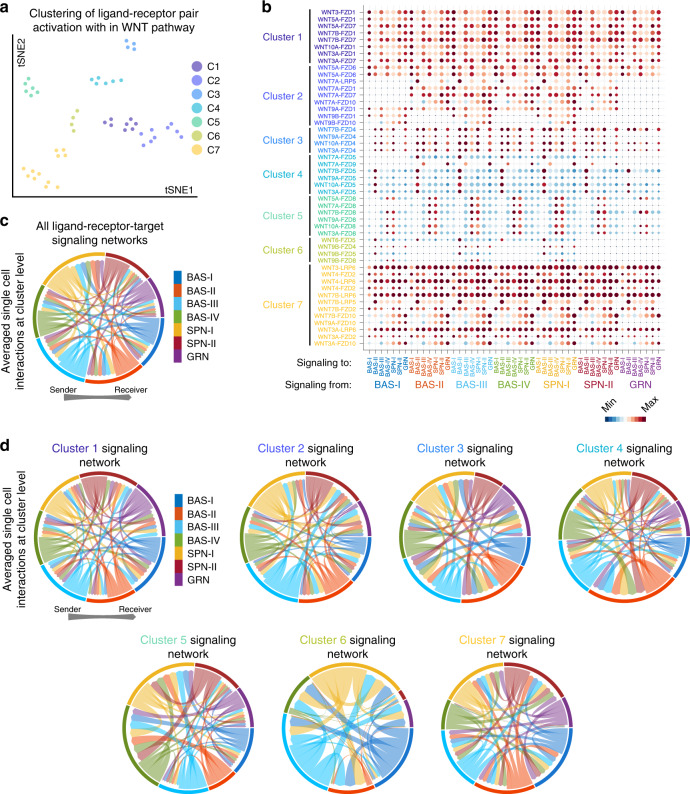
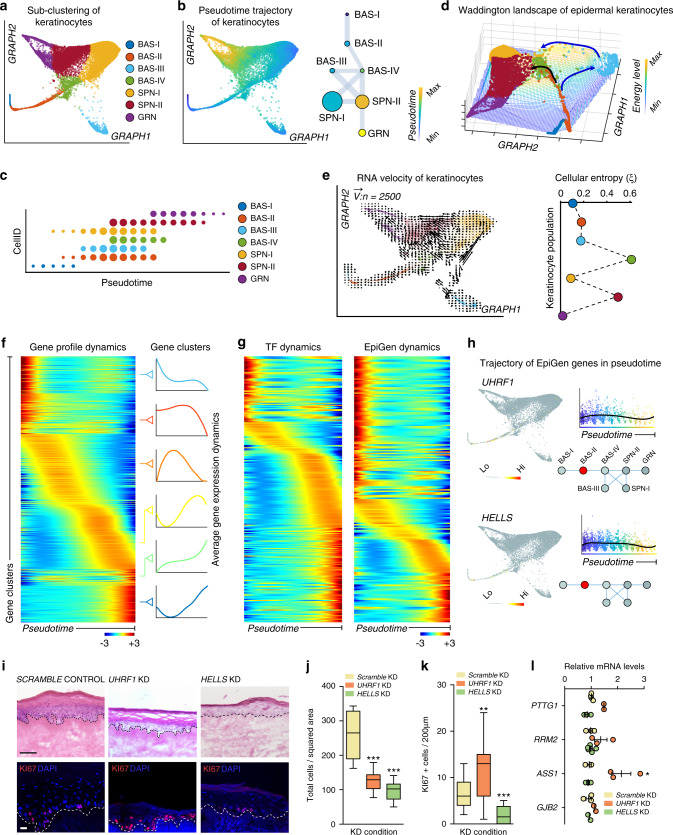
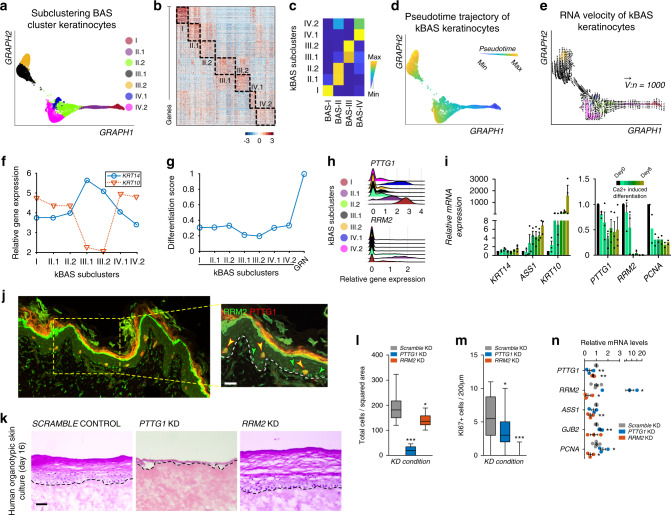
How stem cells give rise to epidermis is unclear despite the crucial role the epidermis plays in barrier and appendage formation. Here we use single cell-RNA sequencing to interrogate basal stem cell heterogeneity of human interfollicular epidermis and find four spatially distinct stem cell populations at the top and bottom of rete ridges and transitional positions between the basal and suprabasal epidermal layers. Cell-cell communication modeling suggests that basal cell populations serve as crucial signaling hubs to maintain epidermal communication. Combining pseudotime, RNA velocity, and cellular entropy analyses point to a hierarchical differentiation lineage supporting multi-stem cell interfollicular epidermal homeostasis models and suggest that transitional basal stem cells are stable states essential for proper stratification. Finally, alterations in differentially expressed transitional basal stem cell genes result in severe thinning of human skin equivalents, validating their essential role in epidermal homeostasis and reinforcing the critical nature of basal stem cell heterogeneity.
Overview
The claims and statistics of this paper haven’t been checked yet.
Run the check — free, no account needed. It reads the open-access text and checks the sources it cites.
Integrity signals
Registry
Cites
Statistics
Figures
Verification
Claims the paper makes
The claims and statistics of this paper haven’t been checked yet.
Run the check — free, no account needed. It reads the open-access text and checks the sources it cites.
Claims other papers make about this one
Each is checked against this paper’s own text: does it say what the citing paper says it does?
The source backs part of the claim, not all of it — or backs it for a different population, condition or comparison.
In the citing paper
“It enables both profiling of gene expression measurements at a single-cell resolution and identification of reliable cellular heterogeneity, allowing for the identification of previously unrecognized levels of cellular heterogeneity, revealing regulatory relationships between genes, and tracking the trajectories of distinct cell lineages in the same or different developmental stages [63–66].”
From Diversity of human skin three-dimensional organotypic cultures (2024) · cites this paper as [66]
Experimental — accuracy not yet measuredThe source backs part of the claim, not all of it — or backs it for a different population, condition or comparison.
In the citing paper
“we spatially resolved four distinct basal stem cell populations within human IFE and delineated multiple spinous and granular cell populations that contributed to a hierarchical differentiation lineage”
From Single-cell transcriptomics of human-skin-equivalent organoids (2023) · cites this paper as [27]
Experimental — accuracy not yet measuredThe cited source says what the claim attributes to it.
In the citing paper
“human epidermis is more heterogeneous than previously thought.”
From Single-cell transcriptomics of human-skin-equivalent organoids (2023) · cites this paper as [27]
The cited source says what the claim attributes to it.
In the citing paper
“BAS-III cells typically sit atop the rete ridges in vivo, whereas BAS-IV cells lie at the bottom of rete ridges.27”
From Single-cell transcriptomics of human-skin-equivalent organoids (2023) · cites this paper as [27]
Self-check
Percentages, sums and reported differences re-computed from the paper’s own numbers.
The self-check needs the paper’s full text.
Citations
Cites
Subramanian, A., Tamayo, P., Mootha, V. K., Mukherjee, S., Ebert, B. L., Gillette, M. A., Paulovich, A., Pomeroy, S. L., Golub, T. R., Lander, E. S., et al. (2005) · Proceedings of the National Academy of Sciences · doi:10.1073/pnas.0506580102 · Cited by 53,625
Enrichr: a comprehensive gene set enrichment analysis web server 2016 update
Kuleshov, M. V., Jones, M. R., Rouillard, A. D., Fernandez, N. F., Duan, Q., Wang, Z., Koplev, S., Jenkins, S. L., Jagodnik, K. M., Lachmann, A., et al. (2016) · Nucleic Acids Research · doi:10.1093/nar/gkw377 · Cited by 10,799
Enrichr: interactive and collaborative HTML5 gene list enrichment analysis tool
Chen, E. Y., Tan, C. M., Kou, Y., Duan, Q., Wang, Z., Meirelles, G. V., Clark, N. R., & Ma’ayan, A. (2013) · BMC Bioinformatics · doi:10.1186/1471-2105-14-128 · Cited by 7,814
Trapnell, C., Cacchiarelli, D., Grimsby, J., Pokharel, P., Li, S., Morse, M., Lennon, N. J., Livak, K. J., Mikkelsen, T. S., & Rinn, J. L. (2014) · Nature Biotechnology · doi:10.1038/nbt.2859 · Cited by 7,314
Highly parallel genome-wide expression profiling of individual cells using nanoliter droplets.
Macosko, E. Z., Basu, A., Satija, R., Nemesh, J., Shekhar, K., Goldman, M., Tirosh, I., Bialas, A. R., Kamitaki, N., Martersteck, E. M., et al. (2015) · Cell · doi:10.1016/j.cell.2015.05.002 · Cited by 7,110
Wnt/β-Catenin Signaling in Development and Disease
Clevers, H. (2006) · Cell · doi:10.1016/j.cell.2006.10.018 · Cited by 5,568
Wnt/β-catenin signaling and disease
Clevers, H., & Nusse, R. (2012) · Cell · doi:10.1016/j.cell.2012.05.012 · Cited by 5,554
Reversed graph embedding resolves complex single-cell trajectories
Qiu, X., Mao, Q., Tang, Y., Wang, L., Chawla, R., Pliner, H. A., & Trapnell, C. (2017) · Nature Methods · doi:10.1038/nmeth.4402 · Cited by 5,070
Dissecting the multicellular ecosystem of metastatic melanoma by single-cell RNA-seq
Tirosh, I., Izar, B., Prakadan, S. M., Wadsworth, M. H., Treacy, D., Trombetta, J. J., Rotem, A., Rodman, C., Lian, C., Murphy, G., et al. (2016) · Science · doi:10.1126/science.aad0501 · Cited by 4,944
Wnt/β-Catenin Signaling, Disease, and Emerging Therapeutic Modalities
Nusse, R., & Clevers, H. (2017) · Cell · doi:10.1016/j.cell.2017.05.016 · Cited by 4,342
Cited by
Sorted by citations
Items 201–221 of 221
Propriétés immunitaires des kératinocytes humains et de leurs précurseurs
Mestrallet, G. (2021) · theses.fr (ABES) · doi:10.70675/99958530z8e43z417dz8f34z9ff9b3cb3ce5
Glandular Cells of Forest Musk Deer Autonomously Synthesize Sex Steroid Hormones
An, X., Han, X., Huang, J., Zhang, Z., Lou, Z., Hu, J., Tan, R., Yang, P., Dou, X., Bati, H., et al. (2026) · Biology · doi:10.3390/biology15070583
Laigle, C. (2024) · theses.fr (ABES) · doi:10.70675/fbf71a50z8b1ez410azaf20z23eda138692a
Rete Ridge Topography as a Determinant of Epidermal Stem Cell Identity: Implications for Skin AgingPreprint
Fang, R., Hamaguchi, R., Xu, S., Lee, W., Todorova, K. A., Sol, S., Wu, X., Nguyen, M., Shi, J., Laga, A. C., et al. (2026) · bioRxiv (Cold Spring Harbor Laboratory) · doi:10.64898/2026.04.07.716516
Chlasta, J., Runel, G., Boussard, M., Pele-Joly, T., Lazou, K., Pays, K., Nizard, C., Amoêdo, N. D., Rossignol, R., & Bulteau, A. (2026) · Cosmetics · doi:10.3390/cosmetics13030114
Hummel, J. I., Zauner, R., Gruner, S., Dorfer, S., Ablinger, M., Walch, V., Barone, C., Laimer, M., Guttmann‐Gruber, C., Hofbauer, J. P., et al. (2026) · Frontiers in Cell and Developmental Biology · doi:10.3389/fcell.2026.1810599
Label-Free Raman Imaging Defines Distinct Cell Populations in Human Skin
Sugiyama, K., Ando, M., Ishikawa, M., Sada, A., & Takeyama, H. (2026) · Chemical & Biomedical Imaging · doi:10.1021/cbmi.6c00030
Phung, H. M., Nguyen, N. T. K., Nishikawa, I., Takeda, N., Fujii, T., Gao, G., Ohkawa, Y., Araki, K., & Sada, A. (2026) · bioRxiv (Cold Spring Harbor Laboratory) · doi:10.64898/2026.05.25.727717
FAM83H couples keratin organization to Notch signaling during epidermal morphogenesisPreprint
Kamaraj, M., Amakor, J. K., Ogan, B. M., Qian, G., Jacobs, K. A., Rajan, A. A. N., Sedlacek, R., Wittmann, T., Hutchins, E. J., Balounová, J., et al. (2026) · bioRxiv (Cold Spring Harbor Laboratory) · doi:10.64898/2026.05.26.727959
Lee, S. E., & Lee, D. H. (2026) · Experimental Dermatology · doi:10.1111/exd.70292
Kreuger, I. Z. M., Merkus, V. A., de Haan, S., Schrader, A. M. R., Scheeren, F. A., van der Burg, S. H., van Groningen, T., Slieker, R. C., & van Doorn, R. (2026) · Cancer Research · doi:10.1158/0008-5472.can-25-2934
Nappi, C., & Taberner, F. J. (2026) · Frontiers in Pain Research · doi:10.3389/fpain.2026.1797161
An integrated skin cell atlas decodes the pilosebaceous unit
Düz, T., Törőcsik, D., Momnougui, S. M. E., Oubounyt, M., Al, B., Gallinat, S., Baumbach, J., & Holzscheck, N. (2026) · Journal of Investigative Dermatology · doi:10.1016/j.jid.2026.06.1282 · Cited by 1
Proteoform Detection Across 17,000 Single Nuclei From Differentiating Skin Keratinocytes
Vijayalakshmi, K., Plá, I., Xu, T., Su, P., Fisher, N. P., Hollas, M. A. R., Markiv, P., Agarwal, U., Lysakowska, M., Kafader, J. O., et al. (2026) · Molecular & Cellular Proteomics · doi:10.1016/j.mcpro.2026.101621 · Cited by 1
Cross-modal mapping of cancer stem-like cell plasticity using deep learning
Chowdhury, D., Priyadarshi, S., Biswas, S., Neekhra, B., Gupta, D., & Haldar, S. (2026) · NAR Cancer · doi:10.1093/narcan/zcag015
Single-cell profiling decodes patagium development in gliding mammal
Lin, Y., Huang, S., Che, L., Zhao, H., Wang, Y., Mingfei, Y., Ai, C., Ruan, J., Wang, X., & Yu, L. (2026) · Nature Communications · doi:10.1038/s41467-026-76329-2
Single-cell mapping of diabetic foot ulcers: mechanistic axes and therapeutic targets
Zhang, H., Tao, M., Yang, C., Sabuj, A. R., Sarker, M. K., & Wang, C. (2026) · Frontiers in Medicine · doi:10.3389/fmed.2026.1910324
SUMOylation in skin homeostasis and disease: Regulation of cutaneous signaling networks
Li, P., Li, L., Huang, H., & Zhu, M. (2026) · Cellular Signalling · doi:10.1016/j.cellsig.2026.112900
Decoding cutaneous injury-induced inflammation through single-cell RNA sequencing
Batzli, G. F., Kleb, S. S., Droll, S. H., & Shook, B. A. (2026) · Seminars in Cell and Developmental Biology · doi:10.1016/j.semcdb.2026.103703
Ando, T., Okamoto, K., Sato, K., Goto, Y., Izumi, H., Kataoka, N., Ueda, Y., Kobayashi, Y., OMACHI, K., 優雅, 前., et al. (2026) · Communications Biology · doi:10.1038/s42003-026-11092-0
Metadata
- Authors
- Wang, S., Drummond, M. L., Guerrero-Juarez, C. F., Tarapore, E., MacLean, A. L., Stabell, A. R., Wu, S. C., Gutierrez, G., That, B. T., Benavente, C. A., Nie, Q., & Atwood, S. X.
- Affiliations
- University of California, Irvine (US)
- Corresponding author
- Nie, Qing
- Atwood, Scott X.
- ORCID
- Venue
- Nature Communications
- Published
- 2020-08-25
- Volume
- 11
- Issue
- 1
- Pages
- 4239-4239
- ISSN
- 2041-1723 (ISSN-L)
- PMC
- PMC7447770
- OpenAlex
- W3081219157
- Cited by
- 218
- References
- 131
- Citations by year
- 2026: 32 · 2025: 40 · 2024: 47 · 2023: 38 · 2022: 37 · 2021: 18 · 2020: 6
- FWCI
- 28.17
- Type
- journal article
- Language
- en
- Open access
- gold
- doi.org
- Locations
- Nature Communications (publishedVersion, cc-by)
- bioRxiv (Cold Spring Harbor Laboratory) (acceptedVersion)
- PubMed Central (publishedVersion, cc-by)
- PubMed (publishedVersion)
- RePEc: Research Papers in Economics (submittedVersion)
- DOAJ (DOAJ: Directory of Open Access Journals) (submittedVersion, cc-by-sa)
- eScholarship (California Digital Library) (submittedVersion)
- eScholarship (California Digital Library) (submittedVersion, cc-by)
- Funders
- Concern Foundation (CF204525)
- U.S. Department of Health & Human Services | National Institutes of Health (P30AR075047)
- Topics
- Health Sciences › Medicine › Dermatology › Hair Growth and Disorders
- Life Sciences › Biochemistry, Genetics and Molecular Biology › Molecular Biology › Single-cell and spatial transcriptomics
- Life Sciences › Biochemistry, Genetics and Molecular Biology › Cell Biology › Skin and Cellular Biology Research
- Keywords
- basal stem cells, interfollicular epidermis, epidermal stratification, epidermal homeostasis, intercellular communication, pseudotime, RNA velocity, skin equivalents, rete ridges
- MeSH terms
- Epidermal Cells, Cell Communication, Cell Differentiation, Epidermis, Gene Expression Regulation, Homeostasis, Humans, Infant, Newborn, Male, Models, Biological, Stem Cells, Signal Transduction, Keratinocytes, Cell Lineage, Gene Expression Profiling, Foreskin
About these checks
Registry, retraction, Cites and statistics results are computed, not judged, with one exception: a printed reference that no index lists is read once by a model before it counts as a citation error. Claims are extracted by a model and kept only when their quote appears verbatim in the text; each cited source is then checked, with a model’s help, for whether it says what the claim relies on. Those verdicts can be wrong — read the claim’s quote and the cited source before relying on one.
Statistics and arithmetic are recomputed, not judged.
Confidence bands are shown only for fields calibrated on our annotated test set. None is calibrated yet, so no band is shown.
What counts as a claim ›How we measure confidence ›How we check this ›
Are you an author, or do you see a problem with this page? Request a review
