Cited by 76

The DOI matches its Crossref record; 10 of the 10 references it cites were found in a registry or an index.

Functional role of Tet-mediated RNA hydroxymethylcytosine in mouse ES cells and during differentiation

Lan, Jie, Rajan, Nicholas, Bizet, Martin, Penning, Audrey, Singh, Nitesh K., Guallar, Diana, Calonne, Emilie, Li Greci, Andrea, Bonvin, Elise, Deplus, Rachel, Hsu, Phillip J., Nachtergaele, Sigrid, Ma, Chengjie, Song, Renhua, Fuentes-Iglesias, Alejandro, Hassabi, Bouchra, Putmans, Pascale, Mies, Frédérique, Menschaert, Gerben, Wong, Justin J. L., Wang, Jianlong, Fidalgo, Miguel, Yuan, Bifeng, Fuks, François·2020·Nature Communications

Abstract

Tet-enzyme-mediated 5-hydroxymethylation of cytosines in DNA plays a crucial role in mouse embryonic stem cells (ESCs). In RNA also, 5-hydroxymethylcytosine (5hmC) has recently been evidenced, but its physiological roles are still largely unknown. Here we show the contribution and function of this mark in mouse ESCs and differentiating embryoid bodies. Transcriptome-wide mapping in ESCs reveals hundreds of messenger RNAs marked by 5hmC at sites characterized by a defined unique consensus sequence and particular features. During differentiation a large number of transcripts, including many encoding key pluripotency-related factors (such as Eed and Jarid2), show decreased cytosine hydroxymethylation. Using Tet-knockout ESCs, we find Tet enzymes to be partly responsible for deposition of 5hmC in mRNA. A transcriptome-wide search further reveals mRNA targets to which Tet1 and Tet2 bind, at sites showing a topology similar to that of 5hmC sites. Tet-mediated RNA hydroxymethylation is found to reduce the stability of crucial pluripotency-promoting transcripts. We propose that RNA cytosine 5-hydroxymethylation by Tets is a mark of transcriptome flexibility, inextricably linked to the balance between pluripotency and lineage commitment.

Overview

The claims and statistics of this paper haven’t been checked yet.

Run the check — free, no account needed. It reads the open-access text and checks the sources it cites.

A few free checks a day · papers already verified open instantly · results are public

Integrity signals

Registry

Crossref · 10.1038/s41467-020-18729-6

Cites

10 of 10 references verified0 citation errors · 0 not checkable

Statistics

Figures

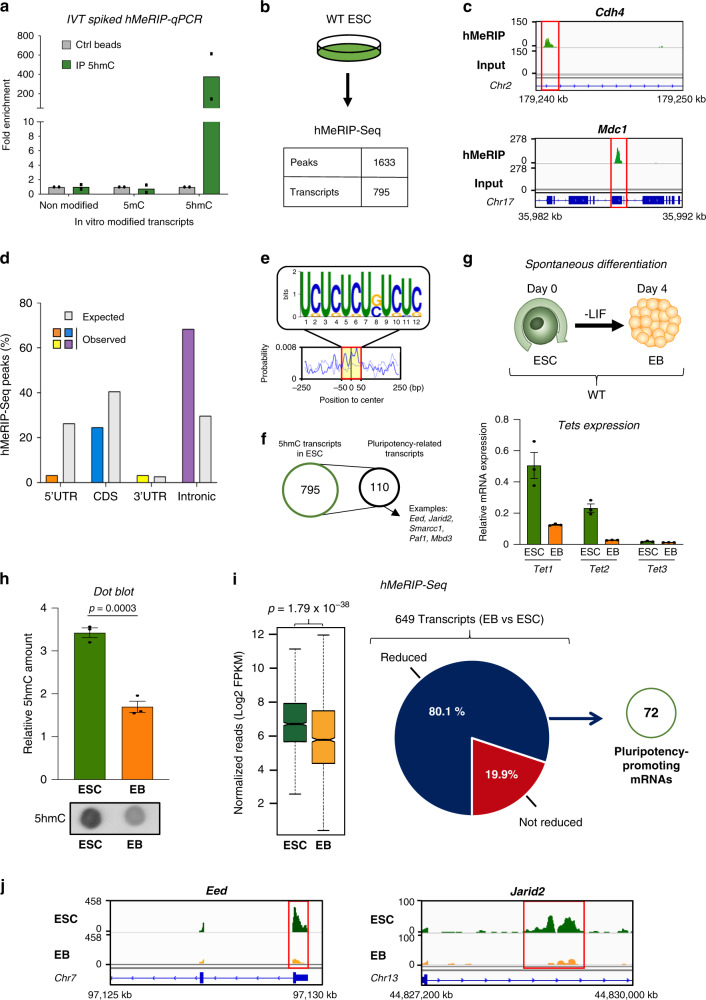
Fig. 1 Transcriptome-wide distribution of 5hmC in ESCs and EBs. a Specificity of 5hmC antibody. Only the 5hmC-modified transcript shows enrichment after hMeRIP compared to the controls. Unmodified, 5mC-modified, and 5hmC-modified transcripts (IVT: in vitro transcribed) were used to spike total RNA prior to hMeRIP-qPCR. Data are means ± SEM (n = 2 independent experiments). b hMeRIP-Seq in WT ESCs reveals the presence of 5hmC within many transcripts (n = 3). Experiments were performed in biological triplicate and results were normalized as described in the “Methods” section. c Exemplative hMeRIP-Seq profiles of Cdh4 and Mdc1 in WT ESCs with their corresponding input control tracks (IGV tracks) (red frame shows peak location). d Bar chart showing the distribution of 5hmC peaks according to the type of structural element within transcripts, next to the expected distribution. e Top sequence motif identified in the centers of 5hmC peaks (E-value < 2.2e−117). f 5hmC is found in many key pluripotency-related mRNAs. Comparison of the above hMeRIP-Seq data sets with publicly available mouse ESC data sets10–14, with representative examples of known transcripts encoding ESC core pluripotency regulators such as Eed, Jarid2, Smarcc1, Paf1, and Mbd3. g Scheme of the previously reported protocol36 used for spontaneous differentiation of ESCs into EBs upon LIF removal, as described in the Methods section, with their relative Tet expression levels as measured by RT-qPCR. Data are means ± SEM (n = 3 independent experiments). h Decreased global 5hmC during spontaneous differentiation, as assessed by dot blotting. Data are means ± SEM (representative blot from three independent experiments, two-tailed Student’s t-test). i Many pluripotency-related transcripts show reduced 5hmC during differentiation. Left: Box plot for hMeRIP-Seq ESCs and EBs (n = 3 independent experiments, two-tailed Student’s t-test). In the box plot, the boxes represent the interquartile range of the records, and the lines across the boxes indicate the median value of the records. The whiskers indicate the highest and lowest values among the records that are no more than 1.5 times greater than the interquartile range. The range between notches represents the 95% confidence interval. Right: Pie chart highlighting the percentage of transcripts showing reduced 5hmC marking, 72 of which are identified as pluripotency-promoting mRNAs. j Exemplative hMeRIP-Seq profiles of Eed and Jarid2 in ESCs vs EBs (IGV tracks) (red frame shows peak location). Source data are provided as a Source Data File.
Fig. 1 Transcriptome-wide distribution of 5hmC in ESCs and EBs. a Specificity of 5hmC antibody. Only the 5hmC-modified transcript shows enrichment after hMeRIP compared to the controls. Unmodified, 5mC-modified, and 5hmC-modified transcripts (IVT: in vitro transcribed) were used to spike total RNA prior to hMeRIP-qPCR. Data are means ± SEM (n = 2 independent experiments). b hMeRIP-Seq in WT ESCs reveals the presence of 5hmC within many transcripts (n = 3). Experiments were performed in biological triplicate and results were normalized as described in the “Methods” section. c Exemplative hMeRIP-Seq profiles of Cdh4 and Mdc1 in WT ESCs with their corresponding input control tracks (IGV tracks) (red frame shows peak location). d Bar chart showing the distribution of 5hmC peaks according to the type of structural element within transcripts, next to the expected distribution. e Top sequence motif identified in the centers of 5hmC peaks (E-value < 2.2e−117). f 5hmC is found in many key pluripotency-related mRNAs. Comparison of the above hMeRIP-Seq data sets with publicly available mouse ESC data sets10–14, with representative examples of known transcripts encoding ESC core pluripotency regulators such as Eed, Jarid2, Smarcc1, Paf1, and Mbd3. g Scheme of the previously reported protocol36 used for spontaneous differentiation of ESCs into EBs upon LIF removal, as described in the Methods section, with their relative Tet expression levels as measured by RT-qPCR. Data are means ± SEM (n = 3 independent experiments). h Decreased global 5hmC during spontaneous differentiation, as assessed by dot blotting. Data are means ± SEM (representative blot from three independent experiments, two-tailed Student’s t-test). i Many pluripotency-related transcripts show reduced 5hmC during differentiation. Left: Box plot for hMeRIP-Seq ESCs and EBs (n = 3 independent experiments, two-tailed Student’s t-test). In the box plot, the boxes represent the interquartile range of the records, and the lines across the boxes indicate the median value of the records. The whiskers indicate the highest and lowest values among the records that are no more than 1.5 times greater than the interquartile range. The range between notches represents the 95% confidence interval. Right: Pie chart highlighting the percentage of transcripts showing reduced 5hmC marking, 72 of which are identified as pluripotency-promoting mRNAs. j Exemplative hMeRIP-Seq profiles of Eed and Jarid2 in ESCs vs EBs (IGV tracks) (red frame shows peak location). Source data are provided as a Source Data File.CC BY · PubMed Central
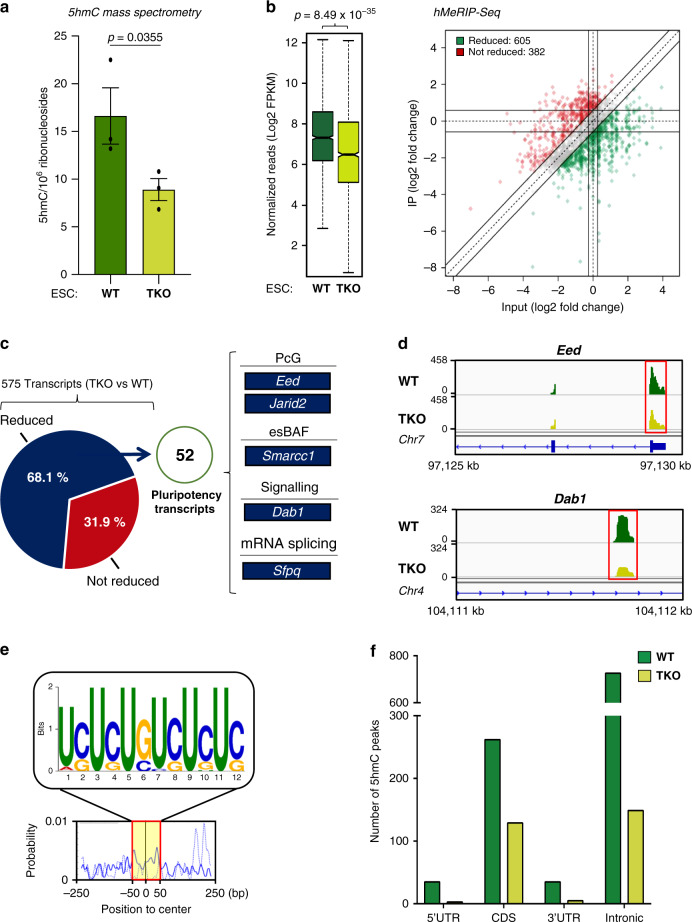
Fig. 2 Tets are required for 5hmC in ESCs, notably of key pluripotency-related mRNAs. a Reduced global 5hmC in TKO ESCs, as measured by mass spectrometry. Data are means ± SEM (n = 3 independent experiments, one-tailed Student’s t-test). Source data are provided as a Source Data File. b Decreased 5hmC at many peaks in TKO ESCs. Left: Box plot showing a significant difference in the normalized number of 5hmC reads between WT and TKO ESCs (n = 3 independent experiments, one-tailed Student’s t-test). In the box plot, the boxes represent the interquartile range of the records, and the lines across the boxes indicate the median value of the records. The whiskers indicate the highest and lowest values among the records that are no more than 1.5 times greater than the interquartile range. The range between notches represents the 95% confidence interval. Right: Quadrant chart showing differential 5hmC peaks in WT vs TKO ESCs. c Tet-mediated 5hmC marking of core pluripotency transcripts. Pie chart highlighting the percentage of transcripts whose 5hmC marking appears reduced, 52 of which are known to be involved in pluripotency. d Exemplative hMeRIP-Seq profiles of Eed and Dab1 in TKO vs WT ESCs (IGV tracks) (red frame shows peak location). e Top sequence motif identified at the centers of 5hmC peaks reduced in WT vs TKO ESCs (E-value < 3.9e−086). f Non-random distribution of Tet-mediated 5hmC marking. Bar chart showing, in WT and TKO ESCs, distinct distributions of 5hmC peaks among types of structural elements within transcripts.
Fig. 2 Tets are required for 5hmC in ESCs, notably of key pluripotency-related mRNAs. a Reduced global 5hmC in TKO ESCs, as measured by mass spectrometry. Data are means ± SEM (n = 3 independent experiments, one-tailed Student’s t-test). Source data are provided as a Source Data File. b Decreased 5hmC at many peaks in TKO ESCs. Left: Box plot showing a significant difference in the normalized number of 5hmC reads between WT and TKO ESCs (n = 3 independent experiments, one-tailed Student’s t-test). In the box plot, the boxes represent the interquartile range of the records, and the lines across the boxes indicate the median value of the records. The whiskers indicate the highest and lowest values among the records that are no more than 1.5 times greater than the interquartile range. The range between notches represents the 95% confidence interval. Right: Quadrant chart showing differential 5hmC peaks in WT vs TKO ESCs. c Tet-mediated 5hmC marking of core pluripotency transcripts. Pie chart highlighting the percentage of transcripts whose 5hmC marking appears reduced, 52 of which are known to be involved in pluripotency. d Exemplative hMeRIP-Seq profiles of Eed and Dab1 in TKO vs WT ESCs (IGV tracks) (red frame shows peak location). e Top sequence motif identified at the centers of 5hmC peaks reduced in WT vs TKO ESCs (E-value < 3.9e−086). f Non-random distribution of Tet-mediated 5hmC marking. Bar chart showing, in WT and TKO ESCs, distinct distributions of 5hmC peaks among types of structural elements within transcripts.CC BY · PubMed Central
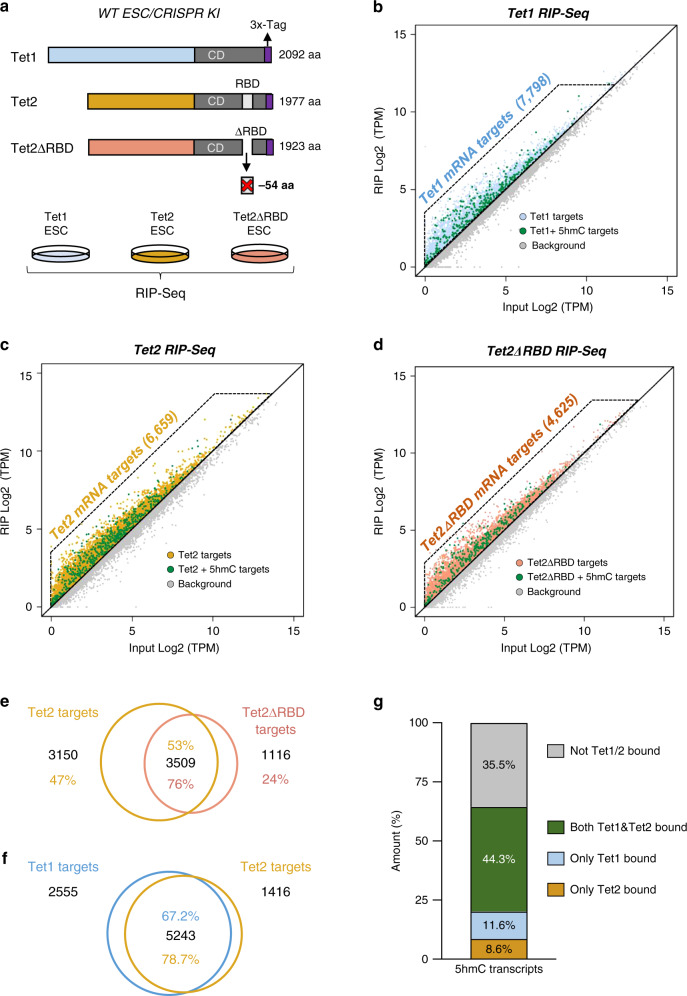
Fig. 3 Tet1 and Tet2 bind to specific mRNAs within the transcriptome. a Diagram illustrating CRISPR-mediated tagging of endogenous Tet1, Tet2, and Tet2ΔRBD proteins (CRISPR KI) and RIP-Seq experiment design. b Many mRNAs are bound by Tet1. Scatterplot showing the log-fold enrichment over input after Tet1-bound RNA immunoprecipitation. c RNA-binding targets of Tet2. Scatterplot showing the log-fold enrichment over input after Tet2-bound RNA immunoprecipitation. d Tet2 RBD is involved in mRNA targeting. Scatterplot showing the log-fold enrichment over input after Tet2ΔRBD-bound RNA immunoprecipitation. e Tet2 binding to many RNAs depends on Tet2 RBD. Venn diagram showing the overlap between Tet2- and Tet2ΔRBD-bound RNA targets identified by RIP-Seq. f Many common Tet1 and Tet2 targets. Venn diagram showing the overlap between Tet1- and Tet2-bound RNA targets identified by RIP-Seq. g 5hmC targets are often bound by both Tet1 and Tet2. Stacked bar chart showing the overlap between 5hmC-containing transcripts and RNA targets bound by both Tet1 and Tet2, only Tet1, or only Tet2. All RIP-Seq were performed at least in biological duplicate.
Fig. 3 Tet1 and Tet2 bind to specific mRNAs within the transcriptome. a Diagram illustrating CRISPR-mediated tagging of endogenous Tet1, Tet2, and Tet2ΔRBD proteins (CRISPR KI) and RIP-Seq experiment design. b Many mRNAs are bound by Tet1. Scatterplot showing the log-fold enrichment over input after Tet1-bound RNA immunoprecipitation. c RNA-binding targets of Tet2. Scatterplot showing the log-fold enrichment over input after Tet2-bound RNA immunoprecipitation. d Tet2 RBD is involved in mRNA targeting. Scatterplot showing the log-fold enrichment over input after Tet2ΔRBD-bound RNA immunoprecipitation. e Tet2 binding to many RNAs depends on Tet2 RBD. Venn diagram showing the overlap between Tet2- and Tet2ΔRBD-bound RNA targets identified by RIP-Seq. f Many common Tet1 and Tet2 targets. Venn diagram showing the overlap between Tet1- and Tet2-bound RNA targets identified by RIP-Seq. g 5hmC targets are often bound by both Tet1 and Tet2. Stacked bar chart showing the overlap between 5hmC-containing transcripts and RNA targets bound by both Tet1 and Tet2, only Tet1, or only Tet2. All RIP-Seq were performed at least in biological duplicate.CC BY · PubMed Central
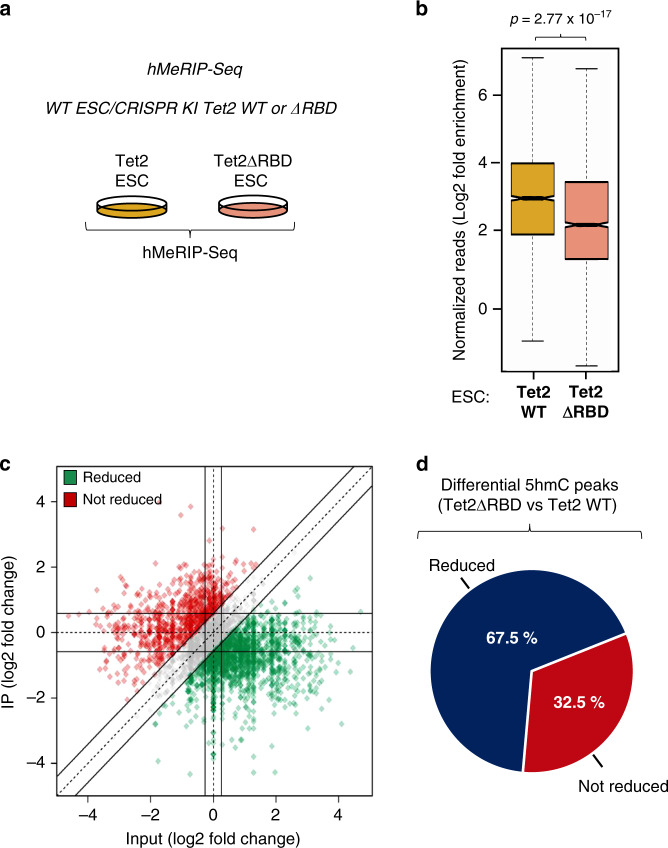
Fig. 4 Tet2-mediated RNA hydroxymethylation depends, at least in part, on Tet2 RBD. a Scheme illustrating the hMeRIP experimental design using CRISPR Tet2WT KI and CRISPR ΔRBD KI ESCs. b Box plot showing a significant difference in the normalized number of 5hmC reads between Tet2WT and Tet2ΔRBD ESCs (n = 3 independent experiments, one-tailed Student’s t-test). In the box plot, the boxes represent the interquartile range of the records, and the lines across the boxes indicate the median value of the records. The whiskers indicate the highest and lowest values among the records that are no more than 1.5 times greater than the interquartile range. The range between notches represents the 95% confidence interval. c Quadrant chart showing differential 5hmC peaks in CRISPR Tet2WT KI vs CRISPR Tet2ΔRBD KI ESCs. d Pie chart highlighting the percentage of transcripts whose 5hmC level is reduced in Tet2ΔRBD- compared to Tet2WT-producing cells.
Fig. 4 Tet2-mediated RNA hydroxymethylation depends, at least in part, on Tet2 RBD. a Scheme illustrating the hMeRIP experimental design using CRISPR Tet2WT KI and CRISPR ΔRBD KI ESCs. b Box plot showing a significant difference in the normalized number of 5hmC reads between Tet2WT and Tet2ΔRBD ESCs (n = 3 independent experiments, one-tailed Student’s t-test). In the box plot, the boxes represent the interquartile range of the records, and the lines across the boxes indicate the median value of the records. The whiskers indicate the highest and lowest values among the records that are no more than 1.5 times greater than the interquartile range. The range between notches represents the 95% confidence interval. c Quadrant chart showing differential 5hmC peaks in CRISPR Tet2WT KI vs CRISPR Tet2ΔRBD KI ESCs. d Pie chart highlighting the percentage of transcripts whose 5hmC level is reduced in Tet2ΔRBD- compared to Tet2WT-producing cells.CC BY · PubMed Central
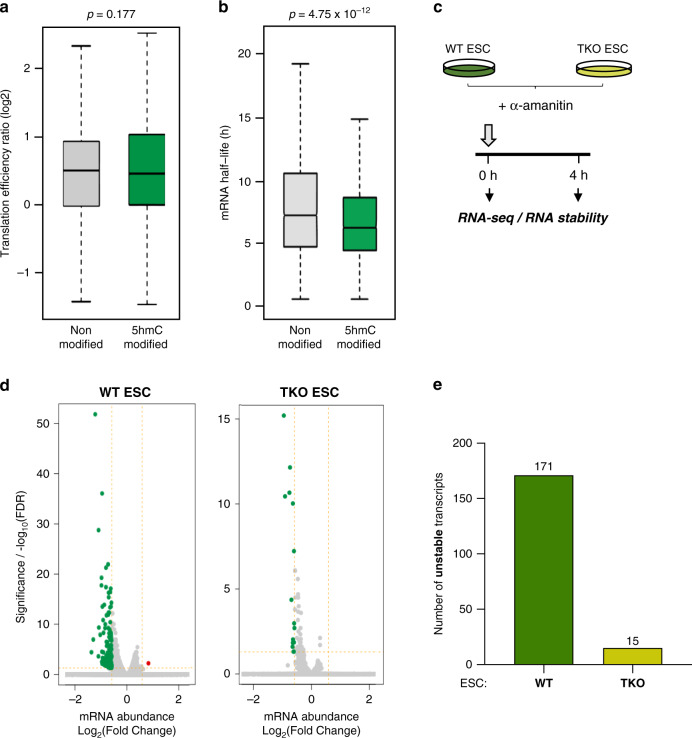
Fig. 5 Transcriptome-wide analysis of RNA stability in WT vs TKO ESCs. a 5hmC does not seem to impact mRNA translation. Box plot showing the translation efficiency of non-modified and 5hmC-modified transcripts in WT ESCs using our hMeRIP-Seq data (n = 3) and published data39 (two-tailed Wilcoxon rank-sum test, P > 0.05). b 5hmC leads to a shorter mRNA half-life. Box plot showing the difference in mRNA half-life between non-modified and 5hmC-modified transcripts in WT ESCs using our hMeRIP-Seq data (n = 3) and published data40 (two-tailed Wilcoxon rank-sum test, P < 10−12). In the box plot, the boxes represent the interquartile range of the records, and the lines across the boxes indicate the median value of the records. The whiskers indicate the highest and lowest values among the records that are no more than 1.5 times greater than the interquartile range. c Scheme illustrating the protocol for transcription inhibition with α-amanitin in WT and TKO ESCs followed by RNA-Seq. Experiments were performed in biological duplicate. d Volcano plots show longer mRNA half-lives in Tet-depleted than WT ESCs. (P-value corrected for multi-testing < 0.05 and FC > 1.5). e Bart chart showing a greater number of unstable transcripts in WT vs TKO ESCs, as determined by RNA-Seq at 0 and 4 h post α-amanitin treatment.
Fig. 5 Transcriptome-wide analysis of RNA stability in WT vs TKO ESCs. a 5hmC does not seem to impact mRNA translation. Box plot showing the translation efficiency of non-modified and 5hmC-modified transcripts in WT ESCs using our hMeRIP-Seq data (n = 3) and published data39 (two-tailed Wilcoxon rank-sum test, P > 0.05). b 5hmC leads to a shorter mRNA half-life. Box plot showing the difference in mRNA half-life between non-modified and 5hmC-modified transcripts in WT ESCs using our hMeRIP-Seq data (n = 3) and published data40 (two-tailed Wilcoxon rank-sum test, P < 10−12). In the box plot, the boxes represent the interquartile range of the records, and the lines across the boxes indicate the median value of the records. The whiskers indicate the highest and lowest values among the records that are no more than 1.5 times greater than the interquartile range. c Scheme illustrating the protocol for transcription inhibition with α-amanitin in WT and TKO ESCs followed by RNA-Seq. Experiments were performed in biological duplicate. d Volcano plots show longer mRNA half-lives in Tet-depleted than WT ESCs. (P-value corrected for multi-testing < 0.05 and FC > 1.5). e Bart chart showing a greater number of unstable transcripts in WT vs TKO ESCs, as determined by RNA-Seq at 0 and 4 h post α-amanitin treatment.CC BY · PubMed Central
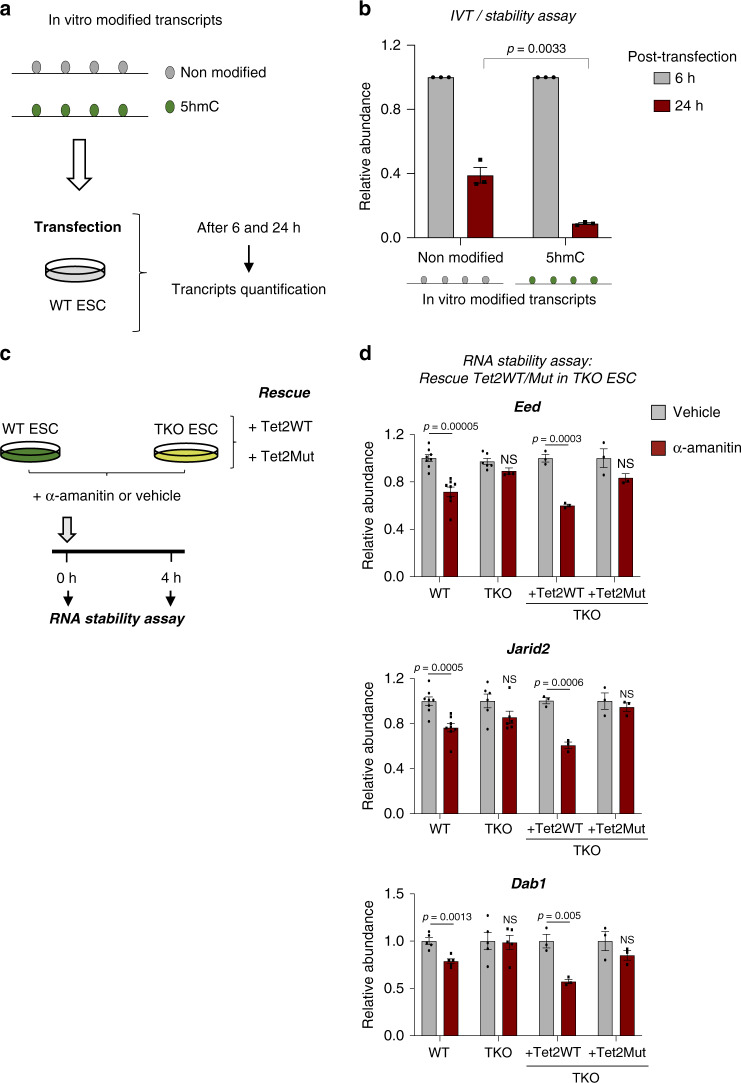
Fig. 6 Tet-mediated 5hmC reduces the stability of core pluripotency transcripts. a Scheme illustrating the protocol used to quantify in vitro unmodified and 5hmC-modified transcript abundance after ESC transfection. b In vitro 5hmC-modified transcripts are less stable than their unmodified counterparts. Unmodified and 5hmC-modified transcript abundances were measured by RT-qPCR at 6 and 24 h post-transfection. RNA levels were normalized to endogenous Gapdh and relative to the transcript level at 6 h post-transfection. Data are means ± SEM (n = 3 independent experiments, two-tailed Student’s t-test). c Scheme illustrating the protocol used to inhibit transcription with α-amanitin in WT and TKO ESCs before performing stability assays to detect rescue of the destabilization process by Tet2WT or its catalytic mutant (Tet2Mut). d Tet2WT but not Tet2Mut restores destabilization of Eed, Jarid2, and Dab1 transcripts in TKO ESCs. 18S rRNA was used as an internal calibrator. Error bars indicate ± SEM for at least three independent experiments. (Two-tailed Student’s t-test; NS not significant). Source data are provided as a Source Data File.
Fig. 6 Tet-mediated 5hmC reduces the stability of core pluripotency transcripts. a Scheme illustrating the protocol used to quantify in vitro unmodified and 5hmC-modified transcript abundance after ESC transfection. b In vitro 5hmC-modified transcripts are less stable than their unmodified counterparts. Unmodified and 5hmC-modified transcript abundances were measured by RT-qPCR at 6 and 24 h post-transfection. RNA levels were normalized to endogenous Gapdh and relative to the transcript level at 6 h post-transfection. Data are means ± SEM (n = 3 independent experiments, two-tailed Student’s t-test). c Scheme illustrating the protocol used to inhibit transcription with α-amanitin in WT and TKO ESCs before performing stability assays to detect rescue of the destabilization process by Tet2WT or its catalytic mutant (Tet2Mut). d Tet2WT but not Tet2Mut restores destabilization of Eed, Jarid2, and Dab1 transcripts in TKO ESCs. 18S rRNA was used as an internal calibrator. Error bars indicate ± SEM for at least three independent experiments. (Two-tailed Student’s t-test; NS not significant). Source data are provided as a Source Data File.CC BY · PubMed Central
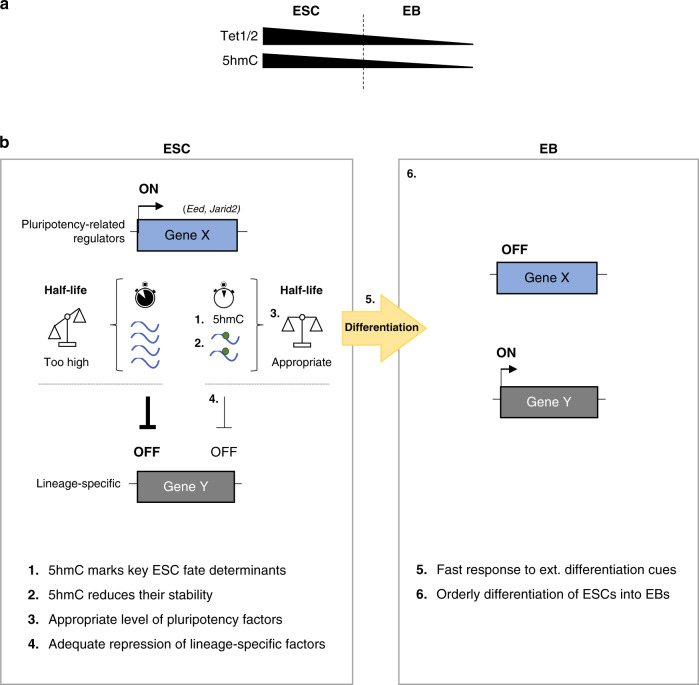
Fig. 7 Model of Tet-mediated 5hmC as a mark of transcriptome flexibility in ESCs. a Scheme illustrating that spontaneous ESC-to-EB differentiation leads to reduced Tet1 and Tet2 expression and to a marked decrease in 5hmC. b 5hmC mRNA modification acts as an essential regulatory layer to safeguard efficient, timely, authentic downregulation of lineage-specific genes. 1. In WT ESCs, Tet1 and Tet2 hydroxymethylate many RNA transcripts, such as those encoding key pluripotency-related regulators (e.g. Eed, Jarid2). 2. 5hmC results in transcript destabilization. 3. This leads to an appropriate expression level (not too high, not too low) of these key cell fate determinants. 4. Consequently, this would ensure adequate repression of lineage-specific factors. 5. This controlled repression critically prepares ESCs to rapidly respond to external cues. 6. This stepwise model would ensure orderly differentiation of ESCs to EBs.
Fig. 7 Model of Tet-mediated 5hmC as a mark of transcriptome flexibility in ESCs. a Scheme illustrating that spontaneous ESC-to-EB differentiation leads to reduced Tet1 and Tet2 expression and to a marked decrease in 5hmC. b 5hmC mRNA modification acts as an essential regulatory layer to safeguard efficient, timely, authentic downregulation of lineage-specific genes. 1. In WT ESCs, Tet1 and Tet2 hydroxymethylate many RNA transcripts, such as those encoding key pluripotency-related regulators (e.g. Eed, Jarid2). 2. 5hmC results in transcript destabilization. 3. This leads to an appropriate expression level (not too high, not too low) of these key cell fate determinants. 4. Consequently, this would ensure adequate repression of lineage-specific factors. 5. This controlled repression critically prepares ESCs to rapidly respond to external cues. 6. This stepwise model would ensure orderly differentiation of ESCs to EBs.CC BY · PubMed Central

Verification

Claims the paper makes

The claims and statistics of this paper haven’t been checked yet.

Run the check — free, no account needed. It reads the open-access text and checks the sources it cites.

A few free checks a day · papers already verified open instantly · results are public

Claims other papers make about this one

Each is checked against this paper’s own text: does it say what the citing paper says it does?

Self-check

Percentages, sums and reported differences re-computed from the paper’s own numbers.

The self-check needs the paper’s full text.

Citations

Cites

Show all 10 references

Research works printed but not linked: 62

  1. Tahiliani, M. et al. Conversion of 5-methylcytosine to 5-hydroxymethylcytosine in mammalian DNA by MLL partner TET1. Science 324, 930–935 (2009). · DOI · Paper page
  2. Ko, M. et al. Impaired hydroxylation of 5-methylcytosine in myeloid cancers with mutant TET2. Nature 468, 839–843 (2010). · DOI · Paper page
  3. Hsu, C.-H. et al. TET1 suppresses cancer invasion by activating the tissue inhibitors of metalloproteinases. Cell Rep. 2, 568–579 (2012). · DOI
  4. Huang, H. et al. TET1 plays an essential oncogenic role in MLL-rearranged leukemia. Proc. Natl Acad. Sci. USA 110, 11994–11999 (2013). · DOI
  5. Li, Z. et al. Deletion of Tet2 in mice leads to dysregulated hematopoietic stem cells and subsequent development of myeloid malignancies. Blood 118, 4509–4518 (2011). · DOI · Paper page
  6. Delatte, B., Deplus, R. & Fuks, F. Playing TETris with DNA modifications. EMBO J. 33, 1198–1211 (2014). · DOI
  7. Wu, X. & Zhang, Y. TET-mediated active DNA demethylation: mechanism, function and beyond. Nat. Rev. Genet. 18, 517–534 (2017). · DOI · Paper page
  8. Wossidlo, M. et al. 5-Hydroxymethylcytosine in the mammalian zygote is linked with epigenetic reprogramming. Nat. Commun. 2, 241 (2011). · DOI
  9. Inoue, A., Matoba, S. & Zhang, Y. Transcriptional activation of transposable elements in mouse zygotes is independent of Tet3-mediated 5-methylcytosine oxidation. Cell Res. 22, 1640–1649 (2012). · DOI
  10. Gu, T.-P. et al. The role of Tet3 DNA dioxygenase in epigenetic reprogramming by oocytes. Nature 477, 606–610 (2011). · DOI
  11. Ito, S. et al. Role of Tet proteins in 5mC to 5hmC conversion, ES-cell self-renewal and inner cell mass specification. Nature 466, 1129–1133 (2010). · DOI · Paper page
  12. Wu, H. et al. Dual functions of Tet1 in transcriptional regulation in mouse embryonic stem cells. Nature 473, 389–393 (2011). · DOI · Paper page
  13. Xu, Y. et al. Genome-wide regulation of 5hmC, 5mC, and gene expression by Tet1 hydroxylase in mouse embryonic stem cells. Mol. Cell 42, 451–464 (2011). · DOI
  14. Ficz, G. et al. Dynamic regulation of 5-hydroxymethylcytosine in mouse ES cells and during differentiation. Nature 473, 398–402 (2011). · DOI
  15. Dawlaty, M. M. et al. Combined deficiency of Tet1 and Tet2 causes epigenetic abnormalities but is compatible with postnatal development. Dev. Cell 24, 310–323 (2013). · DOI
  16. Koh, K. P. et al. Tet1 and Tet2 regulate 5-hydroxymethylcytosine production and cell lineage specification in mouse embryonic stem cells. Cell Stem Cell 8, 200–213 (2011). · DOI · Paper page
  17. Dawlaty, M. M. et al. Tet1 is dispensable for maintaining pluripotency and its loss is compatible with embryonic and postnatal development. Cell Stem Cell 9, 166–175 (2011). · DOI · Paper page
  18. Fu, L. et al. Tet-mediated formation of 5-hydroxymethylcytosine in RNA. J. Am. Chem. Soc. 136, 11582–11585 (2014). · DOI · Paper page
  19. Huber, S. M. et al. Formation and abundance of 5-hydroxymethylcytosine in RNA. Chembiochem 16, 752–755 (2015). · DOI
  20. Huang, W. et al. Formation and determination of the oxidation products of 5-methylcytosine in RNA. Chem. Sci. 7, 5495–5502 (2016). · DOI
  21. Zhang, H.-Y., Xiong, J., Qi, B.-L., Feng, Y.-Q. & Yuan, B.-F. The existence of 5-hydroxymethylcytosine and 5-formylcytosine in both DNA and RNA in mammals. Chem. Commun. 52, 737–740 (2015). · DOI
  22. Delatte, B. et al. RNA biochemistry. Transcriptome-wide distribution and function of RNA hydroxymethylcytosine. Science 351, 282–285 (2016). · DOI · Paper page
  23. Shen, Q. et al. Tet2 promotes pathogen infection-induced myelopoiesis through mRNA oxidation. Nature 554, 123–127 (2018). · DOI · Paper page
  24. Guallar, D. et al. RNA-dependent chromatin targeting of TET2 for endogenous retrovirus control in pluripotent stem cells. Nat. Genet. 50, 443–451 (2018). · DOI · Paper page
  25. Geula, S. et al. Stem cells. m6A mRNA methylation facilitates resolution of naïve pluripotency toward differentiation. Science 347, 1002–1006 (2015). · DOI
  26. Fidalgo, M. et al. Zfp281 coordinates opposing functions of Tet1 and Tet2 in pluripotent states. Cell Stem Cell 19, 355–369 (2016). · DOI
  27. Pinto, J. P. et al. StemChecker: a web-based tool to discover and explore stemness signatures in gene sets. Nucleic Acids Res. 43, W72–W77 (2015). · DOI
  28. Xu, H. et al. ESCAPE: database for integrating high-content published data collected from human and mouse embryonic stem cells. Database 2013, bat045 (2013). · DOI
  29. Young, R. A. Control of the embryonic stem cell state. Cell 144, 940–954 (2011). · DOI
  30. Li, T. et al. Critical role of Tet3 in neural progenitor cell maintenance and terminal differentiation. Mol. Neurobiol. 51, 142–154 (2015). · DOI
  31. Li, X. et al. Tet proteins influence the balance between neuroectodermal and mesodermal fate choice by inhibiting Wnt signaling. Proc. Natl Acad. Sci. USA 113, E8267–E8276 (2016).
  32. He, C. et al. High-resolution mapping of RNA-binding regions in the nuclear proteome of embryonic stem cells. Mol. Cell 64, 416–430 (2016). · DOI
  33. Smith, Z. D., Sindhu, C. & Meissner, A. Molecular features of cellular reprogramming and development. Nat. Rev. Mol. Cell Biol. 17, 139–154 (2016). · DOI · Paper page
  34. Etchegaray, J.-P. et al. The histone deacetylase SIRT6 controls embryonic stem cell fate via TET-mediated production of 5-hydroxymethylcytosine. Nat. Cell Biol. 17, 545–557 (2015). · DOI
  35. Chen, Q., Chen, Y., Bian, C., Fujiki, R. & Yu, X. TET2 promotes histone O-GlcNAcylation during gene transcription. Nature 493, 561–564 (2013). · DOI · Paper page
  36. Deplus, R. et al. TET2 and TET3 regulate GlcNAcylation and H3K4 methylation through OGT and SET1/COMPASS. EMBO J. 32, 645–655 (2013). · DOI · Paper page
  37. Amort, T. et al. Distinct 5-methylcytosine profiles in poly(A) RNA from mouse embryonic stem cells and brain. Genome Biol. 18, 1 (2017). · DOI
  38. Yang, X. et al. 5-methylcytosine promotes mRNA export—NSUN2 as the methyltransferase and ALYREF as an m 5 C reader. Cell Res. 27, 606–625 (2017). · DOI · Paper page
  39. Courtney, D. G. et al. Epitranscriptomic addition of m5C to HIV-1 transcripts regulates viral gene expression. Cell Host Microbe 26, 217–227.e6 (2019). · DOI
  40. Yang, Y. et al. RNA 5-methylcytosine facilitates the maternal-to-zygotic transition by preventing maternal mRNA decay. Mol. Cell 75, 1188–1202.e11 (2019). · DOI
  41. Chen, X. et al. 5-methylcytosine promotes pathogenesis of bladder cancer through stabilizing mRNAs. Nat. Cell Biol. 21, 978–990 (2019). · DOI
  42. Shi, H., Wei, J. & He, C. Where, when, and how: context-dependent functions of RNA methylation writers, readers, and erasers. Mol. Cell 74, 640–650 (2019). · DOI
  43. Zhao, C. & Hamilton, T. Introns regulate the rate of unstable mRNA decay. J. Biol. Chem. 282, 20230–20237 (2007). · DOI
  44. Batista, P. J. et al. m(6)A RNA modification controls cell fate transition in mammalian embryonic stem cells. Cell Stem Cell 15, 707–719 (2014). · DOI
  45. Wang, Y. et al. N6-methyladenosine modification destabilizes developmental regulators in embryonic stem cells. Nat. Cell Biol. 16, 191–198 (2014). · DOI
  46. Ran, F. A. et al. Genome engineering using the CRISPR-Cas9 system. Nat. Protoc. 8, 2281–2308 (2013). · DOI · Paper page
  47. Guo, Y.-L., Chakraborty, S., Rajan, S. S., Wang, R. & Huang, F. Effects of oxidative stress on mouse embryonic stem cell proliferation, apoptosis, senescence, and self-renewal. Stem Cells Dev. 19, 1321–1331 (2010). · DOI
  48. Delatte, B. et al. Genome-wide hydroxymethylcytosine pattern changes in response to oxidative stress. Sci. Rep. 5, 1–10 (2015). · DOI
  49. Chen, S. et al. AfterQC: automatic filtering, trimming, error removing and quality control for fastq data. BMC Bioinformatics 18, 80 (2017).
  50. Langmead, B. & Salzberg, S. L. Fast gapped-read alignment with Bowtie 2. Nat. Methods 9, 357–359 (2012). · DOI · Paper page
  51. Bolger, A. M., Lohse, M. & Usadel, B. Trimmomatic: a flexible trimmer for Illumina sequence data. Bioinformatics Oxf. Engl. 30, 2114–2120 (2014). · DOI · Paper page
  52. Dobin, A. et al. STAR: ultrafast universal RNA-seq aligner. Bioinformatics 29, 15–21 (2013). · DOI · Paper page
  53. Zhang, Y. et al. Model-based analysis of ChIP-Seq (MACS). Genome Biol. 9, R137 (2008).
  54. Quinlan, A. R. & Hall, I. M. BEDTools: a flexible suite of utilities for comparing genomic features. Bioinformatics Oxf. Engl. 26, 841–842 (2010). · DOI · Paper page
  55. Robinson, J. T. et al. Integrative genomics viewer. Nat. Biotechnol. 29, 24–26 (2011). · DOI · Paper page
  56. Bailey, T. L. et al. MEME SUITE: tools for motif discovery and searching. Nucleic Acids Res. 37, W202–W208 (2009). · DOI · Paper page
  57. Li, B. & Dewey, C. N. RSEM: accurate transcript quantification from RNA-Seq data with or without a reference genome. BMC Bioinformatics 12, 323 (2011).
  58. Anders, S., Pyl, P. T. & Huber, W. HTSeq—a Python framework to work with high-throughput sequencing data. Bioinformatics Oxf. Engl. 31, 166–169 (2015). · DOI · Paper page
  59. Wroblewska, L. et al. Mammalian synthetic circuits with RNA binding proteins for RNA-only delivery. Nat. Biotechnol. 33, 839–841 (2015). · DOI
  60. Love, M. I., Huber, W. & Anders, S. Moderated estimation of fold change and dispersion for RNA-seq data with DESeq2. Genome Biol. 15, 550 (2014).
  61. Middleton, R. et al. IRFinder: assessing the impact of intron retention on mammalian gene expression. Genome Biol. 18, 51 (2017). · DOI
  62. Liao, Y., Smyth, G. K. & Shi, W. featureCounts: an efficient general purpose program for assigning sequence reads to genomic features. Bioinformatics Oxf. Engl. 30, 923–930 (2014). · DOI · Paper page

Cited by

See all 76

Metadata

Authors
Lan, J., Rajan, N., Bizet, M., Penning, A., Singh, N. K., Guallar, D., Calonne, E., Li Greci, A., Bonvin, E., Deplus, R., Hsu, P. J., Nachtergaele, S., Ma, C., Song, R., Fuentes-Iglesias, A., Hassabi, B., Putmans, P., Mies, F., Menschaert, G., Wong, J. J. L., Wang, J., Fidalgo, M., Yuan, B., & Fuks, F.
Venue
Nature Communications
Published
2020-10-02
Volume
11
Issue
1
ISSN
2041-1723
Cited by
76
References
10
Language
en

About these checks

Registry, retraction, Cites and statistics results are computed, not judged, with one exception: a printed reference that no index lists is read once by a model before it counts as a citation error. Claims are extracted by a model and kept only when their quote appears verbatim in the text; each cited source is then checked, with a model’s help, for whether it says what the claim relies on. Those verdicts can be wrong — read the claim’s quote and the cited source before relying on one.

Statistics and arithmetic are recomputed, not judged.

Confidence bands are shown only for fields calibrated on our annotated test set. None is calibrated yet, so no band is shown.

What counts as a claim ›How we measure confidence ›How we check this ›

Are you an author, or do you see a problem with this page? Request a review

How to cite

Cite CoChat for the checks on this page, and the paper for its own findings.

This page
CoChat. (2026). Citation check: Functional role of Tet-mediated RNA hydroxymethylcytosine in mouse ES cells and during differentiation. https://app.cochat.ai/papers/10.1038/s41467-020-18729-6
The paper
Lan, J., Rajan, N., Bizet, M., Penning, A., Singh, N. K., Guallar, D., Calonne, E., Li Greci, A., Bonvin, E., Deplus, R., Hsu, P. J., Nachtergaele, S., Ma, C., Song, R., Fuentes-Iglesias, A., Hassabi, B., Putmans, P., Mies, F., Menschaert, G., . . . Fuks, F. (2020). Functional role of Tet-mediated RNA hydroxymethylcytosine in mouse ES cells and during differentiation. Nature Communications. https://doi.org/10.1038/s41467-020-18729-6