

The DOI matches its Crossref record; 23 of the 23 references it cites were found in a registry or an index.
Host immunity modulates the efficacy of microbiota transplantation for treatment of Clostridioides difficile infection
Abstract
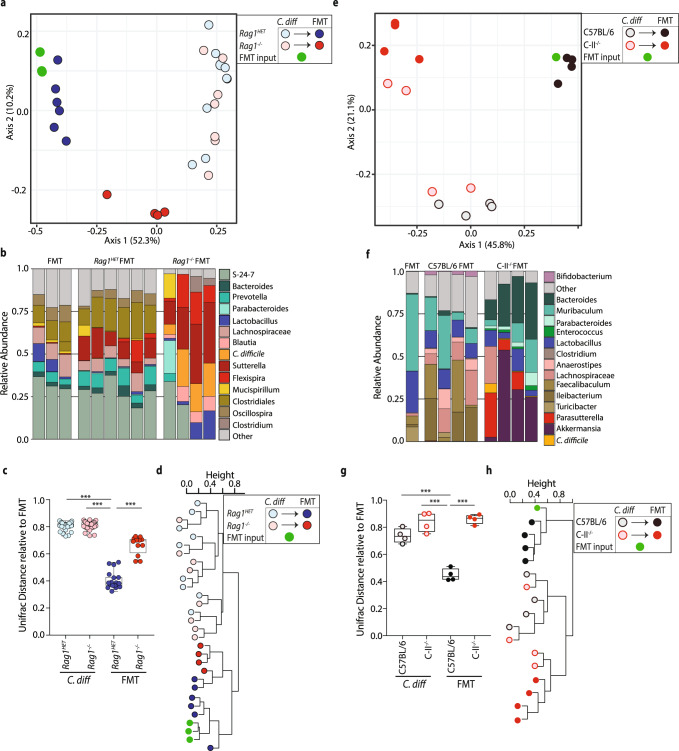
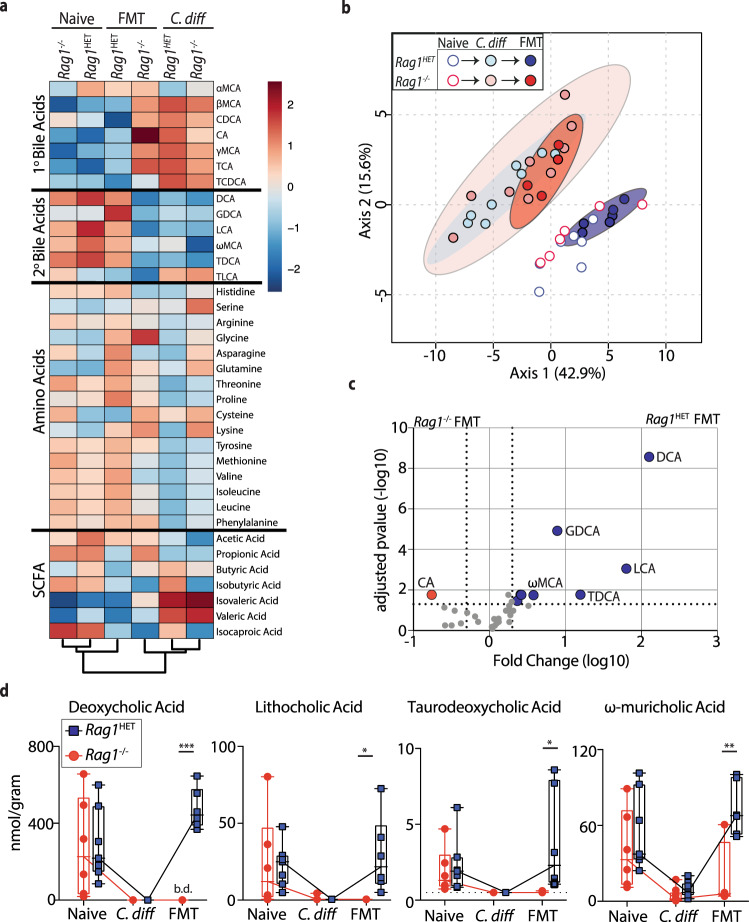
Fecal microbiota transplantation (FMT) is a successful therapeutic strategy for treating recurrent Clostridioides difficile infection. Despite remarkable efficacy, implementation of FMT therapy is limited and the mechanism of action remains poorly understood. Here, we demonstrate a critical role for the immune system in supporting FMT using a murine C. difficile infection system. Following FMT, Rag1 heterozygote mice resolve C. difficile while littermate Rag1 −/− mice fail to clear the infection. Targeted ablation of adaptive immune cell subsets reveal a necessary role for CD4 + Foxp3 + T-regulatory cells, but not B cells or CD8 + T cells, in FMT-mediated resolution of C. difficile infection. FMT non-responsive mice exhibit exacerbated inflammation, impaired engraftment of the FMT bacterial community and failed restoration of commensal bacteria-derived secondary bile acid metabolites in the large intestine. These data demonstrate that the host’s inflammatory immune status can limit the efficacy of microbiota-based therapeutics to treat C. difficile infection.
Overview
The claims and statistics of this paper haven’t been checked yet.
Run the check — free, no account needed. It reads the open-access text and checks the sources it cites.
Integrity signals
Registry
Cites
Statistics
Figures
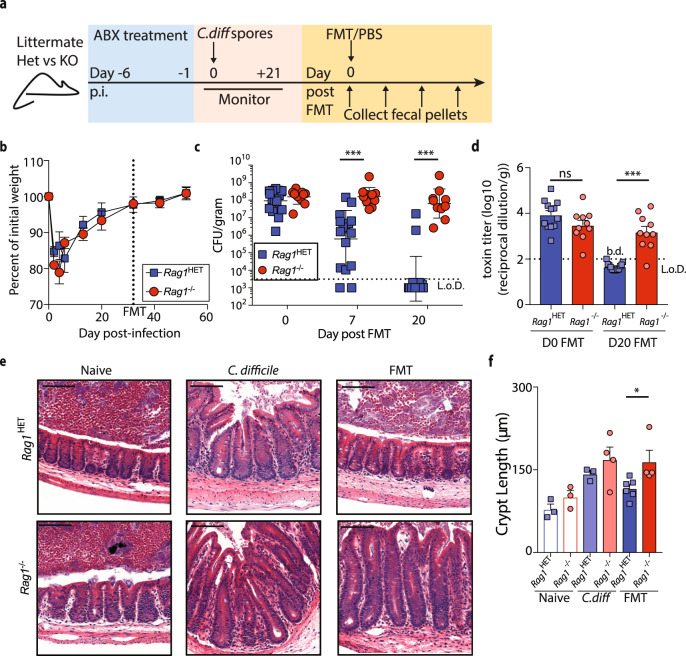
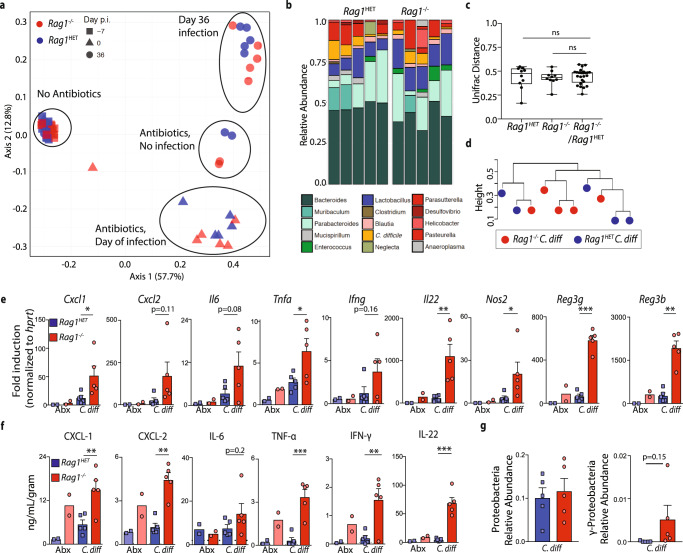
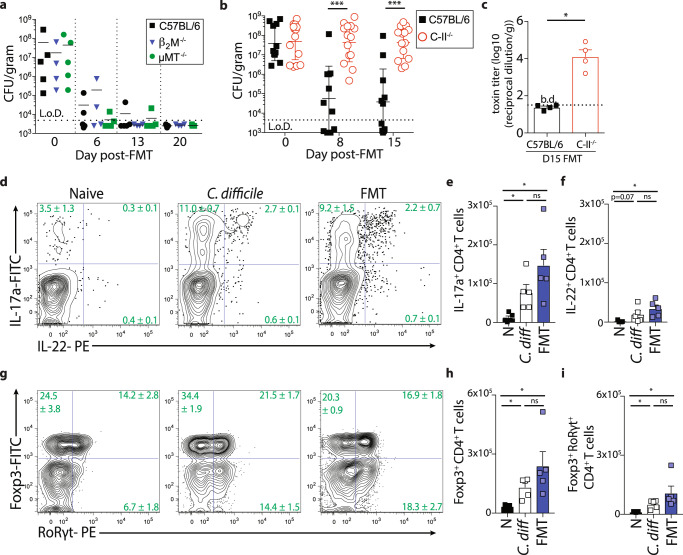
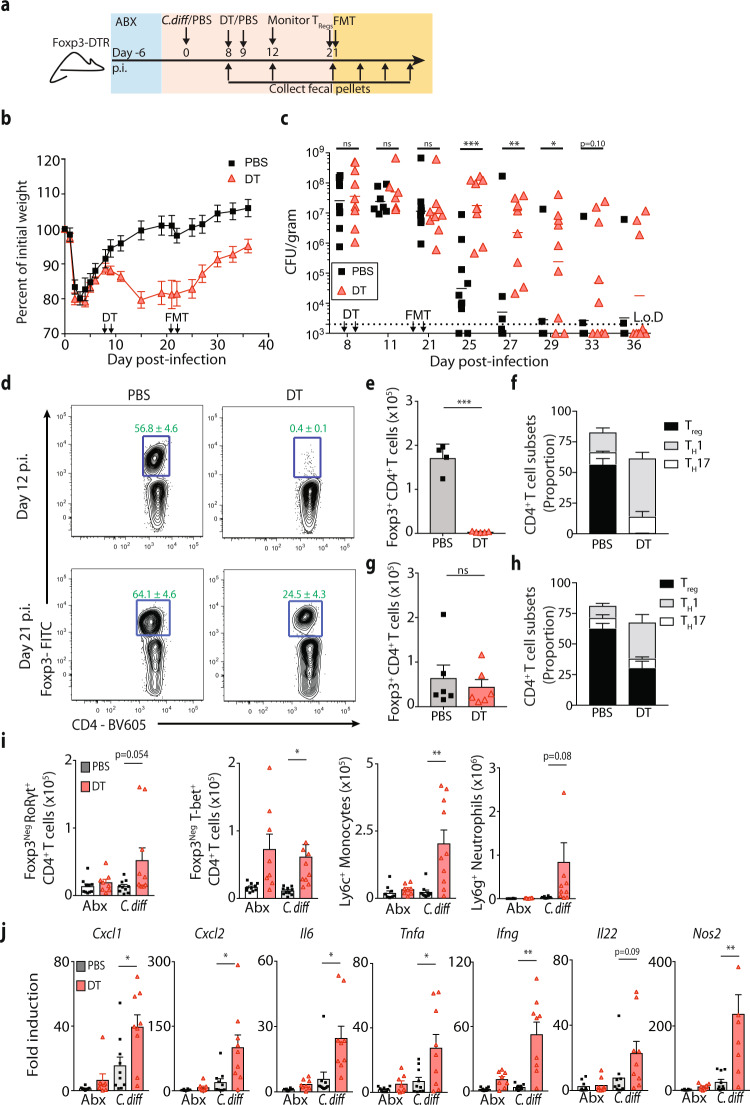
Verification
Claims the paper makes
The claims and statistics of this paper haven’t been checked yet.
Run the check — free, no account needed. It reads the open-access text and checks the sources it cites.
Claims other papers make about this one
Each is checked against this paper’s own text: does it say what the citing paper says it does?
The source backs part of the claim, not all of it — or backs it for a different population, condition or comparison.
In the citing paper
“Fecal microbiota transplant (FMT) is the most direct approach for gut microbiota modulation in the treatment of several digestive diseases11,12.”
From Combining gut microbiota modulation and chemotherapy by capecitabine-loaded prebiotic nanoparticle improves colorectal cancer therapy (2023) · cites this paper as [11]
Experimental — accuracy not yet measured
Self-check
Percentages, sums and reported differences re-computed from the paper’s own numbers.
The self-check needs the paper’s full text.
Citations
Cites
Reproducible, interactive, scalable and extensible microbiome data science using QIIME 2
Bolyen, E., Rideout, J. R., Dillon, M. R., Bokulich, N. A., Abnet, C. C., Al-Ghalith, G. A., Alexander, H., Alm, E. J., Arumugam, M., Asnicar, F., et al. (2019) · Nature Biotechnology · doi:10.1038/s41587-019-0209-9 · Cited by 23,742
Self-citationCommensal Bifidobacterium promotes antitumor immunity and facilitates anti–PD-L1 efficacy
Sivan, A., Corrales, L., Hubert, N., Williams, J. B., Aquino-Michaels, K., Earley, Z. M., Benyamin, F. W., Man Lei, Y., Jabri, B., Alegre, M.-L., et al. (2015) · Science · doi:10.1126/science.aac4255 · Cited by 3,888
Duodenal Infusion of Donor Feces for Recurrent Clostridium difficile
van Nood, E., Vrieze, A., Nieuwdorp, M., Fuentes, S., Zoetendal, E. G., de Vos, W. M., Visser, C. E., Kuijper, E. J., Bartelsman, J. F. W. M., Tijssen, J. G. P., et al. (2013) · New England Journal of Medicine · doi:10.1056/nejmoa1205037 · Cited by 3,708
Anticancer immunotherapy by CTLA-4 blockade relies on the gut microbiota
Vétizou, M., Pitt, J. M., Daillère, R., Lepage, P., Waldschmitt, N., Flament, C., Rusakiewicz, S., Routy, B., Roberti, M. P., Duong, C. P. M., et al. (2015) · Science · doi:10.1126/science.aad1329 · Cited by 3,488
Treg induction by a rationally selected mixture of Clostridia strains from the human microbiota
Atarashi, K., Tanoue, T., Oshima, K., Suda, W., Nagano, Y., Nishikawa, H., Fukuda, S., Saito, T., Narushima, S., Hase, K., et al. (2013) · Nature · doi:10.1038/nature12331 · Cited by 2,872
Bile salt biotransformations by human intestinal bacteria
Ridlon, J. M., Kang, D.-J., & Hylemon, P. B. (2006) · Journal of Lipid Research · doi:10.1194/jlr.r500013-jlr200 · Cited by 2,829
Burden of Clostridium difficile Infection in the United States
Lessa, F. C., Mu, Y., Bamberg, W. M., Beldavs, Z. G., Dumyati, G. K., Dunn, J. R., Farley, M. M., Holzbauer, S. M., Meek, J. I., Phipps, E. C., et al. (2015) · New England Journal of Medicine · doi:10.1056/nejmoa1408913 · Cited by 2,641
Human nutrition, the gut microbiome and the immune system
Kau, A. L., Ahern, P. P., Griffin, N. W., Goodman, A. L., & Gordon, J. I. (2011) · Nature · doi:10.1038/nature10213 · Cited by 2,588
A microbial symbiosis factor prevents intestinal inflammatory disease
Mazmanian, S. K., Round, J. L., & Kasper, D. L. (2008) · Nature · doi:10.1038/nature07008 · Cited by 2,340
Role of the gut microbiota in immunity and inflammatory disease
Kamada, N., Seo, S.-U., Chen, G. Y., & Núñez, G. (2013) · Nature reviews. Immunology · doi:10.1038/nri3430 · Cited by 2,256
Ivanov, I. I., Frutos, R. D. L., Manel, N., Yoshinaga, K., Rifkin, D. B., Sartor, R. B., Finlay, B. B., & Littman, D. R. (2008) · Cell Host & Microbe · doi:10.1016/j.chom.2008.09.009 · Cited by 1,770
Guidelines for diagnosis, treatment, and prevention of Clostridium difficile infections
Surawicz, C. M., Brandt, L. J., Binion, D. G., Ananthakrishnan, A. N., Curry, S. R., Gilligan, P. H., McFarland, L. V., Mellow, M., & Zuckerbraun, B. S. (2013) · American Journal of Gastroenterology · doi:10.1038/ajg.2013.4 · Cited by 1,645
Bile acid metabolites control TH17 and Treg cell differentiation
Hang, S., Paik, D., Yao, L., Kim, E., Trinath, J., Lu, J., Ha, S., Nelson, B. N., Kelly, S. P., Wu, L., et al. (2019) · Nature · doi:10.1038/s41586-019-1785-z · Cited by 1,457
The Influence of the Gut Microbiome on Cancer, Immunity, and Cancer Immunotherapy
Gopalakrishnan, V., Helmink, B. A., Spencer, C. N., Reuben, A., & Wargo, J. A. (2018) · Cancer Cell · doi:10.1016/j.ccell.2018.03.015 · Cited by 1,392
Stecher, B., Robbiani, R., Walker, A. W., Westendorf, A. M., Barthel, M., Kremer, M., Chaffron, S., Macpherson, A. J., Buer, J., Parkhill, J., et al. (2007) · PLoS Biology · doi:10.1371/journal.pbio.0050244 · Cited by 1,048
Theriot, C. M., Koenigsknecht, M. J., Carlson, P. E., Hatton, G. E., Nelson, A. M., Li, B., Huffnagle, G. B., Z. Li, J., & Young, V. B. (2014) · Nature Communications · doi:10.1038/ncomms4114 · Cited by 974
Bacterial metabolism of bile acids promotes generation of peripheral regulatory T cells
Campbell, C., McKenney, P. T., Konstantinovsky, D., Isaeva, O. I., Schizas, M., Verter, J., Mai, C., Jin, W.-B., Guo, C.-J., Violante, S., et al. (2020) · Nature · doi:10.1038/s41586-020-2193-0 · Cited by 901
Individual intestinal symbionts induce a distinct population of RORγ + regulatory T cells
Sefik, E., Geva-Zatorsky, N., Oh, S., Konnikova, L., Zemmour, D., McGuire, A. M., Burzyn, D., Ortiz-Lopez, A., Lobera, M., Yang, J., et al. (2015) · Science · doi:10.1126/science.aaa9420 · Cited by 879
Rivera-Chávez, F., Zhang, L. F., Faber, F., Lopez, C. A., Byndloss, M. X., Olsan, E. E., Xu, G., Velazquez, E. M., Lebrilla, C. B., Winter, S. E., et al. (2016) · Cell Host & Microbe · doi:10.1016/j.chom.2016.03.004 · Cited by 864
Ott, S. J., Waetzig, G. H., Rehman, A., Moltzau-Anderson, J., Bharti, R., Grasis, J. A., Cassidy, L., Tholey, A., Fickenscher, H., Seegert, D., et al. (2017) · Gastroenterology · doi:10.1053/j.gastro.2016.11.010 · Cited by 695
Lawley, T. D., Clare, S., Walker, A. W., Stares, M. D., Connor, T. R., Raisen, C., Goulding, D., Rad, R., Schreiber, F., Brandt, C., et al. (2012) · PLoS Pathogens · doi:10.1371/journal.ppat.1002995 · Cited by 540
Thanissery, R., Winston, J. A., & Theriot, C. M. (2017) · Anaerobe · doi:10.1016/j.anaerobe.2017.03.004 · Cited by 242
Friedman, E. S., Li, Y., Shen, T.-C. D., Jiang, J., Chau, L., Adorini, L., Babakhani, F., Edwards, J., Shapiro, D., Zhao, C., et al. (2018) · Gastroenterology · doi:10.1053/j.gastro.2018.08.022 · Cited by 149
Self-citation
Research works printed but not linked: 75
- Hartstra, A. V., Bouter, K. E., Backhed, F. & Nieuwdorp, M. Insights into the role of the microbiome in obesity and type 2 diabetes. Diabetes Care 38, 159–165 (2015). · DOI · Paper page
- Bashiardes, S., Tuganbaev, T., Federici, S. & Elinav, E. The microbiome in anti-cancer therapy. Semin. Immunol. 32, 74–81 (2017). · DOI
- Cammarota, G. et al. The involvement of gut microbiota in inflammatory bowel disease pathogenesis: potential for therapy. Pharm. Ther. 149, 191–212 (2015). · DOI
- Hsiao, E. Y. et al. Microbiota modulate behavioral and physiological abnormalities associated with neurodevelopmental disorders. Cell 155, 1451–1463 (2013). · DOI · Paper page
- Buffington, S. A. et al. Microbial reconstitution reverses maternal diet-induced social and synaptic deficits in offspring. Cell 165, 1762–1775 (2016). · DOI · Paper page
- Ridaura, V. K. et al. Gut microbiota from twins discordant for obesity modulate metabolism in mice. Science 341, 1241214 (2013). · DOI · Paper page
- Buffie, C. G. et al. Precision microbiome reconstitution restores bile acid mediated resistance to Clostridium difficile. Nature 517, 205–208 (2015). · DOI · Paper page
- Steidler, L. et al. Treatment of murine colitis by Lactococcus lactis secreting interleukin-10. Science 289, 1352–1355 (2000). · DOI · Paper page
- Sgritta, M. et al. Mechanisms underlying microbial-mediated changes in social behavior in mouse models of autism spectrum disorder. Neuron 101, 246–259 e246 (2019). · DOI · Paper page
- Mimee, M., Citorik, R. J. & Lu, T. K. Microbiome therapeutics - advances and challenges. Adv. Drug Deliv. Rev. 105, 44–54 (2016). · DOI
- Gupta, S., Allen-Vercoe, E. & Petrof, E. O. Fecal microbiota transplantation: in perspective. Ther. Adv. Gastroenterol. 9, 229–239 (2016). · DOI
- Guh, A. Y. et al. Trends in U.S. burden of clostridioides difficile infection and outcomes. N. Engl. J. Med. 382, 1320–1330 (2020). · DOI
- Drekonja, D. M. et al. Comparative effectiveness of Clostridium difficile treatments: a systematic review. Ann. Intern. Med 155, 839–847 (2011). · DOI
- Dudukgian, H., Sie, E., Gonzalez-Ruiz, C., Etzioni, D. A. & Kaiser, A. M. C. difficile colitis–predictors of fatal outcome. J. Gastrointest. Surg. 14, 315–322 (2010). · DOI
- Viswanathan, V. K., Mallozzi, M. J. & Vedantam, G. Clostridium difficile infection: an overview of the disease and its pathogenesis, epidemiology and interventions. Gut Microbes 1, 234–242 (2010). · DOI
- Debast, S. B., Bauer, M. P. & Kuijper, E. J. European Society of Clinical Microbiology and Infectious Diseases European Society of Clinical Microbiology and Infectious Diseases: update of the treatment guidance document for Clostridium difficile infection. Clin. Microbiol Infect. 20, 1–26 (2014). · DOI
- Jernberg, C., Lofmark, S., Edlund, C. & Jansson, J. K. Long-term ecological impacts of antibiotic administration on the human intestinal microbiota. ISME J. 1, 56–66 (2007). · DOI · Paper page
- Schubert, A. M. et al. Microbiome data distinguish patients with Clostridium difficile infection and non-C. difficile-associated diarrhea from healthy controls. MBio 5, e01021–01014 (2014). · DOI
- Seekatz, A. M. et al. Recovery of the gut microbiome following fecal microbiota transplantation. MBio 5, e00893–00814 (2014). · DOI
- Seekatz, A. M. et al. Restoration of short chain fatty acid and bile acid metabolism following fecal microbiota transplantation in patients with recurrent Clostridium difficile infection. Anaerobe 53, 64–73 (2018). · DOI
- Weingarden, A. R. et al. Microbiota transplantation restores normal fecal bile acid composition in recurrent Clostridium difficile infection. Am. J. Physiol. Gastrointest. Liver Physiol. 306, G310–G319 (2014). · DOI · Paper page
- Weingarden, A. R. et al. Changes in colonic bile acid composition following fecal microbiota transplantation are sufficient to control Clostridium difficile germination and growth. PLoS ONE 11, e0147210 (2016). · DOI
- Khan, M. Y., Dirweesh, A., Khurshid, T. & Siddiqui, W. J. Comparing fecal microbiota transplantation to standard-of-care treatment for recurrent Clostridium difficile infection: a systematic review and meta-analysis. Eur. J. Gastroenterol. Hepatol. 30, 1309–1317 (2018). · DOI
- Seekatz, A. M. et al. Fecal microbiota transplantation eliminates clostridium difficile in a murine model of relapsing disease. Infect. Immun. 83, 3838–3846 (2015). · DOI
- Abt, M. C. et al. Innate immune defenses mediated by two ilc subsets are critical for protection against acute Clostridium difficile infection. Cell Host Microbe 18, 27–37 (2015). · DOI
- Hasegawa, M. et al. Interleukin-22 regulates the complement system to promote resistance against pathobionts after pathogen-induced intestinal damage. Immunity 41, 620–632 (2014). · DOI
- Leslie, J. L., Vendrov, K. C., Jenior, M. L. & Young, V. B. The gut microbiota is associated with clearance of Clostridium difficile infection independent of adaptive immunity. mSphere 4, e00698-18 (2019). · DOI
- Chen, X. et al. A mouse model of Clostridium difficile-associated disease. Gastroenterology 135, 1984–1992 (2008). · DOI · Paper page
- Korn, L. L. et al. Conventional CD4+ T cells regulate IL-22-producing intestinal innate lymphoid cells. Mucosal. Immunol. 7, 1045–1057 (2014). · DOI
- Janda, J. M. & Abbott, S. L. 16S rRNA gene sequencing for bacterial identification in the diagnostic laboratory: pluses, perils, and pitfalls. J. Clin. Microbiol 45, 2761–2764 (2007). · DOI
- Lupp, C. et al. Host-mediated inflammation disrupts the intestinal microbiota and promotes the overgrowth of Enterobacteriaceae. Cell Host Microbe 2, 119–129 (2007). · DOI
- Johnston, P. F., Gerding, D. N. & Knight, K. L. Protection from Clostridium difficile infection in CD4 T Cell- and polymeric immunoglobulin receptor-deficient mice. Infect. Immun. 82, 522–531 (2014). · DOI
- Sakaguchi, S., Yamaguchi, T., Nomura, T. & Ono, M. Regulatory T cells and immune tolerance. Cell 133, 775–787 (2008). · DOI
- Kim, J. M., Rasmussen, J. P. & Rudensky, A. Y. Regulatory T cells prevent catastrophic autoimmunity throughout the lifespan of mice. Nat. Immunol. 8, 191–197 (2007). · DOI
- Bos, P. D., Plitas, G., Rudra, D., Lee, S. Y. & Rudensky, A. Y. Transient regulatory T cell ablation deters oncogene-driven breast cancer and enhances radiotherapy. J. Exp. Med. 210, 2435–2466 (2013). · DOI
- Battaglioli, E. J. et al. Clostridioides difficile uses amino acids associated with gut microbial dysbiosis in a subset of patients with diarrhea. Sci. Transl. Med. 10 (2018). · DOI
- Fletcher, J. R., Erwin, S., Lanzas, C. & Theriot, C. M. Shifts in the Gut Metabolome and Clostridium difficile Transcriptome throughout Colonization and Infection in a Mouse Model. mSphere 3, eaam7019 (2018). · DOI
- Ferreyra, J. A. et al. Gut microbiota-produced succinate promotes C. difficile infection after antibiotic treatment or motility disturbance. Cell Host Microbe 16, 770–777 (2014). · DOI
- Nagao-Kitamoto, H. et al. Interleukin-22-mediated host glycosylation prevents Clostridioides difficile infection by modulating the metabolic activity of the gut microbiota. Nat. Med. 26, 608–617 (2020). · DOI
- Theriot, C. M., Bowman, A. A. & Young, V. B. Antibiotic-induced alterations of the gut microbiota alter secondary bile acid production and allow for Clostridium difficile spore germination and outgrowth in the large intestine. mSphere 1, e00045-15 (2016). · DOI · Paper page
- Francis, M. B., Allen, C. A. & Sorg, J. A. Muricholic acids inhibit Clostridium difficile spore germination and growth. PLoS ONE 8, e73653 (2013). · DOI
- Sorg, J. A. & Sonenshein, A. L. Inhibiting the initiation of Clostridium difficile spore germination using analogs of chenodeoxycholic acid, a bile acid. J. Bacteriol. 192, 4983–4990 (2010). · DOI · Paper page
- Winter, S. E., Lopez, C. A. & Baumler, A. J. The dynamics of gut-associated microbial communities during inflammation. EMBO Rep. 14, 319–327 (2013). · DOI
- Winter, S. E. et al. Gut inflammation provides a respiratory electron acceptor for Salmonella. Nature 467, 426–429 (2010). · DOI
- Winter, S. E. et al. Host-derived nitrate boosts growth of E. coli in the inflamed gut. Science 339, 708–711 (2013). · DOI · Paper page
- Thiennimitr, P. et al. Intestinal inflammation allows Salmonella to use ethanolamine to compete with the microbiota. Proc. Natl Acad. Sci. USA 108, 17480–17485 (2011). · DOI
- Spees, A. M. et al. Streptomycin-induced inflammation enhances Escherichia coli gut colonization through nitrate respiration. MBio 4, e00430-13 (2013). · DOI
- Hughes, E. R. & Winter, S. E. Enterococcus faecalis: E. coli’s Siderophore-Inducing Sidekick. Cell Host Microbe 20, 411–412 (2016). · DOI
- Gillis, C. C. et al. Dysbiosis-associated change in host metabolism generates lactate to support salmonella growth. Cell Host Microbe 23, 54–64 e56 (2018). · DOI
- Byndloss, M. X. et al. Microbiota-activated PPAR-gamma signaling inhibits dysbiotic Enterobacteriaceae expansion. Science 357, 570–575 (2017). · DOI
- Staley, C., Weingarden, A. R., Khoruts, A. & Sadowsky, M. J. Interaction of gut microbiota with bile acid metabolism and its influence on disease states. Appl. Microbiol. Biotechnol. 101, 47–64 (2017). · DOI
- Sorg, J. A. & Sonenshein, A. L. Bile salts and glycine as cogerminants for Clostridium difficile spores. J. Bacteriol. 190, 2505–2512 (2008). · DOI · Paper page
- Wilson, K. H. Efficiency of various bile salt preparations for stimulation of Clostridium difficile spore germination. J. Clin. Microbiol. 18, 1017–1019 (1983). · DOI
- Song, X. et al. Microbial bile acid metabolites modulate gut RORgamma(+) regulatory T cell homeostasis. Nature 577, 410–415 (2020). · DOI · Paper page
- Burrello, C. et al. Therapeutic faecal microbiota transplantation controls intestinal inflammation through IL10 secretion by immune cells. Nat. Commun. 9, 5184 (2018). · DOI
- Zuo, T. et al. Bacteriophage transfer during faecal microbiota transplantation in Clostridium difficile infection is associated with treatment outcome. Gut 67, 634–643 (2018).
- Hargreaves, K. R. & Clokie, M. R. Clostridium difficile phages: still difficult? Front. Microbiol. 5, 184 (2014). · DOI
- Gogokhia, L. et al. Expansion of bacteriophages is linked to aggravated intestinal inflammation and colitis. Cell Host Microbe 25, 285–299 e288 (2019). · DOI
- Carlson, P. E. Jr. Regulatory considerations for fecal microbiota transplantation products. Cell Host Microbe 27, 173–175 (2020). · DOI
- Di Bella, S., Gouliouris, T. & Petrosillo, N. Fecal microbiota transplantation (FMT) for Clostridium difficile infection: focus on immunocompromised patients. J. Infect. Chemother. 21, 230–237 (2015). · DOI
- Kelly, C. R. et al. Fecal microbiota transplant for treatment of Clostridium difficile infection in immunocompromised patients. Am. J. Gastroenterol. 109, 1065–1071 (2014). · DOI · Paper page
- Moss, E. L. et al. Long-term taxonomic and functional divergence from donor bacterial strains following fecal microbiota transplantation in immunocompromised patients. PLoS ONE 12, e0182585 (2017). · DOI
- Staley, C. et al. Durable long-term bacterial engraftment following encapsulated fecal microbiota transplantation to treat Clostridium difficile infection. MBio 10, e01586-19 (2019). · DOI
- Popoff, M. R., Rubin, E. J., Gill, D. M. & Boquet, P. Actin-specific ADP-ribosyltransferase produced by a Clostridium difficile strain. Infect. Immun. 56, 2299–2306 (1988). · DOI
- Sorg, J. A. & Dineen, S. S. Laboratory maintenance of Clostridium difficile. Curr. Protoc. Microbio.l Chapter 9, Unit9A 1 (2009). · DOI
- Jarchum, I., Liu, M., Lipuma, L. & Pamer, E. G. Toll-like receptor 5 stimulation protects mice from acute Clostridium difficile colitis. Infect. Immun. 79, 1498–1503 (2011). · DOI
- Edgar, R. C. UPARSE: highly accurate OTU sequences from microbial amplicon reads. Nat. Methods 10, 996–998 (2013). · DOI
- Lee, Y. J. et al. Protective factors in the intestinal microbiome against Clostridium difficile infection in recipients of allogeneic hematopoietic stem cell transplantation. J. Infect. Dis. 215, 1117–1123 (2017). · DOI
- McMurdie, P. J. & Holmes, S. phyloseq: an R package for reproducible interactive analysis and graphics of microbiome census data. PLoS ONE 8, e61217 (2013). · DOI
- Wickham, H. ggplot2: Elegant Graphics for Data Analysis. (New York, Springer-Verlag, 2016). · DOI
- Callahan, B. J. et al. DADA2: high-resolution sample inference from Illumina amplicon data. Nat. Methods 13, 581–583 (2016). · DOI · Paper page
- Katoh, K. & Standley, D. M. MAFFT multiple sequence alignment software version 7: improvements in performance and usability. Mol. Biol. Evol. 30, 772–780 (2013). · DOI · Paper page
- Price, M. N., Dehal, P. S. & Arkin, A. P. FastTree 2–approximately maximum-likelihood trees for large alignments. PLoS ONE 5, e9490 (2010). · DOI · Paper page
- Ramsteijn, A. S., Jasarevic, E., Houwing, D. J., Bale, T. L. & Olivier, J. D. Antidepressant treatment with fluoxetine during pregnancy and lactation modulates the gut microbiome and metabolome in a rat model relevant to depression. Gut Microbes 11, 735–753 (2020). · DOI
- Ni, J. et al. A role for bacterial urease in gut dysbiosis and Crohn’s disease. Sci. Transl. Med. 9, eaah6888 (2017). · DOI
Cited by
Sorted by citations
Lang, T., Zhu, R., Zhu, X., Yan, W., Li, Y., Zhai, Y., Wu, T., Huang, X., Yin, Q., & Li, Y. (2023) · Nature Communications · doi:10.1038/s41467-023-40439-y · Cited by 133
Gubert, C., Choo, J. M., Love, C. J., Kodikara, S., Masson, B. A., Liew, J. J. M., Wang, Y., Kong, G., Narayana, V. K., Renoir, T., et al. (2022) · Brain Communications · doi:10.1093/braincomms/fcac205 · Cited by 71
Metadata
- Authors
- Littmann, E. R., Lee, J.-J., Denny, J. E., Alam, Z., Maslanka, J. R., Zarin, I., Matsuda, R., Carter, R. A., Susac, B., Saffern, M. S., Fett, B., Mattei, L. M., Bittinger, K., & Abt, M. C.
- Venue
- Nature Communications
- Published
- 2021-02-02
- Volume
- 12
- Issue
- 1
- ISSN
- 2041-1723
- PMC
- PMC7854624
- Cited by
- 88
- References
- 23
- Language
- en
- Funders
- U.S. Department of Health & Human Services | NIH | National Institute of Allergy and Infectious Diseases (AI125786)
About these checks
Registry, retraction, Cites and statistics results are computed, not judged, with one exception: a printed reference that no index lists is read once by a model before it counts as a citation error. Claims are extracted by a model and kept only when their quote appears verbatim in the text; each cited source is then checked, with a model’s help, for whether it says what the claim relies on. Those verdicts can be wrong — read the claim’s quote and the cited source before relying on one.
Statistics and arithmetic are recomputed, not judged.
Confidence bands are shown only for fields calibrated on our annotated test set. None is calibrated yet, so no band is shown.
What counts as a claim ›How we measure confidence ›How we check this ›
Are you an author, or do you see a problem with this page? Request a review
