

The DOI matches its Crossref record; 76 of the 77 references it cites were found in a registry or an index, and 1 are not checked yet.
Mapping mutations to the SARS-CoV-2 RBD that escape binding by different classes of antibodies
Open accessPublished version of a preprint
Abstract
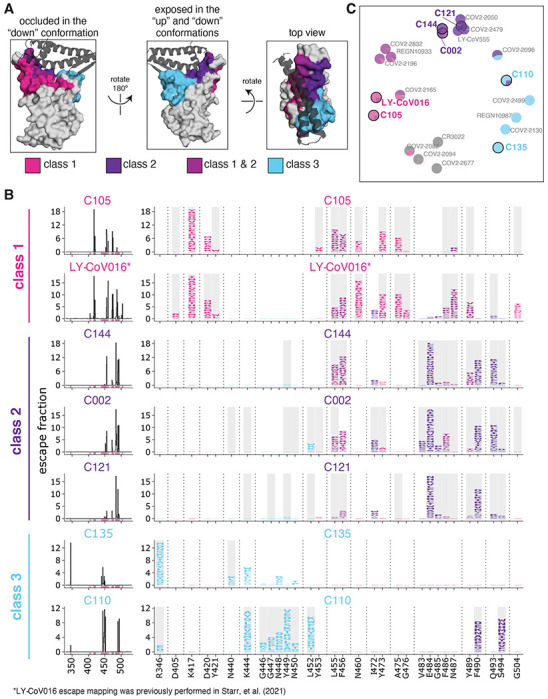
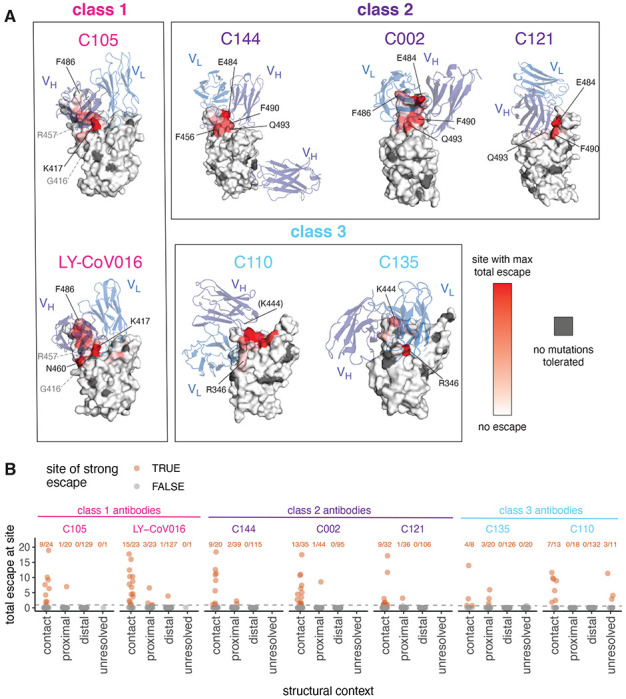
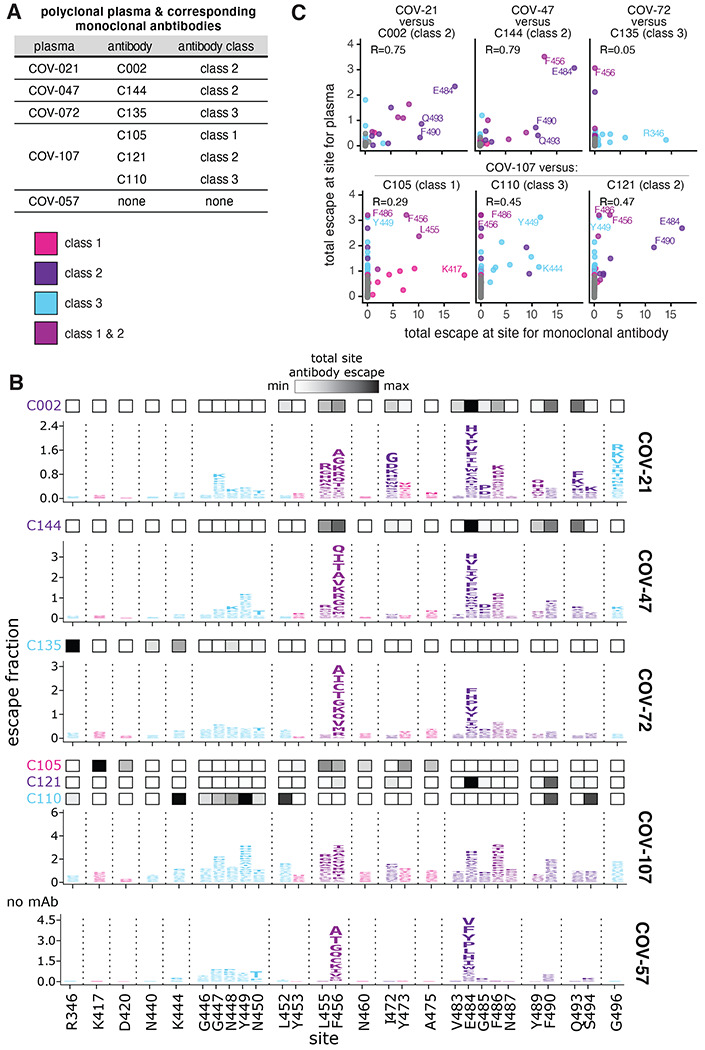
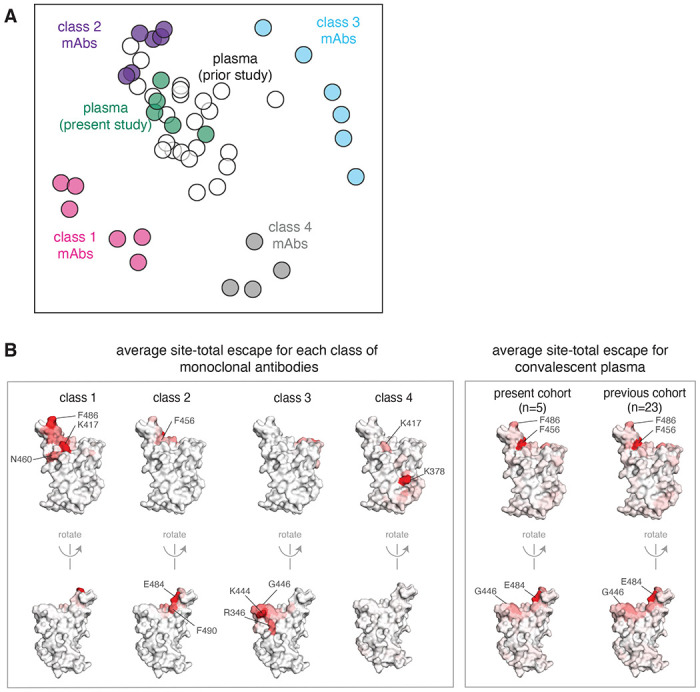
Monoclonal antibodies targeting a variety of epitopes have been isolated from individuals previously infected with SARS-CoV-2, but the relative contributions of these different antibody classes to the polyclonal response remains unclear. Here we use a yeast-display system to map all mutations to the viral spike receptor-binding domain (RBD) that escape binding by representatives of three potently neutralizing classes of anti-RBD antibodies with high-resolution structures. We compare the antibody-escape maps to similar maps for convalescent polyclonal plasmas, including plasmas from individuals from whom some of the antibodies were isolated. While the binding of polyclonal plasma antibodies are affected by mutations across multiple RBD epitopes, the plasma-escape maps most resemble those of a single class of antibodies that target an epitope on the RBD that includes site E484. Therefore, although the human immune system can produce antibodies that target diverse RBD epitopes, in practice the polyclonal response to infection is skewed towards a single class of antibodies targeting an epitope that is already undergoing rapid evolution.
Overview
The claims and statistics of this paper haven’t been checked yet.
Run the check — free, no account needed. It reads the open-access text and checks the sources it cites.
Integrity signals
Registry
Cites
Statistics
Figures
Verification
Claims the paper makes
The claims and statistics of this paper haven’t been checked yet.
Run the check — free, no account needed. It reads the open-access text and checks the sources it cites.
Claims other papers make about this one
Each is checked against this paper’s own text: does it say what the citing paper says it does?
The source backs part of the claim, not all of it — or backs it for a different population, condition or comparison.
In the citing paper
“Mutations at F486 are associated with a reduction in neutralizing activity by class 1 (and some class 2) neutralizing antibodies and by polyclonal sera9–11.”
From Emergence of SARS-CoV-2 Omicron lineages BA.4 and BA.5 in South Africa (2022) · cites this paper as [9]
Experimental — accuracy not yet measuredIn the citing paper
“mutations at this position have been associated with a reduction in neutralization by monoclonal antibodies (particularly class 2 antibodies) and polyclonal sera9–11.”
From Emergence of SARS-CoV-2 Omicron lineages BA.4 and BA.5 in South Africa (2022) · cites this paper as [9]
Self-check
Percentages, sums and reported differences re-computed from the paper’s own numbers.
The self-check needs the paper’s full text.
Citations
Cites
MAFFT Multiple Sequence Alignment Software Version 7: Improvements in Performance and Usability
Katoh, K., & Standley, D. M. (2013) · Molecular Biology and Evolution · doi:10.1093/molbev/mst010 · Cited by 46,209
Structure of the SARS-CoV-2 spike receptor-binding domain bound to the ACE2 receptor
Lan, J., Ge, J., Yu, J., Shan, S., Zhou, H., Fan, S., Zhang, Q., Shi, X., Wang, Q., Zhang, L., et al. (2020) · Nature · doi:10.1038/s41586-020-2180-5 · Cited by 5,983
Letko, M., Marzi, A., & Munster, V. (2020) · Nature Microbiology · doi:10.1038/s41564-020-0688-y · Cited by 3,109
Detection of a SARS-CoV-2 variant of concern in South Africa
Tegally, H., Wilkinson, E., Giovanetti, M., Iranzadeh, A., Fonseca, V., Giandhari, J., Doolabh, D., Pillay, S., San, E. J., Msomi, N., et al. (2021) · Nature · doi:10.1038/s41586-021-03402-9 · Cited by 2,510
Antibody Resistance of SARS-CoV-2 Variants B.1.351 and B.1.1.7
Wang, P., Nair, M. S., Liu, L., Iketani, S., Luo, Y., Guo, Y., Wang, M., Yu, J., Zhang, B., Kwong, P. D., et al. (2021) · doi:10.1101/2021.01.25.428137 · Cited by 2,328
Antibody resistance of SARS-CoV-2 variants B.1.351 and B.1.1.7
Wang, P., Nair, M. S., Liu, L., Iketani, S., Luo, Y., Guo, Y., Wang, M., Yu, J., Zhang, B., Kwong, P. D., et al. (2021) · Nature · doi:10.1038/s41586-021-03398-2 · Cited by 2,312
Bio3d: an R package for the comparative analysis of protein structures
Grant, B. J., Rodrigues, A. P. C., ElSawy, K. M., McCammon, J. A., & Caves, L. S. D. (2006) · Bioinformatics · doi:10.1093/bioinformatics/btl461 · Cited by 2,005
Starr, T. N., Greaney, A. J., Hilton, S. K., Ellis, D., Crawford, K. H. D., Dingens, A. S., Navarro, M. J., Bowen, J. E., Tortorici, M. A., Walls, A. C., et al. (2020) · Cell · doi:10.1016/j.cell.2020.08.012 · Cited by 1,956
Self-citationData, disease and diplomacy: GISAID's innovative contribution to global health
Elbe, S., & Buckland‐Merrett, G. (2017) · Global Challenges · doi:10.1002/gch2.1018 · Cited by 1,928
Mapping the Antigenic and Genetic Evolution of Influenza Virus
Smith, D. J., Lapedes, A. S., de Jong, J. C., Bestebroer, T. M., Rimmelzwaan, G. F., Osterhaus, A. D. M. E., & Fouchier, R. A. M. (2004) · Science · doi:10.1126/science.1097211 · Cited by 1,868
Research works printed but not linked: 1
- Chen, R. E. et al. Resistance of SARS-CoV-2 variants to neutralization by monoclonal and serum-derived polyclonal antibodies. Nat. Med. https://doi.org/10.1038/s41591-021-01294-w (2021). · DOI · Paper page
Cited by
Sorted by citations
Items 201–300 of 444
Compensatory epistasis maintains ACE2 affinity in SARS-CoV-2 Omicron BA.1Preprint
Moulana, A., Dupic, T., Phillips, A. M., Chang, J., Nieves, S., Roffler, A. A., Greaney, A. J., Starr, T. N., Bloom, J. D., & Desai, M. M. (2022) · bioRxiv (Cold Spring Harbor Laboratory) · doi:10.1101/2022.06.17.496635 · Cited by 13
Self-citationGenerative prediction of real-world prevalent SARS-CoV-2 mutation with in silico virus evolution
Liu, X., Nie, Z., Si, H.-R., Shen, X., Liu, Y., Huang, X., Dong, T., Xu, F., Ren, Z., Zhou, P., et al. (2025) · Briefings in Bioinformatics · doi:10.1093/bib/bbaf276 · Cited by 13
“Regardless of geographic location, SARS-CoV-2 evolves within and between hosts [3], involving the action of multiple selective pressures [4–7].”
Biophysical Fitness Landscape of the SARS-CoV-2 Delta Variant Receptor Binding Domain
Patrick, C., Upadhyay, V., Lucas, A., & Mallela, K. M. G. (2022) · Journal of Molecular Biology · doi:10.1016/j.jmb.2022.167622 · Cited by 12
“Left panels show the complex structures and right panels show the location of the interacting residues in RBD. Figure 6.”
BackgroundInfluentialImbrechts, M., Maes, W., Ampofo, L., den Berghe, N. V., Calcoen, B., Looveren, D. V., Kerstens, W., Rasulova, M., Vercruysse, T., Noppen, S., et al. (2022) · iScience · doi:10.1016/j.isci.2022.104705 · Cited by 13
Kwon, H., Košíková, M., Tang, W., Ortega‐Rodriguez, U., Radvák, P., Xiang, R., Mercer, K. E., Muskhelishvili, L., Davis, K., Ward, J. M., et al. (2022) · iScience · doi:10.1016/j.isci.2022.105507 · Cited by 11
“The Q or K substitution at E484 is a strong class 2 antibody escapemutation and particularly renders the sensitivity to polyclonal plasma antibodies.(18,22,25) 1Laboratory of Pediatric and Respiratory Viral Diseases, Division of Viral Products, Office of Vaccines Research and Review, Center for Biologics Evaluation an…”
Chan, C. W. F., Wang, B., Nan, L., Huang, X., Mao, T., Chu, H. Y., Luo, C., Shum, H. C., Choi, G. C. G., Shum, H. C., et al. (2023) · Nature Biomedical Engineering · doi:10.1038/s41551-023-01140-z · Cited by 14
Bruhn, M., Obara, M., Chiyyeadu, A., Costa, B., Salam, A., Ziegler, A., Waltl, I., Pavlou, A., Bonifacius, A., Hoffmann, M., et al. (2024) · European Journal of Immunology · doi:10.1002/eji.202451056 · Cited by 12
“Consequently, virus exposed to polyclonal serum antibodies escapes from neutralization by the insertion of a few mutations in the spike protein that prevent the most dominant antibody classes from binding [4].”
BackgroundAn Antigenic Space Framework for Understanding Antibody Escape of SARS-CoV-2 Variants
Miller, N. L., Clark, T., Raman, R., & Sasisekharan, R. (2021) · Viruses · doi:10.3390/v13102009 · Cited by 10
Valiente, P. A., Nim, S., Lee, J., Kim, S., & Kim, P. M. (2022) · Journal of Chemical Information and Modeling · doi:10.1021/acs.jcim.2c00500 · Cited by 12
Verstraete, M. M., Heinkel, F., Li, J., Cao, S., Tran, A., Halverson, E. C., Gene, R. W., Stangle, E., Silva‐Moreno, B., Arrafi, S., et al. (2023) · mAbs · doi:10.1080/19420862.2023.2212415 · Cited by 12
SARS-CoV-2 Portrayed against HIV: Contrary Viral Strategies in Similar Disguise
Duerr, R., Crosse, K. M., Valero-Jimenez, A. M., & Dittmann, M. (2021) · Microorganisms · doi:10.3390/microorganisms9071389 · Cited by 12
SARS-CoV-2: Vaccinology and Emerging therapeutics; Challenges and Future Developments
Adesokan, A. M., Obeid, M. A., & Lawal, A. F. (2022) · Therapeutic Delivery · doi:10.4155/tde-2021-0075 · Cited by 12
Risk assessment of SARS-CoV-2 replicating and evolving in animals
Zhao, J., Kang, M., Wu, H., Sun, B., Baele, G., He, W., Lu, M., Suchard, M. A., Ji, X., He, N., et al. (2023) · Trends in Microbiology · doi:10.1016/j.tim.2023.07.002 · Cited by 12
Complexity of Viral Epitope Surfaces as Evasive Targets for Vaccines and Therapeutic Antibodies
Miller, N. L., Raman, R., Clark, T., & Sasisekharan, R. (2022) · Frontiers in Immunology · doi:10.3389/fimmu.2022.904609 · Cited by 12
“other hand, similar information has also been generated experimentally through deep mutational scanning (DMS) techniques (11, 37, 39), in which all single mutations on a wild-type antigen (in this case the SARS-CoV-2 RBD) are mutated in parallel via yeast display and assayed for their effects on binding to a given ant…”
Parigger, L., Krassnigg, A., Schopper, T., Singh, A., Tappler, K., Köchl, K., Hetmann, M., Gruber, K. F., Steinkellner, G., & Gruber, C. C. (2022) · Frontiers in Medicine · doi:10.3389/fmed.2022.1061142 · Cited by 12
Safety and immunogenicity of a recombinant protein RBD fusion heterodimer vaccine against SARS-CoV-2
Leal, L., Pich, J., Ferrer, L., Nava, J., Martí‐Lluch, R., Esteban, I., Pradenas, E., Regué, D. R., Prenafeta, A., Escobar, K., et al. (2023) · npj Vaccines · doi:10.1038/s41541-023-00736-5 · Cited by 13
“The RBD is a key functional component within the S protein that is responsible for binding SARS-CoV-2 to its cell receptor 5 , and it is one of the main targets for neutralizing antibodies 6 .”
BackgroundSchröder, S., Richter, A. M., Veith, T., Emanuel, J., Gudermann, L., Friedmann, K., Jeworowski, L. M., Mühlemann, B., Jones, T. C., Müller, M. A., et al. (2023) · Virology Journal · doi:10.1186/s12985-023-02154-4 · Cited by 10
“Studies of protein structure and antibody binding have generated a detailed image of the antigenic domains of S [6, 7, 9, 17, 18].”
BackgroundResultSims, J. J., Lian, S., Meggersee, R., Kasimsetty, A., & Wilson, J. M. (2022) · PLoS ONE · doi:10.1371/journal.pone.0271359 · Cited by 10
“Several groups have identified several sites present in the functional binding epitope of the RBD 82 spike protein that have undergone mutations to evade all currently available classes of 83 monoclonal antibodies (9-11).”
BackgroundOliveira, J. R., Remuzgo, C., Machado, R. R. G., Magawa, J. Y., Daher, I. P., Urbanski, A. H., Schmitz, G. J. H., Arcuri, H. A., Ferreira, M. A., Sasahara, G. L., et al. (2023) · Frontiers in Immunology · doi:10.3389/fimmu.2022.1010105 · Cited by 11
“Also, others have shown that all sites at which mutations strongly escape binding are in direct (<4 Å) or proximal (4–8 Å) contact with antibodies in resolved structures (9).”
BackgroundGhoula, M., Kongmeneck, A. D., Eid, R., Camproux, A., & Moroy, G. (2023) · The Journal of Physical Chemistry B · doi:10.1021/acs.jpcb.3c01467 · Cited by 12
Chi, L. A., Barnes, J. E., Patel, J. S., & Ytreberg, F. M. (2024) · Scientific Reports · doi:10.1038/s41598-024-72491-z · Cited by 10
Dadonaite, B., Burrell, A. R., Logue, J., Chu, H. Y., Payne, D. C., Haslam, D. B., Staat, M. A., & Bloom, J. D. (2025) · Journal of Virology · doi:10.1128/jvi.00109-25 · Cited by 10
“Therefore, although the RBD remains the major target of neutralizing antibodies for imprinted adult sera (16, 34, 41), mutations in the NTD clearly also play an important role in the antigenic evolution of SARS-CoV-2, especially with respect to primary infection sera.”
InfluentialSelf-citationEhling, R. A., Minot, M., Overath, M. D., Sheward, D. J., Han, J., Gao, B., Taft, J. M., Pertseva, M., Weber, C. R., Frei, L., et al. (2025) · Cell Systems · doi:10.1016/j.cels.2025.101391 · Cited by 8
Verkhivker, G. M. (2022) · International Journal of Molecular Sciences · doi:10.3390/ijms23042172 · Cited by 9
Luo, Y., Liu, S., Xue, J., Yang, Y., Zhao, J., Sun, Y., Wang, B., Yin, S., Li, J., Xia, Y., et al. (2023) · Cell Discovery · doi:10.1038/s41421-023-00534-2 · Cited by 10
Spike substitution T813S increases Sarbecovirus fusogenicity by enhancing the usage of TMPRSS2
Ma, Y., Li, P., Hu, Y., Qiu, T., Wang, L., Lu, H., Lv, K., Xu, M., Zhuang, J., Liu, X., et al. (2023) · PLoS Pathogens · doi:10.1371/journal.ppat.1011123 · Cited by 10
Koseki, J., Hayashi, S., Kojima, Y., Hirose, H., & Shimamura, T. (2023) · Computational and Structural Biotechnology Journal · doi:10.1016/j.csbj.2023.05.009 · Cited by 10
“On the other hand, Greaney et al. classified our Binding Patterns 3 and 4 into the same class (Class 3) when using antibody escape as the classification criteria [16].”
MethodInfluentialComprehensive profiling of neutralizing polyclonal sera targeting coxsackievirus B3
Álvarez‐Rodríguez, B., Buceta, J., & Geller, R. (2023) · Nature Communications · doi:10.1038/s41467-023-42144-2 · Cited by 10
Early detection of emerging SARS-CoV-2 variants of interest for experimental evaluation
Wallace, Z. S., Davis, J. J., Niewiadomska, A. M., Olson, R., Shukla, M. P., Stevens, R. L., Zhang, Y., Zmasek, C. M., & Scheuermann, R. H. (2022) · Frontiers in Bioinformatics · doi:10.3389/fbinf.2022.1020189 · Cited by 8
REGEN-COV protects against viral escape in preclinical and human studiesPreprint
Copin, R., Baum, A., Wloga, E. H., Pascal, K. E., Giordano, S., Fulton, B. O., Zhou, A., Negron, N., Lanza, K., Chan, N., et al. (2021) · bioRxiv (Cold Spring Harbor Laboratory) · doi:10.1101/2021.03.10.434834 · Cited by 10
Verkhivker, G. M., Agajanian, S., Kassab, R., & Krishnan, K. (2022) · Biomolecules · doi:10.3390/biom12070964 · Cited by 11
“Functional mapping of mutations in the S-RBD regions using deep muta- 124 tional scanning showed that sites of antibody mutational escape are constrained by 125 requirement of the protein stability and ACE2 binding, rationalizing why escape-re- 126 sistant antibody cocktails often curtail virus evolvability to acquire…”
MethodSoluble ACE2 correlates with severe COVID-19 and can impair antibody responses
Lebedin, M. Y., Ratswohl, C., Garg, A. K., Schips, M., García, C. V., Spatt, L., Thibeault, C., Obermayer, B., Weiner, J. M., Velásquez, I. M., et al. (2024) · iScience · doi:10.1016/j.isci.2024.109330 · Cited by 9
“44 We aimed to address if RBD binding and competition for ACE2 binding to RBD correlate with titers of antibodies that target E484 or F456 by depleting sera with mutant RBDs. Interestingly, although antibodies remaining after E484K depletion separated the two patient groups with low and high…”
BackgroundIn-Silico Analysis of Monoclonal Antibodies against SARS-CoV-2 Omicron
Hu, Y., Hu, J., Chu, H., Yau, T. C. C., Zhang, B., & Huang, J. (2022) · Viruses · doi:10.3390/v14020390 · Cited by 9
“In our database, 132 monoclonal antibody epitopes can be classified into five antigenic groups: NTD [4], RBD-1, RBD-2, RBD-3, and RBD-4 [5].”
BackgroundInfluentialFung, K.-M., Lai, S.-J., Lin, T.-L., & Tseng, T. (2022) · Frontiers in Molecular Biosciences · doi:10.3389/fmolb.2022.797132 · Cited by 9
Bruun, T. U. J., Do, J., Weidenbacher, P. A. B., Utz, A., & Kim, P. S. (2024) · ACS Central Science · doi:10.1021/acscentsci.4c00722 · Cited by 9
Cia, G., Pucci, F., & Rooman, M. J. (2022) · International Journal of Molecular Sciences · doi:10.3390/ijms23042078 · Cited by 9
“In this study, we used a structural bioinformatics approach to extend the above described results [14].”
BackgroundMethodResultInfluentialGarcía‐Vega, M., Melgoza-González, E. A., Hernández‐Valenzuela, S., Hinojosa‐Trujillo, D., Reséndiz‐Sandoval, M., Llamas-Covarrubias, M. A., Loza-López, M., Valenzuela, O., Soto‐Gaxiola, A., Hernández‐Oñate, M. Á., et al. (2023) · iScience · doi:10.1016/j.isci.2023.106562 · Cited by 9
“necessary for identifying the best candidates, possible combinations, and mapping mutations that escape RBD-targeting mAbs.(14) In this study, we report the isolation and characterization of mAbs against SARSCoV-2 obtained from convalescent patients infected with the ancestral strain of SARS-CoV-2.”
Chronic shedding of a SARS-CoV-2 Alpha variant in wastewater
Conway, M. J., Yang, H., Revord, L. A., Novay, M. P., Lee, R. J., Ward, A. S., Abel, J. D., Williams, M. R., Uzarski, R. L., & Alm, E. W. (2024) · BMC Genomics · doi:10.1186/s12864-024-09977-7 · Cited by 9
“K444R, V445A, G446D, Y449N, L452Q, N460K, S477N, and E484V (and cryptic mutation E484A) have been associated with resistance to antibody-mediated neutralization, and N460K was previously observed during a persistent infection in an immunocompromised patient [14, 25–33].”
BackgroundTao, K., Tzou, P. L., Pond, S. L. K., Ioannidis, J. P. A., & Shafer, R. W. (2022) · Preprints.org · doi:10.20944/preprints202203.0155.v1 · Cited by 9
Modeling viral evolution: A novel SIRSVIDE framework with application to SARS-CoV-2 dynamics
Jin, K., Tang, X., Qian, Z., Wú, Z., Yang, Z., Qian, T., Hon, C., & Lü, J. (2024) · hLife · doi:10.1016/j.hlife.2024.03.006 · Cited by 9
Petro, C. D., Hooper, A. T., Peace, A., Mohammadi, K. A., Eagan, W., Elbashir, S. M., DiPiazza, A. T., Makrinos, D. L., Pascal, K. E., Bandawane, P., et al. (2024) · Science Translational Medicine · doi:10.1126/scitranslmed.adn0396 · Cited by 8
Design of SARS-CoV-2 RBD immunogens to focus immune responses toward conserved coronavirus epitopes
Harris, C., Kapingidza, A. B., San, J. E., Christopher, J., Gavitt, T. D., Rhodes, B., Janowska, K., O’Donnell, C., Lindenberger, J. J., Huang, X. Y., et al. (2025) · Journal of Virology · doi:10.1128/jvi.00465-25 · Cited by 8
“However, with the emergence of Omicron lineages containing highly mutated RBDs, many of the RBM-targeting class I and II antibodies lost their activity (5, 29, 33).”
Enhanced deep Convolutional Neural Network for SARS-CoV-2 variants classification
Awe, O. I., Obura, H. O., Charles, S., Mudibo, E. O., & Mwanga, M. J. (2025) · Frontiers in Artificial Intelligence · doi:10.3389/frai.2025.1512003 · Cited by 28
Bhiman, J. N., & Moore, P. L. (2022) · Immunological Reviews · doi:10.1111/imr.13086 · Cited by 7
Erabi, G., Faridzadeh, A., Parvin, A., Deravi, N., Rahmanian, M., Fathi, M., Aleebrahim-Dehkordi, E., & Rezaei, N. (2024) · Health Science Reports · doi:10.1002/hsr2.1873 · Cited by 5
Real-time identification of epistatic interactions in SARS-CoV-2 from large genome collections
Innocenti, G., Obara, M., Costa, B., Jacobsen, H., Katzmarzyk, M., Čičin‐Šain, L., Kalinke, U., & Galardini, M. (2024) · Genome biology · doi:10.1186/s13059-024-03355-y · Cited by 11
“The unprecedented efforts in the genomic epidemiology of the virus leading to millions of whole sequences being deposited in public and restricted-access databases have accelerated the pace by which emerging lineages are tracked and the impact of genetic mutations is estimated [1, 10–12].”
BackgroundStauft, C. B., Tegenge, M. A., Khurana, S., Lee, Y., Selvaraj, P., Golding, H., Wang, T. T., & Golding, B. (2021) · Clinical Infectious Diseases · doi:10.1093/cid/ciab854 · Cited by 8
Prediction of antibody binding to SARS-CoV-2 RBDs
Wang, E. J. D. (2022) · Bioinformatics Advances · doi:10.1093/bioadv/vbac103 · Cited by 9
Predicting virus Fitness: Towards a structure-based computational model
Thakur, S., Kepp, K. P., & Mehra, R. (2023) · Journal of Structural Biology · doi:10.1016/j.jsb.2023.108042 · Cited by 8
Rochman, N. D., Faure, G., Wolf, Y. I., Freddolino, P. L., Zhang, F., & Koonin, E. V. (2021) · bioRxiv (Cold Spring Harbor Laboratory) · doi:10.1101/2021.08.30.458225 · Cited by 8
Tzou, P. L., Tao, K., Pond, S. L. K., & Shafer, R. W. (2021) · bioRxiv (Cold Spring Harbor Laboratory) · doi:10.1101/2021.11.24.469823 · Cited by 8
Mosaic RBD nanoparticles protect against multiple sarbecovirus challenges in animal modelsPreprint
Cohen, A. A., van Doremalen, N., Greaney, A. J., Andersen, H., Sharma, A., Starr, T. N., Keeffe, J., Fan, C.-H., Schulz, J. E., Gnanapragasam, P. N. P., et al. (2022) · bioRxiv · doi:10.1101/2022.03.25.485875 · Cited by 5
“is immunodominant among humans infected with SARS-2 (44, 59) and the subdominant class 4 sites 383–386 are labeled.”
Self-citationRuiz, F., Foreman, W. B., Lilly, M., Baharani, V. A., Depierreux, D. M., Chohan, V., Taylor, A. L., Guenthoer, J., Ralph, D., Matsen IV, F. A., et al. (2024) · PLOS Pathogens · doi:10.1371/journal.ppat.1012650 · Cited by 7
Self-citationConstrained evolutionary funnels shape viral immune escape
Huot, M., Wang, D., Shakhnovich, E. I., Monasson, R., & Cocco, S. (2026) · Proceedings of the National Academy of Sciences · doi:10.1073/pnas.2536956123 · Cited by 9
Omicron variant losing its critical mutations in the receptor‐binding domain
Desingu, P. A., & Nagarajan, K. (2022) · Journal of Medical Virology · doi:10.1002/jmv.27667 · Cited by 6
Sohrab, S. S., El-Kafrawy, S. A., & Azhar, E. I. (2022) · Journal of King Saud University - Science · doi:10.1016/j.jksus.2022.102049 · Cited by 7
Predicting the immune escape of SARS-CoV-2 neutralizing antibodies upon mutation
Sharma, D., Rawat, P., Greiff, V., Vani, J., & Gromiha, M. M. (2023) · Biochimica et Biophysica Acta (BBA) - Molecular Basis of Disease · doi:10.1016/j.bbadis.2023.166959 · Cited by 7
Tambe, L. A. M., Mathobo, P., Matume, N. D., Munzhedzi, M., Edokpayi, J. N., Viraragavan, A., Glanzmann, B., Tebit, D. M., Mavhandu-Ramarumo, L. G., Street, R. A., et al. (2023) · Frontiers in Public Health · doi:10.3389/fpubh.2023.1309869 · Cited by 7
Sohrab, S. S., El-Kafrawy, S. A., & Azhar, E. I. (2022) · Journal of King Saud University - Science · doi:10.1016/j.jksus.2022.101965 · Cited by 7
Dean, A. Q., Stauft, C. B., Twomey, J. D., Tan, J., Varani, L., Wang, T. T., & Zhang, B. (2022) · Antibody Therapeutics · doi:10.1093/abt/tbac032 · Cited by 6
Rodriguez‐Aponte, S. A., Dalvie, N. C., Wong, T. Y., Johnston, R. S., Naranjo, C. A., Bajoria, S., Kumru, O. S., Kaur, K., Russ, B. P., Lee, K. S., et al. (2022) · Vaccine · doi:10.1016/j.vaccine.2022.12.062 · Cited by 6
“To assess the antigenicity of RBD-J6, and identify potential changes compared to RBD-J, we evaluated its binding to ACE2 and to several neutralizing antibodies targeting different epitopes of RBD[32,33].”
BackgroundNoseda, D. G., D’Alessio, C., Santos, J., Idrovo-Hidalgo, T., Pignataro, M. F., Wetzler, D. E., Gentili, H., Nadra, A. D., Román, E. A., Paván, C., et al. (2023) · Fermentation · doi:10.3390/fermentation9060497 · Cited by 7
Cianfarini, C. L., Hassler, L., Wysocki, J. A., Hassan, A., Nicolaescu, V. I., Elli, D., Gula, H., Ibrahim, A. M., Randall, G. C., Henkin, J., et al. (2024) · Cells · doi:10.3390/cells13030203 · Cited by 7
“The possibility of mutational escape has also been described for polyclonal antibodies, although, unlike monoclonal antibodies, a variety of different epitopes are being targeted [77,78].”
BackgroundDesign of immunogens for eliciting antibody responses that may protect against SARS-CoV-2 variants
Wang, E. J. D., & Chakraborty, A. K. (2022) · PLoS Computational Biology · doi:10.1371/journal.pcbi.1010563 · Cited by 7
“These 224 mutations were found from various deep mutational scanning experiments over 20 225 class 1/2 antibodies (43-47) (Table S2), in which a mutation’s ability to abrogate 226 binding was quantified as an escape fraction.”
BackgroundEfficacy of the combination of monoclonal antibodies against the SARS-CoV-2 Beta and Delta variants
Boonkrai, C., Cotrone, T. S., Chaisuriyong, W., Tantawichien, T., Thisyakorn, U., Fernandez, S., Hunsawong, T., Reed, M., Wongtangprasert, T., Audomsun, T., et al. (2023) · PLoS ONE · doi:10.1371/journal.pone.0284173 · Cited by 7
“1D1 Fab and 3D2 Fab bind to class I&II and class III RBD binding epitopes, respectively [43].”
BackgroundFrei, L., Gao, B., Han, J., Taft, J. M., Irvine, E. B., Weber, C. R., Kumar, R. K., Eisinger, B. N., & Reddy, S. T. (2023) · bioRxiv (Cold Spring Harbor Laboratory) · doi:10.1101/2023.10.09.561492 · Cited by 7
Zhu, F., Rajan, S., Hayes, C. F., Kwong, K. Y., Gonçalves, A. R., Zemla, A. T., Lau, E. Y., Zhang, Y., Caì, Y., Goforth, J. W., et al. (2025) · Science Advances · doi:10.1126/sciadv.adu0718 · Cited by 6
“1), consistent with class 1 epitope for SARS- CoV-2 RBD ( 13 , 14 ).”
Norwood, K., Deng, Z.-L., Reimering, S., Robertson, G., Foroughmand-Araabi, M.-H., Goliaei, S., Hölzer, M., Klawonn, F., & McHardy, A. C. (2025) · Nature Communications · doi:10.1038/s41467-025-60231-4 · Cited by 10
“The antigenic scoring matrix includes antigenic alteration estimates for pairs of amino acid changes derived from a previously inferred antigenic tree for Influenza A viruses (IAV) 23 .”
Nguyen, D. V., Xiao, J. H., Peter Simmonds, K., Lamikanra, A., Odon, V., Ratcliff, J. D., Townsend, A., Roberts, D. J., & Harvala, H. (2021) · The Journal of Infectious Diseases · doi:10.1093/infdis/jiab563 · Cited by 6
“This variant has indeed been previously associated with antigenic escape, and these mutations are known to affect antibody binding by several different mechanisms [15].”
Chouikha, A., Lagaré, A., Ghedira, K., Diallo, A. B., Njouom, R., Sankhe, S., Derrar, F., Victoir, K., Dellagi, K., Triki, H., et al. (2022) · Viruses · doi:10.3390/v14051007 · Cited by 8
Multiplexed on-yeast serological assay for immune escape screening of SARS-CoV-2 variants
López-Morales, J., Vanella, R., Utzinger, T., Schittny, V., Hirsiger, J. R., Osthoff, M. F., Berger, C. T., Guri, Y., & Nash, M. A. (2023) · iScience · doi:10.1016/j.isci.2023.106648 · Cited by 6
Kaewchim, K., Glab-Ampai, K., Mahasongkram, K., Saenlom, T., Thepsawat, W., Chulanetra, M., Choowongkomon, K., Sookrung, N., & Chaicumpa, W. (2023) · Viruses · doi:10.3390/v15061252 · Cited by 6
“The enhancing VH105 uses all three CDRs to interact with 12 residues of the RBD1 and 1 residue of the RBD2; 11 of the 12 residues in the RBD1 are known to bind tightly to human ACE2 [37].”
BackgroundInfluentialClinical grade ACE2 effectively inhibits SARS-CoV-2 Omicron infectionsPreprint
Monteil, V., Devignot, S., Klingström, J., Thålin, C., Kellner, M. J., Christ, W., Havervall, S., Mereiter, S., Knapp, S., Montserrat, N., et al. (2021) · bioRxiv (Cold Spring Harbor Laboratory) · doi:10.1101/2021.12.25.474113 · Cited by 6
“These 66 mutations do not only affect the infectivity and transmissibility of SARS-CoV-2, but also 67 reduce the potency of vaccines, convalescent sera, and monoclonal antibody 68 therapeutics [14-20].”
BackgroundOng, Y. C., Tejo, B. A., & Yap, W. B. (2024) · Biomedicines · doi:10.3390/biomedicines12112530 · Cited by 6
Cohen, A. A., Keeffe, J. R., Rorick, A. V., Rho, S., Fils, A.-C. I. P., Manasyan, L., Gao, H., Gnanapragasam, P. N. P., Funke, H. H., Randolph, T. W., et al. (2025) · iScience · doi:10.1016/j.isci.2025.113649 · Cited by 5
Rahman, M. A., Becerra‐Flores, M., Patskovsky, Y., de Castro, I. S., Bissa, M., Basu, S., Shen, X., Williams, L. D., Sarkis, S., N’Guessan, K. F., et al. (2023) · Frontiers in Immunology · doi:10.3389/fimmu.2023.1139402 · Cited by 5
High-throughput specificity profiling of antibody libraries using ribosome display and microfluidics
Wagner, E. K., Carter, K. P., Lim, Y. W., Chau, G. J., Enstrom, A., Wayham, N. P., Hanners, J.-M., Yeh, C.-L. C., Fouet, M., Leong, J., et al. (2024) · Cell Reports Methods · doi:10.1016/j.crmeth.2024.100934 · Cited by 6
“30 We used PolyMap data to select several combinations of clones with complementary binding patterns and showed that these combinations were able to bind all profiled antigens and even showed some binding to the emerging and divergent JN.1 variant.”
An integrated multiscale computational framework deciphers SARS-CoV-2 resistance to sotrovimab
Sharma, A., Maurya, S., Kumar, S., Tripathi, T., Kar, R. K., & Padhi, A. K. (2025) · Biophysical Journal · doi:10.1016/j.bpj.2025.05.015 · Cited by 6
Verkhivker, G. M. (2022) · International Journal of Molecular Sciences · doi:10.3390/ijms23031646 · Cited by 5
“Deep mutagenesis scanning of 77 antibody-escaping mutations showed that the escape mutations cluster in several RBD regions 78 and can be constrained with respect to their effects on expression of properly folded RBD and 79 ACE2 binding [37-42].”
BackgroundGong, H., Hu, Y., Li, X., Yau, T. C. C., Zhang, B., & Huang, J.-D. (2022) · ACS Infectious Diseases · doi:10.1021/acsinfecdis.2c00488 · Cited by 6
Sun, Y., Zhang, Y.-R., Yu, H., Fleur, A. S., Yu, D., Yang, Z.-Y., & Feng, H.-P. (2023) · Microbial Cell Factories · doi:10.1186/s12934-023-02200-4 · Cited by 3
Ketaren, N. E., Mast, F. D., Fridy, P. C., Olivier, J. P., Sanyal, T., Sali, A., Chait, B. T., Rout, M. P., & Aitchison, J. D. (2024) · eLife · doi:10.7554/elife.89423.3 · Cited by 5
“…with the epitopes of five mAbs effective against delta, categorized into two of three classes on RBD: class 1 (etesivimab, casirivimab and amubarvimab) ( Greaney, Starr et al. 2021 , Li, Xue et al. 2021 , Planas, Veyer et al. 2021 , Takashita, Yamayoshi et al. 2022 , Cox, Peacock et al. 2023…”
Importation of SARS-CoV-2 Omicron variant in Beijing, China
Li, F., Liang, Z., Cui, S., Lv, B., Feng, Z., Xu, H., Jia, L., Yang, P., Wang, Q., Pan, Y., et al. (2022) · Biosafety and Health · doi:10.1016/j.bsheal.2022.04.003 · Cited by 5
Emergence of a novel SARS-CoV-2 Pango lineage B.1.1.526 in West Bengal, India
Sarkar, R., Saha, R., Mallick, P., Sharma, R. P., Kaur, A., Dutta, S., & Chawla‐Sarkar, M. (2021) · Journal of Infection and Public Health · doi:10.1016/j.jiph.2021.11.020 · Cited by 6
Sokal, A., Spaeth, G. B., Fernández, I., Broketa, M., Azzaoui, I., Selle, A. D. L., Vandenberghe, A., Fourati, S., Roeser, A., Meola, A., et al. (2021) · bioRxiv (Cold Spring Harbor Laboratory) · doi:10.1101/2021.06.17.448459 · Cited by 5
Insights into the limited global spread of the immune evasive SARS-CoV-2 variant MuPreprint
Petrone, M. E., Lucas, C. G. D. O., Menasché, B. L., Breban, M. I., Yildirim, I. B., Campbell, M., Omer, S. B., Ko, A. I., Grubaugh, N. D., Iwasaki, A., et al. (2022) · medRxiv · doi:10.1101/2022.03.28.22273077 · Cited by 5
A multispecific antibody prevents immune escape and confers pan-SARS-CoV-2 neutralizationPreprint
Misasi, J., Wei, R. R., Wang, L., Pegu, A., Wei, C., Oloniniyi, O. K., Zhou, T., Moliva, J. I., Zhao, B., Choe, M., et al. (2022) · bioRxiv (Cold Spring Harbor Laboratory) · doi:10.1101/2022.07.29.502029 · Cited by 5
Caillard, S., Laugel, E., Benotmane, I., & Fafi‐Kremer, S. (2023) · Journal of Infection · doi:10.1016/j.jinf.2023.02.001 · Cited by 5
“Interestingly, six (E340, R346, K356, K444, Y449, and L452) of the eleven mutations identified during the course of follow-up are known to affect the RBD region (4) and can act as escape mutations to neutralizing antibodies (5,6).”
BackgroundCoelho, C. H., Bloom, N. I., Ramirez, S. I., Parikh, U. M., Heaps, A., Sieg, S. F., Greninger, A. L., Ritz, J., Moser, C., Eron, J. J., et al. (2023) · bioRxiv (Cold Spring Harbor Laboratory) · doi:10.1101/2023.11.21.567575 · Cited by 5
Mouse-adapted SARS-CoV-2 Omicron BA.5 infection induces post-acute lung fibrosis in BALB/c mice
Powers, J. M., Leist, S. R., Suryadevara, N., Zost, S. J., Binshtein, E., Abdelgadir, A., Mallory, M. L., Edwards, C. E., Gully, K. L., Hubbard, M. L., et al. (2025) · Journal of Virology · doi:10.1128/jvi.01406-25 · Cited by 5
“4B) (31).”
Singh, V. A., Nehul, S., Saha, A., Singh, V., Bhutkar, M., Kumar, C. S., Banerjee, M., Kuhn, R. J., Kumar, P., Sharma, G. C., et al. (2026) · Biochemical and Biophysical Research Communications · doi:10.1016/j.bbrc.2026.153346 · Cited by 5
McIlroy, P. R., Pham, L. T. M., Sheffield, T. Y., Stefan, M. A., Thatcher, C. E., Jaryenneh, J. D., Schwedler, J. L., Sinha, A., Sumner, C. A., Jones, I. K. A., et al. (2025) · PLoS Pathogens · doi:10.1371/journal.ppat.1012903 · Cited by 5
Felbinger, N. R., Trudil, D., Loomis, L. D., Ascione, R., Siragusa, G. R., Haba, S., Rastogi, S., Mucci, A., Claycomb, M., Snowberger, S., et al. (2023) · Frontiers in Virology · doi:10.3389/fviro.2023.988109 · Cited by 4
“Although these mutations are not believed to directly affect the ACE2 binding activity of the virus, they are located in a peptide stretch that has been identified as an epitope for neutralizing antibodies and are thought to help inhibit neutralizing activity (29, 30).”
BackgroundResultPham, V. H., Pham, H. T., Balzanelli, M. G., Distratis, P., Lazzaro, R., Nguyễn, Q. V., Tran, V. Q., Tran, D. K., Phan, L. D., Pham, S. M., et al. (2023) · Diagnostics · doi:10.3390/diagnostics13081364 · Cited by 4
Pillay, A., Yeola, A., Tea, F., Denkova, M., Houston, S., Burrell, R., Merheb, V., Lee, F. X. Z., Lopez, J. A., Moran, L., et al. (2023) · Journal of Clinical Immunology · doi:10.1007/s10875-023-01540-5 · Cited by 7
“However, 484K on its own, as in Eta, despite having been reported as a class 2 escape mutation for neutralization of monoclonal antibodies [67], did not induce strong decrease of antibody binding.”
BackgroundLee, J., Naoe, Y., Bang, U., Nakagama, Y., Saito, A., Kido, Y., & Hotta, A. (2024) · Virology · doi:10.1016/j.virol.2024.110067 · Cited by 5
Zhang, T., Yang, D., Tang, L., & Hu, Y. (2024) · Molecular Medicine Reports · doi:10.3892/mmr.2024.13272 · Cited by 5
Misasi, J., Wei, R. R., Wang, L., Pegu, A., Wei, C., Oloniniyi, O. K., Zhou, T., Moliva, J. I., Zhao, B., Choe, M., et al. (2024) · Science Translational Medicine · doi:10.1126/scitranslmed.ado9026 · Cited by 9
“We took advantage of potent broadly neutralizing antibodies we had previously discovered ( 18 ), which targeted three distinct sites in the RBD and were classified as class I, class II, and class III under the Barnes classification schema ( 13 ).”
BackgroundQiao, R., Liu, Y., Mao, Q., Li, J., Lu, Y., Shi, J., Li, C., Yu, J., Gong, J., Wang, X., et al. (2025) · MedComm · doi:10.1002/mco2.70191 · Cited by 4
Nunez, F. A., de Oliveira, V. L., Remuzgo, C., Silva, M. R., Daher, I. P., Oliveira, J. R., Silva, T. L., Cunha‐Neto, E., Kalil, J. E., Santos, K. S., et al. (2025) · Journal of Materials Chemistry B · doi:10.1039/d5tb00630a · Cited by 4
Metadata
- Authors
- Greaney, A. J., Starr, T. N., Barnes, C. O., Weisblum, Y., Schmidt, F., Caskey, M., Gaebler, C., Cho, A., Agudelo, M., Finkin, S., Wang, Z., Poston, D., Muecksch, F., Hatziioannou, T., Bieniasz, P. D., Robbiani, D. F., Nussenzweig, M. C., Bjorkman, P. J., & Bloom, J. D.
- Affiliations
- University of Washington (US)
- Howard Hughes Medical Institute (US)
- California Institute of Technology (US)
- Rockefeller University (US)
- Institute for Research in Biomedicine (CH)
- Corresponding author
- Bloom, Jesse D.
- ORCID
- Greaney, Allison J.
- Starr, Tyler N.
- Barnes, Christopher O.
- Weisblum, Yiska
- Schmidt, Fabian
- Caskey, Marina
- Gaebler, Christian
- Cho, Alice
- Agudelo, Marianna
- Finkin, Shlomo
- Wang, Zijun
- Poston, Daniel
- Muecksch, Frauke
- Hatziioannou, Theodora
- Bieniasz, Paul D.
- Robbiani, Davide F.
- Nussenzweig, Michel C.
- Bjorkman, Pamela J.
- Bloom, Jesse D.
- Venue
- Nature Communications
- Published
- 2021-07-07
- Volume
- 12
- Issue
- 1
- Pages
- 4196-4196
- ISSN
- 2041-1723 (ISSN-L)
- PMC
- PMC7987015
- OpenAlex
- W3179259355
- Cited by
- 433
- References
- 64
- Citations by year
- 2026: 34 · 2025: 39 · 2024: 56 · 2023: 83 · 2022: 157 · 2021: 64
- FWCI
- 29.43
- Type
- journal article
- Language
- en
- Open access
- gold
- doi.org
- Locations
- Nature Communications (publishedVersion, cc-by)
- bioRxiv (Cold Spring Harbor Laboratory) (acceptedVersion, cc-by)
- PubMed Central (publishedVersion, cc-by)
- PubMed (publishedVersion)
- PubMed Central (submittedVersion, cc-by)
- CaltechAUTHORS (California Institute of Technology) (submittedVersion, cc-by)
- RePEc: Research Papers in Economics (submittedVersion)
- DOAJ (DOAJ: Directory of Open Access Journals) (submittedVersion, cc-by-sa)
- Funders
- Howard Hughes Medical Institute
- Burroughs Wellcome Fund
- Bill and Melinda Gates Foundation (INV-004949)
- Damon Runyon Cancer Research Foundation (DRG-2381-19)
- Washington Research Foundation
- Fred Hutchinson Cancer Research Center
- George Mason University
- California Institute of Technology
- University of Washington
- National Institutes of Health (1s10od028685-01, P01-AI138398-S1, AI111825)
- Beckman Institute, California Institute of Technology
- National Institute of Allergy and Infectious Diseases (U01AI151698, P01 AI138398-S1, R01AI127893, T32AI083203, U19AI111825, R01AI141707, AI151698, F30AI157898)
- Office of Research Infrastructure Programs, National Institutes of Health (S10OD028685)
- Topics
- Health Sciences › Medicine › Infectious Diseases › SARS-CoV-2 and COVID-19 Research
- Life Sciences › Biochemistry, Genetics and Molecular Biology › Molecular Biology › vaccines and immunoinformatics approaches
- Life Sciences › Immunology and Microbiology › Immunology › Monoclonal and Polyclonal Antibodies Research
- Keywords
- SARS-CoV-2, spike protein receptor-binding domain, antibody escape mutations, neutralizing antibodies, monoclonal antibodies, convalescent plasma, antibody-antigen binding, epitope evolution
About these checks
Registry, retraction, Cites and statistics results are computed, not judged, with one exception: a printed reference that no index lists is read once by a model before it counts as a citation error. Claims are extracted by a model and kept only when their quote appears verbatim in the text; each cited source is then checked, with a model’s help, for whether it says what the claim relies on. Those verdicts can be wrong — read the claim’s quote and the cited source before relying on one.
Statistics and arithmetic are recomputed, not judged.
Confidence bands are shown only for fields calibrated on our annotated test set. None is calibrated yet, so no band is shown.
What counts as a claim ›How we measure confidence ›How we check this ›
Are you an author, or do you see a problem with this page? Request a review
