

The DOI matches its Crossref record; 115 of the 117 references it cites were found in a registry or an index; 22 of the 29 sources its claims cite were checked for support.
Combinatorial optimization of mRNA structure, stability, and translation for RNA-based therapeutics
Open accessPublished version of a preprint
Abstract
Therapeutic mRNAs and vaccines are being developed for a broad range of human diseases, including COVID-19. However, their optimization is hindered by mRNA instability and inefficient protein expression. Here, we describe design principles that overcome these barriers. We develop a new RNA sequencing-based platform called PERSIST-seq to systematically delineate in-cell mRNA stability, ribosome load, as well as in-solution stability of a library of diverse mRNAs. We find that, surprisingly, in-cell stability is a greater driver of protein output than high ribosome load. We further introduce a method called In-line-seq, applied to thousands of diverse RNAs, that reveals sequence and structure-based rules for mitigating hydrolytic degradation. Our findings show that "superfolder" mRNAs can be designed to improve both stability and expression that are further enhanced through pseudouridine nucleoside modification. Together, our study demonstrates simultaneous improvement of mRNA stability and protein expression and provides a computational-experimental platform for the enhancement of mRNA medicines.
Overview
AI snapshot
Written from the paper’s full text.
TL;DR
The paper develops PERSIST-seq and In-line-seq to systematically optimize therapeutic mRNA stability, structure, and translation. It finds that in-cell mRNA stability is a greater driver of total protein output than high ribosome load, and that structure-optimized CDSs plus pseudouridine modification can improve both in-solution stability and protein expression.
Key findings
- In a 233-mRNA library, PERSIST-seq showed in-cell half-lives ranging from <5 h to >15 h; a model integrating ribosome load and in-cell stability predicted measured luciferase activity with r = 0.71, supporting in-cell stability as the dominant predictor of total protein output.
- In-solution stability was driven mainly by mRNA length and structure: the shortest MEV-encoding mRNAs had half-lives of 3.4 ± 0.6 h, while the longest eGFP-encoding mRNAs had half-lives of 1.1 ± 0.08 h; the ratio 3.0 ± 0.7 matched the inverse length ratio 958 nt/250 nt = 3.8.
- In-line-seq on 3,030 RNA fragments (2,165 after filtering) yielded DegScore, which predicted Nluc CDS in-solution half-lives with Pearson R = −0.63, p < 0.0001, outperforming dGMFE (R = −0.53) and summed unpaired probability (R = −0.60).
- Pseudouridine (ψ) or m1ψ substitution suppressed in-line hydrolysis and gave 1.2–2.7-fold stabilization for longer Nluc mRNAs; a RiboTree/LinearDesign/DegScore-optimized mRNA had t1/2 = 2.4 relative to Nluc start and 1.7-fold higher protein expression, and after 2 h accelerated degradation most ψ-modified optimized mRNA remained functional while the starting mRNA gave negligible activity.
Methods
- PERSIST-seq: pooled full-length IVT mRNA library of 233 constructs with varied 5′ UTRs, 3′ UTRs, and CDSs, barcoded and transfected into HEK293T cells; polysome sucrose-gradient fractionation and time-course sampling measured ribosome load, in-cell stability, and in-solution stability by barcode sequencing.
- In-line-seq: Eterna “Roll-your-own-structure” challenge generated 68-nt RNAs; 3,030 fragments were profiled by single-nucleotide-resolution in-line hydrolysis and SHAPE, then DegScore was trained as a windowed ridge regression model and validated against independent PERSIST-seq in-solution half-lives.
- Follow-up one-by-one assays used luciferase activity after transfection, capillary electrophoresis for in-solution half-lives, SHAPE/DMS chemical mapping, and ψ or m1ψ substitutions; design algorithms included LinearDesign, GC-rich codon sampling, RiboTree, and Eterna participant designs.
Limitations
- Stated: experiments were limited to HEK293T cells, so optimal UTRs are likely cell-type dependent; the study focused on naked, non-formulated mRNAs, and formulated mRNA libraries may reveal additional effects; DegScore was trained on unmodified nucleotides and does not account for ψ stabilization; blinding and randomization were not used.
- Evident from the text: the main pooled library contained 233 constructs, with some design rules derived from Eterna-designed subsets and accelerated degradation conditions (pH 10 with Mg2+), and the protein-output model assumes first-order translation and decay kinetics with negligible Nluc protein degradation.
Model-written summary. Check it against the paper before relying on it.
Integrity signals
Registry
Cites
Statistics
Figures
Verification
Claims the paper makes
93 Own result · 38 Own interpretation · 15 Own method · 8 No basis given · 5 Couldn’t confirm · 3 Partly supported · 2 Supported so far · 1 Supported · 1 Not supported · 1 No full text of the sources · accuracy not yet measured
At least one cited source doesn’t support this claim or points to a different paper, and none confirmed it — see the verdicts below.
In the paper
“Thus, independent of the nucleotide identity 5’ of the U, this bond is a hotspot for in-line nucleophilic attack63,65.”
§ Combinatorial optimization of mRNA structure, stability, and translation for RNA-based therapeutics > RESULTS > Eterna-guided In-line-seq yields additional design principles and DegScore predictor
What the sources say
- Disputedcites [63] Kaukinen, U., Lyytikäinen, S., Mikkola, S. & Lönnberg, H. The reactivity of phosphodiester bonds within linear single-stranded oligoribonucleotides is strongly dependent on the base sequence. Nucleic Acids Res. 30, 468–474 (2002). sourceExperimental — accuracy not yet measured
The Results (page unavailable) report that cleavage of the studied 5′-UpA-3′ bond varies strongly with the surrounding sequence; in one sequence, no reaction was detected in three months. The Discussion (page unavailable) explicitly rejects the idea that this bond is inherently prone to cleavage. The paper studies a bond following U, rather than establishing that a bond leading to 3′ U is a hotspot independent of the preceding nucleotide. (LLM, conf=0.82)
Checked by a reasoning model — may be wrong.
- Could not verifycites [65] Seetin, M. G., Kladwang, W., Bida, J. P. & Das, R. Massively parallel RNA chemical mapping with a reduced bias MAP-seq protocol. Methods Mol. Biol. 1086, 95–117 (2014). sourceExperimental — accuracy not yet measured
The Introduction (page unavailable) discusses chemical probing and nucleotide reactivity, and the References list a work on in-line probing. Neither passage addresses whether the bond leading to a 3′ U is a hotspot for in-line nucleophilic attack regardless of the 5′ nucleotide; searches for that mechanism and sequence preference found no supporting passage in our copy. (LLM, conf=0.73)
plaindirect- Asserted: passes — The authors put it forward as true.
- Checkable: passes — It can be checked against evidence.
- Load-bearing: passes — The paper’s conclusions depend on it.
- Based: passes — The paper gives a reason why it holds.
- Disputed
The sources with a verdict support this claim; the rest weren’t checked yet, have no full text we could read, or their verdicts aren’t rated yet.
In the paper
“Most surprising, in contrast to previous reports47–49, we found 5’ UTRs that are highly structured, such as the dengue virus (DEN2), can support efficient translation.”
§ Combinatorial optimization of mRNA structure, stability, and translation for RNA-based therapeutics > RESULTS > High dynamic range of translation driven by UTRs
What the sources say
- Supportedcites [47] Zhang, H. et al. LinearDesign: efficient algorithms for optimized mRNA sequence design. Preprint at https://arxiv.org/abs/2004.10177 (2020). source
The citation is attached to “previous reports,” not to the citing authors’ finding about DEN2. In §1.10 (page unavailable), the source says studies have shown reduced protein expression when the 5′-end leader region has more secondary structure; its Results likewise note a potential negative effect on translation efficiency. It does not report the DEN2 finding, but that finding is presented as the citing authors’ own. (LLM, conf=0.91)
- Not checked — no full text of the sourcecites [48] Ding, Y. et al. In vivo genome-wide profiling of RNA secondary structure reveals novel regulatory features. Nature 505, 696–700 (2014). source
- Supportedcites [49] Shah, P., Ding, Y., Niemczyk, M., Kudla, G. & Plotkin, J. B. Rate-limiting steps in yeast protein translation. Cell 153, 1589–1601 (2013). source
The citation is attached to “previous reports,” not to the citing authors’ finding about dengue virus. In Results > Initiation Probabilities of Endogenous Genes (page unavailable), Shah et al. report that strong 5′ mRNA structure reduces translation initiation in yeast. The paper does not report the DEN2 finding, but it supports the prior view the citing sentence contrasts with it. (LLM, conf=0.88)
plaindirect- Asserted: passes — The authors put it forward as true.
- Checkable: passes — It can be checked against evidence.
- Load-bearing: passes — The paper’s conclusions depend on it.
- Based: passes — The paper gives a reason why it holds.
- Supported
Every source the paper cites for this claim was checked and supports it.
In the paper
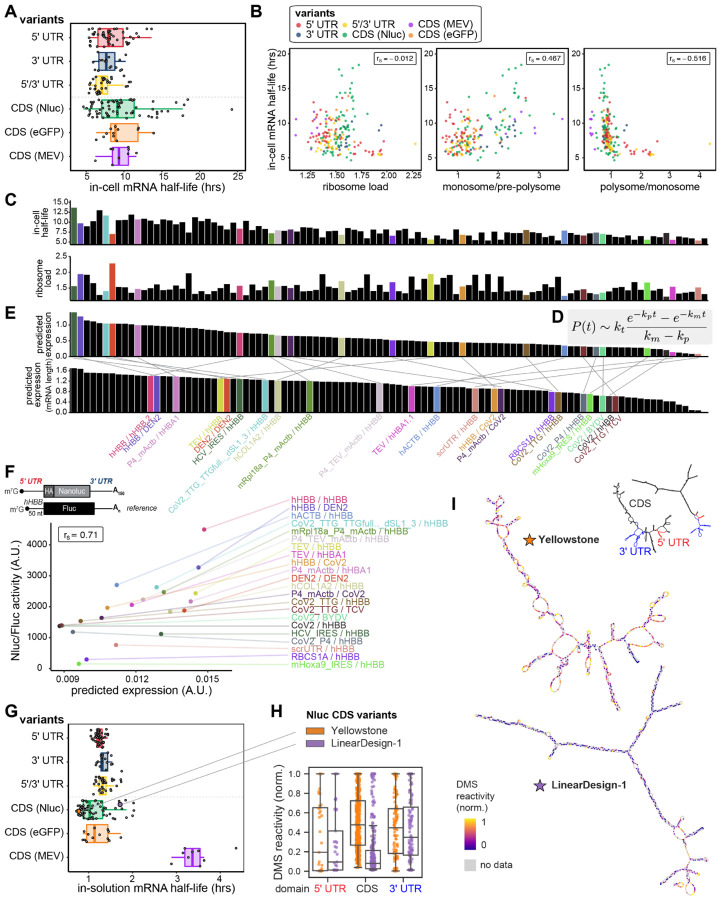
“The strongest prediction of previous theoretical modeling7 was that length changes should drive the most variation in in-solution stability, and PERSIST-seq data across different different CDS types confirmed the effect of CDS length on RNA stability, (Fig. 2G).”
§ Combinatorial optimization of mRNA structure, stability, and translation for RNA-based therapeutics > RESULTS > mRNA length and structure drive in-solution mRNA stability
What the sources say
- Supportedcites [7] Wayment-Steele, H. K. et al. Theoretical basis for stabilizing messenger RNA through secondary structure design. Nucleic Acids Res. 49, 10604–10617 (2021). source
Citation 7 is attached to the previous theoretical modeling, not to the citing authors’ PERSIST-seq result in Fig. 2G. In Results, “A biophysical model for RNA degradation” (page unavailable), the source predicts that longer RNAs degrade faster in proportion to their length. The PERSIST-seq confirmation is not a finding attributed to this source by the citation placement. (LLM, conf=0.90)
plaindirect- Asserted: passes — The authors put it forward as true.
- Checkable: passes — It can be checked against evidence.
- Load-bearing: passes — The paper’s conclusions depend on it.
- Based: passes — The paper gives a reason why it holds.
- The authors state this as an assumption: The high pH buffer containing Mg2+ mimics the high effective pH and positively charged environment that can arise in lipid nanoparticles, protamine, and other formulations for mRNA therapeutics.
- Supported
The cited sources that could be checked couldn’t confirm or dispute this claim.
In the paper
“Chemical structure mapping showed that the long-lived LinearDesign-1 was significantly more highly structured than Yellowstone, as assessed by dimethyl sulfate (DMS) and selective 2’-hydroxyl acylation with primer extension (SHAPE) reactivities59,60 (Fig. 2H, Fig. S3) and structure models guided by these data (Fig. 2I).”
§ Combinatorial optimization of mRNA structure, stability, and translation for RNA-based therapeutics > RESULTS > mRNA length and structure drive in-solution mRNA stability
What the sources say
- Could not verifycites [59] Leonhardt, C. et al. Single-cell mRNA transfection studies: delivery, kinetics and statistics by numbers. Nanomedicine 10, 679–688 (2014). sourceExperimental — accuracy not yet measured
The Single-cell mRNA expression kinetics and Discussion passages describe eGFP expression after mRNA and pDNA transfection, not a comparison of LinearDesign-1 with Yellowstone. Searches for those names and for DMS and SHAPE structure mapping found no passage addressing the claimed result. (LLM, conf=0.76)
- Could not verifycites [60] Wang, H. et al. Diversity of putative archaeal RNA viruses in metagenomic datasets of a yellowstone acidic hot spring. Springerplus 4, 189 (2015). sourceExperimental — accuracy not yet measured
The Methods describe metagenomic sequence assembly, and the Results compare archaeal RNA-virus sequences from a Yellowstone hot spring; no page numbers are available in our copy. Searches for LinearDesign-1, DMS, SHAPE, and chemical structure mapping found no passage addressing the claimed structural comparison. (LLM, conf=0.77)
plaincorrelational- Asserted: passes — The authors put it forward as true.
- Checkable: passes — It can be checked against evidence.
- Load-bearing: passes — The paper’s conclusions depend on it.
- Based: passes — The paper gives a reason why it holds.
- The authors state this as an assumption: The high pH buffer containing Mg2+ mimics the high effective pH and positively charged environment that can arise in lipid nanoparticles, protamine, and other formulations for mRNA therapeutics.
- Could not verify
The cited sources that could be checked couldn’t confirm or dispute this claim.
In the paper
“kp is set to 0 since Nluc protein has negligible degradation as measured by luciferase activity in transiently Nluc-expressing HEK293 cells for at least 6 hours after cycloheximide treatment, which allows assessment of protein degradation in the absence of further translation91.”
§ Combinatorial optimization of mRNA structure, stability, and translation for RNA-based therapeutics > METHODS > Amplicon sequencing data analysis
What the sources say
- Could not verifycites [91] Martin, M. Cutadapt removes adapter sequences from high-throughput sequencing reads. EMBnet J. 17, 10 (2011). sourceExperimental — accuracy not yet measured
The Introduction and Algorithm sections describe adapter trimming in sequencing reads, not protein degradation experiments. Searches for Nluc, HEK293, luciferase activity, and cycloheximide found no passage addressing the claimed six-hour stability. (LLM, conf=0.78)
plain- Asserted: passes — The authors put it forward as true.
- Checkable: passes — It can be checked against evidence.
- Load-bearing: passes — The paper’s conclusions depend on it.
- Based: passes — The paper gives a reason why it holds.
- Could not verify
The cited sources that could be checked couldn’t confirm or dispute this claim.
In the paper
“This effect may derive from overcrowding of ribosomes on mRNA coding regions due to rapid initiation, which can induce sterical ribosome collisions that have recently been found to lead to translation-dependent mRNA decay78,79.”
§ Combinatorial optimization of mRNA structure, stability, and translation for RNA-based therapeutics > DISCUSSION
What the sources say
- Not checked — no full text of the sourcecites [78] Yoffe, A. M. et al. Predicting the sizes of large RNA molecules. Proc. Natl Acad. Sci. USA 105, 16153–16158 (2008). source
- Could not verifycites [79] Polack, F. P. et al. Safety and efficacy of the BNT162b2 mRNA Covid-19 vaccine. N. Engl. J. Med. 383, 2603–2615 (2020). sourceExperimental — accuracy not yet measured
The Methods and Discussion describe BNT162b2 vaccine efficacy and safety, not how translation efficiency affects mRNA stability. Searches for ribosome collisions, rapid initiation, and translation-dependent mRNA decay found no passage addressing the claimed mechanism. (LLM, conf=0.76)
hedgedconditional- Asserted: passes — The authors put it forward as true.
- Checkable: passes — It can be checked against evidence.
- Load-bearing: passes — The paper’s conclusions depend on it.
- Based: passes — The paper gives a reason why it holds.
The sources with a verdict support this claim; the rest weren’t checked yet, have no full text we could read, or their verdicts aren’t rated yet.
In the paper
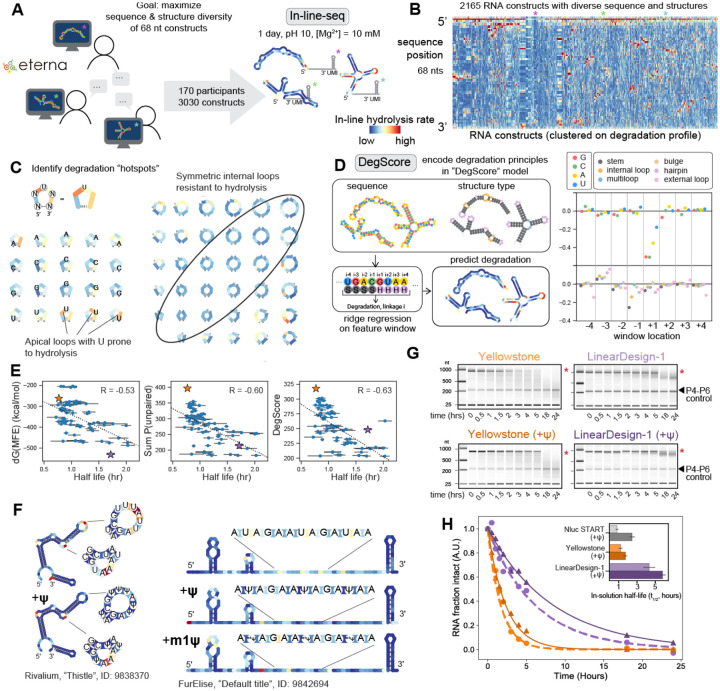
“In particular, we obtained single-nucleotide-resolution measurements of 3030 RNA fragments using In-line-seq, a version of a low-bias ligation and reverse transcription protocol (MAP-seq)64 adapted here for in-line hydrolysis profiles65 (Fig. 3B).”
§ Combinatorial optimization of mRNA structure, stability, and translation for RNA-based therapeutics > RESULTS > Eterna-guided In-line-seq yields additional design principles and DegScore predictor
What the sources say
- Not checked — no full text of the sourcecites [64] Mikkola, S., Kaukinen, U. & Lönnberg, H. The effect of secondary structure on cleavage of the phosphodiester bonds of RNA. Cell Biochem. Biophys. 34, 95–119 (2001). source
- Supportedcites [65] Seetin, M. G., Kladwang, W., Bida, J. P. & Das, R. Massively parallel RNA chemical mapping with a reduced bias MAP-seq protocol. Methods Mol. Biol. 1086, 95–117 (2014). source
The Introduction identifies MAP-seq as a reduced-bias protocol and describes reverse transcription followed by near-quantitative ligation of an Illumina adapter. Citation 64 supports the description of MAP-seq; the 3030-fragment measurement is presented as the citing authors’ own result, and the in-line hydrolysis adaptation is attributed elsewhere. (LLM, conf=0.92)
plain- Asserted: passes — The authors put it forward as true.
- Checkable: passes — It can be checked against evidence.
- Load-bearing: passes — The paper’s conclusions depend on it.
- Based: passes — The paper gives a reason why it holds.
A result the paper reports from its own data — it cites no other source for it, so there is none to check. The quote shows it is in the paper.
In the paper
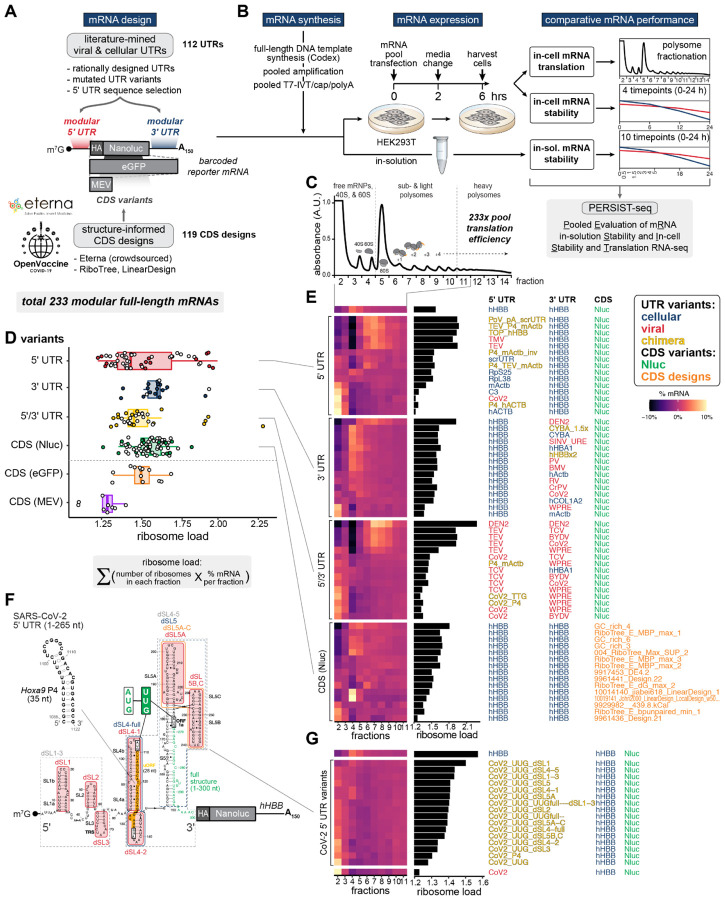
“112 of these mRNAs contained varied 5’ and/or 3’ UTRs (Fig. 1A).”
§ Combinatorial optimization of mRNA structure, stability, and translation for RNA-based therapeutics > RESULTS > A combinatorial library for systematic discovery of mRNA design rules
plain- Asserted: passes — The authors put it forward as true.
- Checkable: passes — It can be checked against evidence.
- Load-bearing: unclear — It is unclear whether the paper’s conclusions depend on it.
- Based: passes — The paper gives a reason why it holds.
A result the paper reports from its own data — it cites no other source for it, so there is none to check. The quote shows it is in the paper.
In the paper
“Moreover, the chimeric fusion of the hHBB 5’ UTR with elements such as the TEV or 5’ TOP sequence in the same 5’ UTR increased polysome loading.”
§ Combinatorial optimization of mRNA structure, stability, and translation for RNA-based therapeutics > RESULTS > High dynamic range of translation driven by UTRs
plaindirect- Asserted: passes — The authors put it forward as true.
- Checkable: passes — It can be checked against evidence.
- Load-bearing: passes — The paper’s conclusions depend on it.
- Based: passes — The paper gives a reason why it holds.
A result the paper reports from its own data — it cites no other source for it, so there is none to check. The quote shows it is in the paper.
In the paper
“Overall, the mRNA designs with highest ribosome load were observed across 5’ UTRs of cellular as well as viral origins (Fig. 1E, Table S1).”
§ Combinatorial optimization of mRNA structure, stability, and translation for RNA-based therapeutics > RESULTS > High dynamic range of translation driven by UTRs
plaincorrelational- Asserted: passes — The authors put it forward as true.
- Checkable: passes — It can be checked against evidence.
- Load-bearing: passes — The paper’s conclusions depend on it.
- Based: passes — The paper gives a reason why it holds.
A result the paper reports from its own data — it cites no other source for it, so there is none to check. The quote shows it is in the paper.
In the paper
“Interestingly, one-by-one tests of the 5’ UTRs selected to have high ribosome load gave lower total protein output than the starting sequence (see Supplemental Text); this observation foreshadowed a tradeoff between ribosome load and mRNA stability that we dissect in greater detail below.”
§ Combinatorial optimization of mRNA structure, stability, and translation for RNA-based therapeutics > RESULTS > High dynamic range of translation driven by UTRs
plaindirect- Asserted: passes — The authors put it forward as true.
- Checkable: passes — It can be checked against evidence.
- Load-bearing: passes — The paper’s conclusions depend on it.
- Based: passes — The paper gives a reason why it holds.
A result the paper reports from its own data — it cites no other source for it, so there is none to check. The quote shows it is in the paper.
In the paper
“We integrate our datasets to develop a model that accurately predicts protein output for a given mRNA based on its ribosome load and in-cell stability.”
§ Combinatorial optimization of mRNA structure, stability, and translation for RNA-based therapeutics > INTRODUCTION
plaincorrelational- Asserted: passes — The authors put it forward as true.
- Checkable: passes — It can be checked against evidence.
- Load-bearing: passes — The paper’s conclusions depend on it.
- Based: passes — The paper gives a reason why it holds.
- The authors state this as an assumption: Translation follows first-order kinetics and mRNA and protein decay are exponential.
A result the paper reports from its own data — it cites no other source for it, so there is none to check. The quote shows it is in the paper.
In the paper
“All of these sequences had a higher ribosome load (1.7–2.3) than the hHBB 5’ UTR (1.57), thereby identifying potential UTR design strategies to boost mRNA translational efficiency.”
§ Combinatorial optimization of mRNA structure, stability, and translation for RNA-based therapeutics > RESULTS > High dynamic range of translation driven by UTRs
plaincorrelational- Asserted: passes — The authors put it forward as true.
- Checkable: passes — It can be checked against evidence.
- Load-bearing: passes — The paper’s conclusions depend on it.
- Based: passes — The paper gives a reason why it holds.
A result the paper reports from its own data — it cites no other source for it, so there is none to check. The quote shows it is in the paper.
In the paper
“We first observed that mutation of the uORF in the 5’ UTR (AUG mutated to UUG; CoV2-UUG) resulted in higher ribosome load than the wildtype 5’ UTR (Fig. 1F–G).”
§ Combinatorial optimization of mRNA structure, stability, and translation for RNA-based therapeutics > RESULTS > High dynamic range of translation driven by UTRs
plaindirect- Asserted: passes — The authors put it forward as true.
- Checkable: passes — It can be checked against evidence.
- Load-bearing: passes — The paper’s conclusions depend on it.
- Based: passes — The paper gives a reason why it holds.
A result the paper reports from its own data — it cites no other source for it, so there is none to check. The quote shows it is in the paper.
In the paper
“In particular, deletion of SL1 from the SARS-CoV-2 5’ UTR increased ribosome load from 1.23 (CoV-2) to 1.5 (CoV-2-UUG-dSL-1) which almost reaches the level of ribosome load of hHBB (1.57) (Fig. 1G).”
§ Combinatorial optimization of mRNA structure, stability, and translation for RNA-based therapeutics > RESULTS > High dynamic range of translation driven by UTRs
plaindirect- Asserted: passes — The authors put it forward as true.
- Checkable: passes — It can be checked against evidence.
- Load-bearing: passes — The paper’s conclusions depend on it.
- Based: passes — The paper gives a reason why it holds.
A result the paper reports from its own data — it cites no other source for it, so there is none to check. The quote shows it is in the paper.
In the paper
“We found the most impactful effects of sequence k-mers at the 5’ and 3’ end of the randomized 5’ UTR stretch (Fig. S2E, Table S3).”
§ Combinatorial optimization of mRNA structure, stability, and translation for RNA-based therapeutics > RESULTS > High dynamic range of translation driven by UTRs
plaincorrelational- Asserted: passes — The authors put it forward as true.
- Checkable: passes — It can be checked against evidence.
- Load-bearing: unclear — It is unclear whether the paper’s conclusions depend on it.
- Based: passes — The paper gives a reason why it holds.
A result the paper reports from its own data — it cites no other source for it, so there is none to check. The quote shows it is in the paper.
In the paper
“Our mRNA library contained 233 different mRNA sequences in total (Table S1).”
§ Combinatorial optimization of mRNA structure, stability, and translation for RNA-based therapeutics > RESULTS > A combinatorial library for systematic discovery of mRNA design rules
plain- Asserted: passes — The authors put it forward as true.
- Checkable: passes — It can be checked against evidence.
- Load-bearing: passes — The paper’s conclusions depend on it.
- Based: passes — The paper gives a reason why it holds.
A result the paper reports from its own data — it cites no other source for it, so there is none to check. The quote shows it is in the paper.
In the paper
“The largest variation in ribosome load was observed for the 5’ UTR variants group (Fig. 1D).”
§ Combinatorial optimization of mRNA structure, stability, and translation for RNA-based therapeutics > RESULTS > High dynamic range of translation driven by UTRs
plaincorrelational- Asserted: passes — The authors put it forward as true.
- Checkable: passes — It can be checked against evidence.
- Load-bearing: passes — The paper’s conclusions depend on it.
- Based: passes — The paper gives a reason why it holds.
A result the paper reports from its own data — it cites no other source for it, so there is none to check. The quote shows it is in the paper.
In the paper
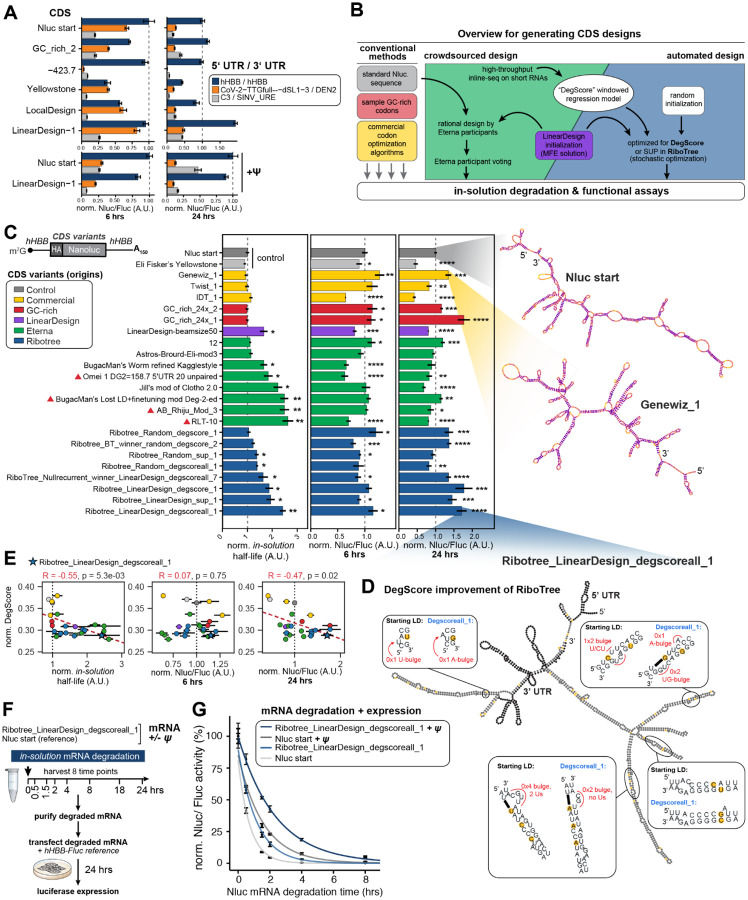
“6 of 8 RiboTree-optimized mRNA designs demonstrated higher luciferase activities than the Nluc reference mRNA at 24 hours”
§ Combinatorial optimization of mRNA structure, stability, and translation for RNA-based therapeutics > RESULTS > Integration of all design rules leads to mRNAs with both high in-solution stability and high protein output
boostedcorrelational- Asserted: passes — The authors put it forward as true.
- Checkable: passes — It can be checked against evidence.
- Load-bearing: passes — The paper’s conclusions depend on it.
- Based: passes — The paper gives a reason why it holds.
A result the paper reports from its own data — it cites no other source for it, so there is none to check. The quote shows it is in the paper.
In the paper
“When analyzed across known secondary structure motifs, the data revealed that the RNA sequence in a given structure can dramatically affect degradation of the structure motif.”
§ Combinatorial optimization of mRNA structure, stability, and translation for RNA-based therapeutics > RESULTS > Eterna-guided In-line-seq yields additional design principles and DegScore predictor
plaincorrelational- Asserted: passes — The authors put it forward as true.
- Checkable: passes — It can be checked against evidence.
- Load-bearing: passes — The paper’s conclusions depend on it.
- Based: passes — The paper gives a reason why it holds.
A result the paper reports from its own data — it cites no other source for it, so there is none to check. The quote shows it is in the paper.
In the paper
“the majority of the mRNA stabilized with ψ and a structure-optimized CDS remains functional after 2 hours of accelerated solution degradation”
§ Combinatorial optimization of mRNA structure, stability, and translation for RNA-based therapeutics > RESULTS > Integration of all design rules leads to mRNAs with both high in-solution stability and high protein output
plaindirect- Asserted: passes — The authors put it forward as true.
- Checkable: passes — It can be checked against evidence.
- Load-bearing: passes — The paper’s conclusions depend on it.
- Based: passes — The paper gives a reason why it holds.
A result the paper reports from its own data — it cites no other source for it, so there is none to check. The quote shows it is in the paper.
In the paper
“A particularly salient characteristic was suppressed hydrolysis in symmetric internal loops compared to asymmetric internal loops (Fig. 3C).”
§ Combinatorial optimization of mRNA structure, stability, and translation for RNA-based therapeutics > RESULTS > Eterna-guided In-line-seq yields additional design principles and DegScore predictor
plaincorrelational- Asserted: passes — The authors put it forward as true.
- Checkable: passes — It can be checked against evidence.
- Load-bearing: passes — The paper’s conclusions depend on it.
- Based: passes — The paper gives a reason why it holds.
A result the paper reports from its own data — it cites no other source for it, so there is none to check. The quote shows it is in the paper.
In the paper
“PERSIST-seq confirms predictions that extremely highly structured mRNAs can exhibit more than double the in-solution half-lives of conventionally designed mRNAs”
§ Combinatorial optimization of mRNA structure, stability, and translation for RNA-based therapeutics > DISCUSSION
plaindirect- Asserted: passes — The authors put it forward as true.
- Checkable: passes — It can be checked against evidence.
- Load-bearing: passes — The paper’s conclusions depend on it.
- Based: passes — The paper gives a reason why it holds.
A result the paper reports from its own data — it cites no other source for it, so there is none to check. The quote shows it is in the paper.
In the paper
“Within mRNAs encoding for a single protein (Nluc, eGFP, or MEV), the variance in in-solution half-lives was greater than for the variance across UTR variants (Fig. 2G), and these values correlated well with different metrics for predicted structure (see below).”
§ Combinatorial optimization of mRNA structure, stability, and translation for RNA-based therapeutics > RESULTS > mRNA length and structure drive in-solution mRNA stability
plain- Asserted: passes — The authors put it forward as true.
- Checkable: passes — It can be checked against evidence.
- Load-bearing: passes — The paper’s conclusions depend on it.
- Based: passes — The paper gives a reason why it holds.
- The authors state this as an assumption: The high pH buffer containing Mg2+ mimics the high effective pH and positively charged environment that can arise in lipid nanoparticles, protamine, and other formulations for mRNA therapeutics.
A result the paper reports from its own data — it cites no other source for it, so there is none to check. The quote shows it is in the paper.
In the paper
“this effect can be alleviated through inclusion of the nucleoside modification ψ or m1ψ”
§ Combinatorial optimization of mRNA structure, stability, and translation for RNA-based therapeutics > DISCUSSION
plaindirect- Asserted: passes — The authors put it forward as true.
- Checkable: passes — It can be checked against evidence.
- Load-bearing: passes — The paper’s conclusions depend on it.
- Based: passes — The paper gives a reason why it holds.
The paper states this without a source or data behind it here, so there is nothing to check it against. The quote shows it is in the paper.
In the paper
“there is a ‘sweet spot’ for translation efficiency for maximal total protein output.”
§ Combinatorial optimization of mRNA structure, stability, and translation for RNA-based therapeutics > DISCUSSION
plaincorrelational- Asserted: passes — The authors put it forward as true.
- Checkable: passes — It can be checked against evidence.
- Load-bearing: passes — The paper’s conclusions depend on it.
- Based: passes — The paper gives a reason why it holds.
A result the paper reports from its own data — it cites no other source for it, so there is none to check. The quote shows it is in the paper.
In the paper
“In addition, we noted rules for hydrolytic degradation that depended on the type of RNA structural loop in which a nucleotide appears.”
§ Combinatorial optimization of mRNA structure, stability, and translation for RNA-based therapeutics > RESULTS > Eterna-guided In-line-seq yields additional design principles and DegScore predictor
plaincorrelational- Asserted: passes — The authors put it forward as true.
- Checkable: passes — It can be checked against evidence.
- Load-bearing: passes — The paper’s conclusions depend on it.
- Based: passes — The paper gives a reason why it holds.
A result the paper reports from its own data — it cites no other source for it, so there is none to check. The quote shows it is in the paper.
In the paper
“Structure mapping data based on SHAPE and DMS profiling confirmed that ψ and m1ψ substitutions did not change the global structure of the RNAs; the suppression of in-line hydrolysis appears to be due to local chemical or structural effects.”
§ Combinatorial optimization of mRNA structure, stability, and translation for RNA-based therapeutics > RESULTS > Pseudouridine stabilizes RNA in solution
boosted- Asserted: passes — The authors put it forward as true.
- Checkable: passes — It can be checked against evidence.
- Load-bearing: passes — The paper’s conclusions depend on it.
- Based: passes — The paper gives a reason why it holds.
A result the paper reports from its own data — it cites no other source for it, so there is none to check. The quote shows it is in the paper.
In the paper
“At 24 hours, the trend of lower luciferase activity continued for 6 of 8 Eterna-derived designs tested compared to the Nluc reference mRNA”
§ Combinatorial optimization of mRNA structure, stability, and translation for RNA-based therapeutics > RESULTS > Integration of all design rules leads to mRNAs with both high in-solution stability and high protein output
plain- Asserted: passes — The authors put it forward as true.
- Checkable: passes — It can be checked against evidence.
- Load-bearing: unclear — It is unclear whether the paper’s conclusions depend on it.
- Based: passes — The paper gives a reason why it holds.
A result the paper reports from its own data — it cites no other source for it, so there is none to check. The quote shows it is in the paper.
In the paper
“Consistent with our in-line hydrolysis data on small RYOS RNAs, we observed a 1.2–2.7-fold stabilization for these longer Nluc-encoding mRNAs when U was uniformly substituted with ψ (Fig. S5C).”
§ Combinatorial optimization of mRNA structure, stability, and translation for RNA-based therapeutics > RESULTS > Pseudouridine stabilizes RNA in solution
plaindirect- Asserted: passes — The authors put it forward as true.
- Checkable: passes — It can be checked against evidence.
- Load-bearing: passes — The paper’s conclusions depend on it.
- Based: passes — The paper gives a reason why it holds.
A result the paper reports from its own data — it cites no other source for it, so there is none to check. The quote shows it is in the paper.
In the paper
“For our library of 233 mRNAs, PERSIST-seq gives a wide dynamic range of in-cell half-lives, ranging from less than 5 hours to over 15 hours (Fig. 2A).”
§ Combinatorial optimization of mRNA structure, stability, and translation for RNA-based therapeutics > RESULTS > In-cell mRNA stability is a major predictor of total protein output
plain- Asserted: passes — The authors put it forward as true.
- Checkable: passes — It can be checked against evidence.
- Load-bearing: passes — The paper’s conclusions depend on it.
- Based: passes — The paper gives a reason why it holds.
A result the paper reports from its own data — it cites no other source for it, so there is none to check. The quote shows it is in the paper.
In the paper
“whereas most vendor-derived and GC-rich designs had slightly higher activities (Fig. 4C).”
§ Combinatorial optimization of mRNA structure, stability, and translation for RNA-based therapeutics > RESULTS > Integration of all design rules leads to mRNAs with both high in-solution stability and high protein output
plaincorrelational- Asserted: passes — The authors put it forward as true.
- Checkable: passes — It can be checked against evidence.
- Load-bearing: unclear — It is unclear whether the paper’s conclusions depend on it.
- Based: passes — The paper gives a reason why it holds.
A result the paper reports from its own data — it cites no other source for it, so there is none to check. The quote shows it is in the paper.
In the paper
“At a broad level, the data confirmed that RNA structure was a dominant predictor of in-line hydrolysis rate (compare, e.g., SHAPE to in-line data; Fig. S4A), but a closer look revealed additional sequence and structure dependent rules for in-line hydrolysis.”
§ Combinatorial optimization of mRNA structure, stability, and translation for RNA-based therapeutics > RESULTS > Eterna-guided In-line-seq yields additional design principles and DegScore predictor
boostedcorrelational- Asserted: passes — The authors put it forward as true.
- Checkable: passes — It can be checked against evidence.
- Load-bearing: passes — The paper’s conclusions depend on it.
- Based: passes — The paper gives a reason why it holds.
A result the paper reports from its own data — it cites no other source for it, so there is none to check. The quote shows it is in the paper.
In the paper
“Moreover, using our RNA degradation predictor DegScore and Eterna-derived designs, we saw that the highly structured CDSs can strongly affect both the in-solution stability of mRNAs and their protein synthesis in cells (Fig. 2, Fig. 3).”
§ Combinatorial optimization of mRNA structure, stability, and translation for RNA-based therapeutics > RESULTS > One-by-one tests confirm additivity of UTR, CDS, and ψ improvements
boosteddirect- Asserted: passes — The authors put it forward as true.
- Checkable: passes — It can be checked against evidence.
- Load-bearing: passes — The paper’s conclusions depend on it.
- Based: passes — The paper gives a reason why it holds.
A result the paper reports from its own data — it cites no other source for it, so there is none to check. The quote shows it is in the paper.
In the paper
“For example, in cells, modulation of UTR sequence produced large variation in in-cell stability (Fig. 2A), presumably through changes in recruitment of cellular machinery that affect mRNA decay.”
§ Combinatorial optimization of mRNA structure, stability, and translation for RNA-based therapeutics > RESULTS > mRNA length and structure drive in-solution mRNA stability
plaindirect- Asserted: passes — The authors put it forward as true.
- Checkable: passes — It can be checked against evidence.
- Load-bearing: passes — The paper’s conclusions depend on it.
- Based: passes — The paper gives a reason why it holds.
- The authors state this as an assumption: The high pH buffer containing Mg2+ mimics the high effective pH and positively charged environment that can arise in lipid nanoparticles, protamine, and other formulations for mRNA therapeutics.
A result the paper reports from its own data — it cites no other source for it, so there is none to check. The quote shows it is in the paper.
In the paper
“In contrast, in aqueous solution without such cellular machinery, changing the UTRs produced comparably little change in RNA stability to hydrolytic degradation of the CDS (Fig. 2G).”
§ Combinatorial optimization of mRNA structure, stability, and translation for RNA-based therapeutics > RESULTS > mRNA length and structure drive in-solution mRNA stability
plain- Asserted: passes — The authors put it forward as true.
- Checkable: passes — It can be checked against evidence.
- Load-bearing: passes — The paper’s conclusions depend on it.
- Based: passes — The paper gives a reason why it holds.
- The authors state this as an assumption: The high pH buffer containing Mg2+ mimics the high effective pH and positively charged environment that can arise in lipid nanoparticles, protamine, and other formulations for mRNA therapeutics.
A result the paper reports from its own data — it cites no other source for it, so there is none to check. The quote shows it is in the paper.
In the paper
“However, surprisingly, we instead observed the widest in-cell stability variation in the CDS and 5’ UTR variant groups (Fig. 2A).”
§ Combinatorial optimization of mRNA structure, stability, and translation for RNA-based therapeutics > RESULTS > In-cell mRNA stability is a major predictor of total protein output
plain- Asserted: passes — The authors put it forward as true.
- Checkable: passes — It can be checked against evidence.
- Load-bearing: passes — The paper’s conclusions depend on it.
- Based: passes — The paper gives a reason why it holds.
A result the paper reports from its own data — it cites no other source for it, so there is none to check. The quote shows it is in the paper.
In the paper
“Beyond the Nluc CDS variants, we confirmed that DegScore gave the highest accuracy in predicting in-solution stability when evaluated over all the measured mRNAs, including low and high structure eGFP mRNAs from Moderna researchers, Eterna, and Ribotree (Table S1 and Fig. S5A,B).”
§ Combinatorial optimization of mRNA structure, stability, and translation for RNA-based therapeutics > RESULTS > Eterna-guided In-line-seq yields additional design principles and DegScore predictor
plaincorrelational- Asserted: passes — The authors put it forward as true.
- Checkable: passes — It can be checked against evidence.
- Load-bearing: passes — The paper’s conclusions depend on it.
- Based: passes — The paper gives a reason why it holds.
A result the paper reports from its own data — it cites no other source for it, so there is none to check. The quote shows it is in the paper.
In the paper
“For example, in the case of the most-sampled secondary structure of triloops, the in-line hydrolysis rates varied by up to 100-fold depending on sequence (Fig. S4B).”
§ Combinatorial optimization of mRNA structure, stability, and translation for RNA-based therapeutics > RESULTS > Eterna-guided In-line-seq yields additional design principles and DegScore predictor
plaincorrelational- Asserted: passes — The authors put it forward as true.
- Checkable: passes — It can be checked against evidence.
- Load-bearing: passes — The paper’s conclusions depend on it.
- Based: passes — The paper gives a reason why it holds.
A result the paper reports from its own data — it cites no other source for it, so there is none to check. The quote shows it is in the paper.
In the paper
“and moderately with 24 hour protein expression (R = −0.47, p = 0.02)”
§ Combinatorial optimization of mRNA structure, stability, and translation for RNA-based therapeutics > RESULTS > Integration of all design rules leads to mRNAs with both high in-solution stability and high protein output
plaincorrelational- Asserted: passes — The authors put it forward as true.
- Checkable: passes — It can be checked against evidence.
- Load-bearing: passes — The paper’s conclusions depend on it.
- Based: passes — The paper gives a reason why it holds.
A result the paper reports from its own data — it cites no other source for it, so there is none to check. The quote shows it is in the paper.
In the paper
“The largest changes in in-solution stability occurred across CDS variants.”
§ Combinatorial optimization of mRNA structure, stability, and translation for RNA-based therapeutics > RESULTS > mRNA length and structure drive in-solution mRNA stability
plaincorrelational- Asserted: passes — The authors put it forward as true.
- Checkable: passes — It can be checked against evidence.
- Load-bearing: passes — The paper’s conclusions depend on it.
- Based: passes — The paper gives a reason why it holds.
- The authors state this as an assumption: The high pH buffer containing Mg2+ mimics the high effective pH and positively charged environment that can arise in lipid nanoparticles, protamine, and other formulations for mRNA therapeutics.
A result the paper reports from its own data — it cites no other source for it, so there is none to check. The quote shows it is in the paper.
In the paper
“Importantly, both Nluc start and LinearDesign-1 CDSs with hHBB UTRs maintained high protein expression at 6 and 24 hours (Fig. 4A) indicating that, despite ψ modification and highly structured CDSs, translation is sustained.”
§ Combinatorial optimization of mRNA structure, stability, and translation for RNA-based therapeutics > RESULTS > One-by-one tests confirm additivity of UTR, CDS, and ψ improvements
plain- Asserted: passes — The authors put it forward as true.
- Checkable: passes — It can be checked against evidence.
- Load-bearing: passes — The paper’s conclusions depend on it.
- Based: passes — The paper gives a reason why it holds.
A result the paper reports from its own data — it cites no other source for it, so there is none to check. The quote shows it is in the paper.
In the paper
“The shortest mRNAs in the pool, encoding a multi-epitope SARS-CoV-2 vaccine CDS (MEV), exhibited in-solution half-lives of 3.4±0.6 hours.”
§ Combinatorial optimization of mRNA structure, stability, and translation for RNA-based therapeutics > RESULTS > mRNA length and structure drive in-solution mRNA stability
plain- Asserted: passes — The authors put it forward as true.
- Checkable: passes — It can be checked against evidence.
- Load-bearing: passes — The paper’s conclusions depend on it.
- Based: passes — The paper gives a reason why it holds.
- The authors state this as an assumption: The high pH buffer containing Mg2+ mimics the high effective pH and positively charged environment that can arise in lipid nanoparticles, protamine, and other formulations for mRNA therapeutics.
A result the paper reports from its own data — it cites no other source for it, so there is none to check. The quote shows it is in the paper.
In the paper
“The results for in-solution stability were strikingly different from the results for in-cell stability across the mRNA library.”
§ Combinatorial optimization of mRNA structure, stability, and translation for RNA-based therapeutics > RESULTS > mRNA length and structure drive in-solution mRNA stability
boostedcorrelational- Asserted: passes — The authors put it forward as true.
- Checkable: passes — It can be checked against evidence.
- Load-bearing: passes — The paper’s conclusions depend on it.
- Based: passes — The paper gives a reason why it holds.
- The authors state this as an assumption: The high pH buffer containing Mg2+ mimics the high effective pH and positively charged environment that can arise in lipid nanoparticles, protamine, and other formulations for mRNA therapeutics.
A result the paper reports from its own data — it cites no other source for it, so there is none to check. The quote shows it is in the paper.
In the paper
“yielded an mRNA that was both highly stable in solution (t1/2 = 2.4, relative to Nluc start)”
§ Combinatorial optimization of mRNA structure, stability, and translation for RNA-based therapeutics > RESULTS > Integration of all design rules leads to mRNAs with both high in-solution stability and high protein output
plainSingle case- Asserted: passes — The authors put it forward as true.
- Checkable: passes — It can be checked against evidence.
- Load-bearing: passes — The paper’s conclusions depend on it.
- Based: passes — The paper gives a reason why it holds.
A result the paper reports from its own data — it cites no other source for it, so there is none to check. The quote shows it is in the paper.
In the paper
“As expected, preparation of mRNAs with ψ substituted for U led to increased in-solution stability across both these CDSs, independent of UTR (Fig. S6).”
§ Combinatorial optimization of mRNA structure, stability, and translation for RNA-based therapeutics > RESULTS > One-by-one tests confirm additivity of UTR, CDS, and ψ improvements
plaindirect- Asserted: passes — The authors put it forward as true.
- Checkable: passes — It can be checked against evidence.
- Load-bearing: passes — The paper’s conclusions depend on it.
- Based: passes — The paper gives a reason why it holds.
A result the paper reports from its own data — it cites no other source for it, so there is none to check. The quote shows it is in the paper.
In the paper
“RNA linkages 5’ of a uridine residue are particularly susceptible to degradation”
§ Combinatorial optimization of mRNA structure, stability, and translation for RNA-based therapeutics > DISCUSSION
plaindirect- Asserted: passes — The authors put it forward as true.
- Checkable: passes — It can be checked against evidence.
- Load-bearing: passes — The paper’s conclusions depend on it.
- Based: passes — The paper gives a reason why it holds.
A result the paper reports from its own data — it cites no other source for it, so there is none to check. The quote shows it is in the paper.
In the paper
“More specifically, these unstable mRNAs include 5’ UTR or 5’/3’ UTR variants that were heavily polysome shifted (Fig. 2B, polysome/monosome ratio).”
§ Combinatorial optimization of mRNA structure, stability, and translation for RNA-based therapeutics > RESULTS > In-cell mRNA stability is a major predictor of total protein output
plaincorrelational- Asserted: passes — The authors put it forward as true.
- Checkable: passes — It can be checked against evidence.
- Load-bearing: passes — The paper’s conclusions depend on it.
- Based: passes — The paper gives a reason why it holds.
A result the paper reports from its own data — it cites no other source for it, so there is none to check. The quote shows it is in the paper.
In the paper
“Increased association to monosomes and thus a more moderate increase in overall ribosome load is positively associated with mRNA stability (Fig. 2B, monosomes/pre-polysome(pre-80S) ratios).”
§ Combinatorial optimization of mRNA structure, stability, and translation for RNA-based therapeutics > RESULTS > In-cell mRNA stability is a major predictor of total protein output
plaincorrelational- Asserted: passes — The authors put it forward as true.
- Checkable: passes — It can be checked against evidence.
- Load-bearing: passes — The paper’s conclusions depend on it.
- Based: passes — The paper gives a reason why it holds.
A result the paper reports from its own data — it cites no other source for it, so there is none to check. The quote shows it is in the paper.
In the paper
“yet was uncorrelated with 6 hour protein expression (Fig. 4E).”
§ Combinatorial optimization of mRNA structure, stability, and translation for RNA-based therapeutics > RESULTS > Integration of all design rules leads to mRNAs with both high in-solution stability and high protein output
plain- Asserted: passes — The authors put it forward as true.
- Checkable: passes — It can be checked against evidence.
- Load-bearing: passes — The paper’s conclusions depend on it.
- Based: passes — The paper gives a reason why it holds.
A result the paper reports from its own data — it cites no other source for it, so there is none to check. The quote shows it is in the paper.
In the paper
“The largest spread of in-solution half-lives (2.8-fold) occurred in the CDS variants for Nluc mRNAs.”
§ Combinatorial optimization of mRNA structure, stability, and translation for RNA-based therapeutics > RESULTS > mRNA length and structure drive in-solution mRNA stability
plain- Asserted: passes — The authors put it forward as true.
- Checkable: passes — It can be checked against evidence.
- Load-bearing: unclear — It is unclear whether the paper’s conclusions depend on it.
- Based: passes — The paper gives a reason why it holds.
- The authors state this as an assumption: The high pH buffer containing Mg2+ mimics the high effective pH and positively charged environment that can arise in lipid nanoparticles, protamine, and other formulations for mRNA therapeutics.
A result the paper reports from its own data — it cites no other source for it, so there is none to check. The quote shows it is in the paper.
In the paper
“Indeed, by 24 hours, the mRNA with the LinearDesign-1 CDS displayed an outstanding two-fold increase in luciferase yield compared to that of Nluc start (Fig. 4A).”
§ Combinatorial optimization of mRNA structure, stability, and translation for RNA-based therapeutics > RESULTS > One-by-one tests confirm additivity of UTR, CDS, and ψ improvements
boosteddirect- Asserted: passes — The authors put it forward as true.
- Checkable: passes — It can be checked against evidence.
- Load-bearing: passes — The paper’s conclusions depend on it.
- Based: passes — The paper gives a reason why it holds.
A result the paper reports from its own data — it cites no other source for it, so there is none to check. The quote shows it is in the paper.
In the paper
“the optimized Ribotree_LinearDesign_degscoreall_1 mRNA exhibited higher resistance to degradation in-solution than the Nluc Start mRNA”
§ Combinatorial optimization of mRNA structure, stability, and translation for RNA-based therapeutics > RESULTS > Integration of all design rules leads to mRNAs with both high in-solution stability and high protein output
plaincorrelational- Asserted: passes — The authors put it forward as true.
- Checkable: passes — It can be checked against evidence.
- Load-bearing: passes — The paper’s conclusions depend on it.
- Based: passes — The paper gives a reason why it holds.
A result the paper reports from its own data — it cites no other source for it, so there is none to check. The quote shows it is in the paper.
In the paper
“We also observed suppression of in-line hydrolysis at nucleotides 1 to 2 positions 5′ of the substitution (Fig. 3F), possibly due to locally enhanced base stacking72.”
§ Combinatorial optimization of mRNA structure, stability, and translation for RNA-based therapeutics > RESULTS > Pseudouridine stabilizes RNA in solution
hedgeddirect- Asserted: passes — The authors put it forward as true.
- Checkable: passes — It can be checked against evidence.
- Load-bearing: passes — The paper’s conclusions depend on it.
- Based: passes — The paper gives a reason why it holds.
A result the paper reports from its own data — it cites no other source for it, so there is none to check. The quote shows it is in the paper.
In the paper
“Compared to the Nluc start reference sequence, designs originating from Eterna exhibited up to 2.6-fold higher in-solution half-life (see, e.g., RLT-10)”
§ Combinatorial optimization of mRNA structure, stability, and translation for RNA-based therapeutics > RESULTS > Integration of all design rules leads to mRNAs with both high in-solution stability and high protein output
plaincorrelational- Asserted: passes — The authors put it forward as true.
- Checkable: passes — It can be checked against evidence.
- Load-bearing: passes — The paper’s conclusions depend on it.
- Based: passes — The paper gives a reason why it holds.
The paper states this without a source or data behind it here, so there is nothing to check it against. The quote shows it is in the paper.
In the paper
“By combining optimal UTRs, DegScore optimization with RiboTree, and ψ modification, we are able to achieve high mRNA stability and improved protein expression.”
§ Combinatorial optimization of mRNA structure, stability, and translation for RNA-based therapeutics > DISCUSSION
plaindirect- Asserted: passes — The authors put it forward as true.
- Checkable: passes — It can be checked against evidence.
- Load-bearing: passes — The paper’s conclusions depend on it.
- Based: passes — The paper gives a reason why it holds.
A result the paper reports from its own data — it cites no other source for it, so there is none to check. The quote shows it is in the paper.
In the paper
“and the “Maximum Ladder Distance73,” or the maximum helix path length (R = −0.55, p<0.001)”
§ Combinatorial optimization of mRNA structure, stability, and translation for RNA-based therapeutics > RESULTS > Integration of all design rules leads to mRNAs with both high in-solution stability and high protein output
plaincorrelational- Asserted: passes — The authors put it forward as true.
- Checkable: passes — It can be checked against evidence.
- Load-bearing: passes — The paper’s conclusions depend on it.
- Based: passes — The paper gives a reason why it holds.
A result the paper reports from its own data — it cites no other source for it, so there is none to check. The quote shows it is in the paper.
In the paper
“include multiple cellular 5’ UTRs as well as, unexpectedly, the dengue virus 5’ and 3’ UTRs”
§ Combinatorial optimization of mRNA structure, stability, and translation for RNA-based therapeutics > DISCUSSION
plaindirect- Asserted: passes — The authors put it forward as true.
- Checkable: passes — It can be checked against evidence.
- Load-bearing: passes — The paper’s conclusions depend on it.
- Based: passes — The paper gives a reason why it holds.
A result the paper reports from its own data — it cites no other source for it, so there is none to check. The quote shows it is in the paper.
In the paper
“Strikingly, the accuracy of DegScore outperformed the accuracy of two other metrics that have been used in prior studies to parametrize RNA structure but do not take into sequence or structure-motif dependences of RNA hydrolysis: the free energy of the predicted minimum free energy secondary structure, the metric used in several design algorithms including LinearDesign (dGMFE; R = −0.53), and the”
§ Combinatorial optimization of mRNA structure, stability, and translation for RNA-based therapeutics > RESULTS > Eterna-guided In-line-seq yields additional design principles and DegScore predictor
boostedcorrelational- Asserted: passes — The authors put it forward as true.
- Checkable: passes — It can be checked against evidence.
- Load-bearing: passes — The paper’s conclusions depend on it.
- Based: passes — The paper gives a reason why it holds.
A result the paper reports from its own data — it cites no other source for it, so there is none to check. The quote shows it is in the paper.
In the paper
“The DegScore regression coefficients with the largest magnitude corresponded to the identity of the nucleotide 3’ of a linkage (Fig. 3D).”
§ Combinatorial optimization of mRNA structure, stability, and translation for RNA-based therapeutics > RESULTS > Eterna-guided In-line-seq yields additional design principles and DegScore predictor
plaincorrelational- Asserted: passes — The authors put it forward as true.
- Checkable: passes — It can be checked against evidence.
- Load-bearing: passes — The paper’s conclusions depend on it.
- Based: passes — The paper gives a reason why it holds.
The paper states this without a source or data behind it here, so there is nothing to check it against. The quote shows it is in the paper.
In the paper
“high translation efficiency mRNAs associated with the heaviest polysomes tend to be less stable”
§ Combinatorial optimization of mRNA structure, stability, and translation for RNA-based therapeutics > DISCUSSION
hedgedcorrelational- Asserted: passes — The authors put it forward as true.
- Checkable: passes — It can be checked against evidence.
- Load-bearing: passes — The paper’s conclusions depend on it.
- Based: passes — The paper gives a reason why it holds.
A result the paper reports from its own data — it cites no other source for it, so there is none to check. The quote shows it is in the paper.
In the paper
“LinearDesign-1 CDS mRNAs also exhibited a particularly long in-solution half-life (Fig. 3G–H).”
§ Combinatorial optimization of mRNA structure, stability, and translation for RNA-based therapeutics > RESULTS > One-by-one tests confirm additivity of UTR, CDS, and ψ improvements
plain- Asserted: passes — The authors put it forward as true.
- Checkable: passes — It can be checked against evidence.
- Load-bearing: passes — The paper’s conclusions depend on it.
- Based: passes — The paper gives a reason why it holds.
A result the paper reports from its own data — it cites no other source for it, so there is none to check. The quote shows it is in the paper.
In the paper
“We did note that mRNAs designed to have highly structured CDSs by the LinearDesign algorithm exhibited polysome fraction profiles dominated by 80S monosomes (Fig. 1E), further discussed below.”
§ Combinatorial optimization of mRNA structure, stability, and translation for RNA-based therapeutics > RESULTS > High dynamic range of translation driven by UTRs
plaincorrelational- Asserted: passes — The authors put it forward as true.
- Checkable: passes — It can be checked against evidence.
- Load-bearing: unclear — It is unclear whether the paper’s conclusions depend on it.
- Based: passes — The paper gives a reason why it holds.
A result the paper reports from its own data — it cites no other source for it, so there is none to check. The quote shows it is in the paper.
In the paper
“For the Nluc CDS variants that showed the widest variance in in-solution half-lives, we observed a strong correlation of DegScore predictions to the in-solution half-lives (Pearson R = −0.63, p<0.0001).”
§ Combinatorial optimization of mRNA structure, stability, and translation for RNA-based therapeutics > RESULTS > Eterna-guided In-line-seq yields additional design principles and DegScore predictor
boostedcorrelational- Asserted: passes — The authors put it forward as true.
- Checkable: passes — It can be checked against evidence.
- Load-bearing: passes — The paper’s conclusions depend on it.
- Based: passes — The paper gives a reason why it holds.
A result the paper reports from its own data — it cites no other source for it, so there is none to check. The quote shows it is in the paper.
In the paper
“Designs from the LinearDesign server and modifications to these designs from both Eterna participants (e.g., AB_rhiju_mod3) and the RiboTree algorithm produced constructs with increased half-life up to approximately 2.5-fold over the Nluc reference sequence”
§ Combinatorial optimization of mRNA structure, stability, and translation for RNA-based therapeutics > RESULTS > Integration of all design rules leads to mRNAs with both high in-solution stability and high protein output
plaindirect- Asserted: passes — The authors put it forward as true.
- Checkable: passes — It can be checked against evidence.
- Load-bearing: passes — The paper’s conclusions depend on it.
- Based: passes — The paper gives a reason why it holds.
A result the paper reports from its own data — it cites no other source for it, so there is none to check. The quote shows it is in the paper.
In the paper
“Furthermore, in many RNA loop types, it appeared that linkages that lead to a 3’ uridine were particularly prone to degradation (Fig. 3C, Fig. S4C), and this effect was reproduced in follow-up experiments using capillary electrophoresis readouts (Fig. S4D).”
§ Combinatorial optimization of mRNA structure, stability, and translation for RNA-based therapeutics > RESULTS > Eterna-guided In-line-seq yields additional design principles and DegScore predictor
hedgedcorrelational- Asserted: passes — The authors put it forward as true.
- Checkable: passes — It can be checked against evidence.
- Load-bearing: passes — The paper’s conclusions depend on it.
- Based: passes — The paper gives a reason why it holds.
A result the paper reports from its own data — it cites no other source for it, so there is none to check. The quote shows it is in the paper.
In the paper
“This technology identifies previously unknown tradeoffs and additive effects between different tunable aspects of mRNA performance as key determinants.”
§ Combinatorial optimization of mRNA structure, stability, and translation for RNA-based therapeutics > DISCUSSION
plaindirect- Asserted: passes — The authors put it forward as true.
- Checkable: passes — It can be checked against evidence.
- Load-bearing: passes — The paper’s conclusions depend on it.
- Based: passes — The paper gives a reason why it holds.
A result the paper reports from its own data — it cites no other source for it, so there is none to check. The quote shows it is in the paper.
In the paper
“These computational modifications are characterized by reducing the presence of Us in loops, and shifting local base-pairing to minimize the overall size of loops, even if such shifts result in additional smaller loops.”
§ Combinatorial optimization of mRNA structure, stability, and translation for RNA-based therapeutics > RESULTS > Integration of all design rules leads to mRNAs with both high in-solution stability and high protein output
plaindirectSingle case- Asserted: passes — The authors put it forward as true.
- Checkable: passes — It can be checked against evidence.
- Load-bearing: passes — The paper’s conclusions depend on it.
- Based: passes — The paper gives a reason why it holds.
A result the paper reports from its own data — it cites no other source for it, so there is none to check. The quote shows it is in the paper.
In the paper
“In terms of in-solution stability, we expected the mRNAs with the longer UTRs to have consistently reduced half-life to hydrolytic degradation across all 6 CDSs, and capillary electrophoresis experiments confirmed this expectation (Fig. S6).”
§ Combinatorial optimization of mRNA structure, stability, and translation for RNA-based therapeutics > RESULTS > One-by-one tests confirm additivity of UTR, CDS, and ψ improvements
boosteddirect- Asserted: passes — The authors put it forward as true.
- Checkable: passes — It can be checked against evidence.
- Load-bearing: passes — The paper’s conclusions depend on it.
- Based: passes — The paper gives a reason why it holds.
A result the paper reports from its own data — it cites no other source for it, so there is none to check. The quote shows it is in the paper.
In the paper
“We observed that substitution of U with either ψ or m1ψ led to remarkable suppression of in-line hydrolysis at the substituted residues, presumably through changed nucleophilicity at the site of substitution (Fig. 3F).”
§ Combinatorial optimization of mRNA structure, stability, and translation for RNA-based therapeutics > RESULTS > Pseudouridine stabilizes RNA in solution
plaindirect- Asserted: passes — The authors put it forward as true.
- Checkable: passes — It can be checked against evidence.
- Load-bearing: passes — The paper’s conclusions depend on it.
- Based: passes — The paper gives a reason why it holds.
A result the paper reports from its own data — it cites no other source for it, so there is none to check. The quote shows it is in the paper.
In the paper
“The selected CDS designs represented CDSs from diverse origins that support a range of observed in-solution half-lives (from 0.69- to 1.8-fold relative to our reference ‘Nluc start’ sequence; Fig. 2G).”
§ Combinatorial optimization of mRNA structure, stability, and translation for RNA-based therapeutics > RESULTS > One-by-one tests confirm additivity of UTR, CDS, and ψ improvements
plain- Asserted: passes — The authors put it forward as true.
- Checkable: passes — It can be checked against evidence.
- Load-bearing: unclear — It is unclear whether the paper’s conclusions depend on it.
- Based: passes — The paper gives a reason why it holds.
The paper states this without a source or data behind it here, so there is nothing to check it against. The quote shows it is in the paper.
In the paper
“Our first set of experimental findings derive from the integrated PERSIST-seq technology, which enables massively parallel evaluation of the effects of UTR and CDS sequence and structure on in-cell mRNA translation efficiency, in-cell mRNA stability, and in-solution stability.”
§ Combinatorial optimization of mRNA structure, stability, and translation for RNA-based therapeutics > DISCUSSION
plain- Asserted: passes — The authors put it forward as true.
- Checkable: passes — It can be checked against evidence.
- Load-bearing: passes — The paper’s conclusions depend on it.
- Based: passes — The paper gives a reason why it holds.
A result the paper reports from its own data — it cites no other source for it, so there is none to check. The quote shows it is in the paper.
In the paper
“6 hour protein expression correlated strongly with the predicted number of hairpins (R = 0.70, p<0.001)”
§ Combinatorial optimization of mRNA structure, stability, and translation for RNA-based therapeutics > RESULTS > Integration of all design rules leads to mRNAs with both high in-solution stability and high protein output
boostedcorrelational- Asserted: passes — The authors put it forward as true.
- Checkable: passes — It can be checked against evidence.
- Load-bearing: passes — The paper’s conclusions depend on it.
- Based: passes — The paper gives a reason why it holds.
A result the paper reports from its own data — it cites no other source for it, so there is none to check. The quote shows it is in the paper.
In the paper
“To distill these observations into a predictive model, we trained a windowed ridge regression model called ‘DegScore’ based on these In-line-seq data (Fig. 3D; see Methods) which quantitatively captured features like the increased hydrolysis rates at linkages leading to 3’ U (Fig. 3D).”
§ Combinatorial optimization of mRNA structure, stability, and translation for RNA-based therapeutics > RESULTS > Eterna-guided In-line-seq yields additional design principles and DegScore predictor
plaincorrelational- Asserted: passes — The authors put it forward as true.
- Checkable: passes — It can be checked against evidence.
- Load-bearing: passes — The paper’s conclusions depend on it.
- Based: passes — The paper gives a reason why it holds.
A result the paper reports from its own data — it cites no other source for it, so there is none to check. The quote shows it is in the paper.
In the paper
“the dengue virus 5’ and 3’ UTRs, which both individually increase ribosome loading”
§ Combinatorial optimization of mRNA structure, stability, and translation for RNA-based therapeutics > DISCUSSION
plaindirect- Asserted: passes — The authors put it forward as true.
- Checkable: passes — It can be checked against evidence.
- Load-bearing: passes — The paper’s conclusions depend on it.
- Based: passes — The paper gives a reason why it holds.
A result the paper reports from its own data — it cites no other source for it, so there is none to check. The quote shows it is in the paper.
In the paper
“As noted above, we observed less variance in ribosome loading among CDS variants than for UTR variants (Fig. 1D–E).”
§ Combinatorial optimization of mRNA structure, stability, and translation for RNA-based therapeutics > RESULTS > High dynamic range of translation driven by UTRs
plain- Asserted: passes — The authors put it forward as true.
- Checkable: passes — It can be checked against evidence.
- Load-bearing: passes — The paper’s conclusions depend on it.
- Based: passes — The paper gives a reason why it holds.
A result the paper reports from its own data — it cites no other source for it, so there is none to check. The quote shows it is in the paper.
In the paper
“while designs from commercial algorithms or optimized GC-content tended to exhibit similar in-solution half-lives (Fig. 4C).”
§ Combinatorial optimization of mRNA structure, stability, and translation for RNA-based therapeutics > RESULTS > Integration of all design rules leads to mRNAs with both high in-solution stability and high protein output
hedged- Asserted: passes — The authors put it forward as true.
- Checkable: passes — It can be checked against evidence.
- Load-bearing: passes — The paper’s conclusions depend on it.
- Based: passes — The paper gives a reason why it holds.
A result the paper reports from its own data — it cites no other source for it, so there is none to check. The quote shows it is in the paper.
In the paper
“incorporation of ψ into either mRNA further enhanced in-solution stability, this time with a readout based on mRNA function in cells (Fig 4G).”
§ Combinatorial optimization of mRNA structure, stability, and translation for RNA-based therapeutics > RESULTS > Integration of all design rules leads to mRNAs with both high in-solution stability and high protein output
plaindirect- Asserted: passes — The authors put it forward as true.
- Checkable: passes — It can be checked against evidence.
- Load-bearing: passes — The paper’s conclusions depend on it.
- Based: passes — The paper gives a reason why it holds.
The paper states this without a source or data behind it here, so there is nothing to check it against. The quote shows it is in the paper.
In the paper
“The longest mRNAs, encoding eGFP, exhibited much shorter in-solution half-lives of 1.1±0.08 hours (Fig. 2G), as expected given the larger number of sites of potential hydrolysis.”
§ Combinatorial optimization of mRNA structure, stability, and translation for RNA-based therapeutics > RESULTS > mRNA length and structure drive in-solution mRNA stability
plaincorrelational- Asserted: passes — The authors put it forward as true.
- Checkable: passes — It can be checked against evidence.
- Load-bearing: passes — The paper’s conclusions depend on it.
- Based: passes — The paper gives a reason why it holds.
- The authors state this as an assumption: The high pH buffer containing Mg2+ mimics the high effective pH and positively charged environment that can arise in lipid nanoparticles, protamine, and other formulations for mRNA therapeutics.
A result the paper reports from its own data — it cites no other source for it, so there is none to check. The quote shows it is in the paper.
In the paper
“whereas our starting mRNA sequence gives negligible in-cell activity after the same degradation (Fig 4G).”
§ Combinatorial optimization of mRNA structure, stability, and translation for RNA-based therapeutics > RESULTS > Integration of all design rules leads to mRNAs with both high in-solution stability and high protein output
plainSingle case- Asserted: passes — The authors put it forward as true.
- Checkable: passes — It can be checked against evidence.
- Load-bearing: passes — The paper’s conclusions depend on it.
- Based: passes — The paper gives a reason why it holds.
A result the paper reports from its own data — it cites no other source for it, so there is none to check. The quote shows it is in the paper.
In the paper
“Thus far we found that mRNAs harboring highly structured 5’ and 3’ UTRs can support high levels of protein synthesis in cells.”
§ Combinatorial optimization of mRNA structure, stability, and translation for RNA-based therapeutics > RESULTS > One-by-one tests confirm additivity of UTR, CDS, and ψ improvements
plaindirect- Asserted: passes — The authors put it forward as true.
- Checkable: passes — It can be checked against evidence.
- Load-bearing: passes — The paper’s conclusions depend on it.
- Based: passes — The paper gives a reason why it holds.
A result the paper reports from its own data — it cites no other source for it, so there is none to check. The quote shows it is in the paper.
In the paper
“We also noted that constructs with higher ribosome load values tended to be more unstable (Fig. 2B).”
§ Combinatorial optimization of mRNA structure, stability, and translation for RNA-based therapeutics > RESULTS > In-cell mRNA stability is a major predictor of total protein output
hedgedcorrelational- Asserted: passes — The authors put it forward as true.
- Checkable: passes — It can be checked against evidence.
- Load-bearing: passes — The paper’s conclusions depend on it.
- Based: passes — The paper gives a reason why it holds.
A result the paper reports from its own data — it cites no other source for it, so there is none to check. The quote shows it is in the paper.
In the paper
“The next largest source of variation in in-solution stability was driven by differences in mRNA structure.”
§ Combinatorial optimization of mRNA structure, stability, and translation for RNA-based therapeutics > RESULTS > mRNA length and structure drive in-solution mRNA stability
plaindirect- Asserted: passes — The authors put it forward as true.
- Checkable: passes — It can be checked against evidence.
- Load-bearing: passes — The paper’s conclusions depend on it.
- Based: passes — The paper gives a reason why it holds.
- The authors state this as an assumption: The high pH buffer containing Mg2+ mimics the high effective pH and positively charged environment that can arise in lipid nanoparticles, protamine, and other formulations for mRNA therapeutics.
A result the paper reports from its own data — it cites no other source for it, so there is none to check. The quote shows it is in the paper.
In the paper
“combining them in one mRNA resulted in an additive effect”
§ Combinatorial optimization of mRNA structure, stability, and translation for RNA-based therapeutics > DISCUSSION
plaindirect- Asserted: passes — The authors put it forward as true.
- Checkable: passes — It can be checked against evidence.
- Load-bearing: passes — The paper’s conclusions depend on it.
- Based: passes — The paper gives a reason why it holds.
A result the paper reports from its own data — it cites no other source for it, so there is none to check. The quote shows it is in the paper.
In the paper
“certain UTR combinations outperform hHBB in translation efficiency”
§ Combinatorial optimization of mRNA structure, stability, and translation for RNA-based therapeutics > DISCUSSION
plaindirect- Asserted: passes — The authors put it forward as true.
- Checkable: passes — It can be checked against evidence.
- Load-bearing: passes — The paper’s conclusions depend on it.
- Based: passes — The paper gives a reason why it holds.
A result the paper reports from its own data — it cites no other source for it, so there is none to check. The quote shows it is in the paper.
In the paper
“The ribosome load of CDS variants had no obvious correlation with the codon adaptation index (CAI), GC content, minimum free energy (MFE), addition of signal peptides, or nonsynonymous mutations (Table S1).”
§ Combinatorial optimization of mRNA structure, stability, and translation for RNA-based therapeutics > RESULTS > High dynamic range of translation driven by UTRs
plain- Asserted: passes — The authors put it forward as true.
- Checkable: passes — It can be checked against evidence.
- Load-bearing: passes — The paper’s conclusions depend on it.
- Based: passes — The paper gives a reason why it holds.
The paper states this without a source or data behind it here, so there is nothing to check it against. The quote shows it is in the paper.
In the paper
“The only clear effects on ribosome load were that MEV-encoding CDS variants displayed less ribosome load than Nluc- or eGFP-encoding CDS variants, as expected from their shorter ORFs.”
§ Combinatorial optimization of mRNA structure, stability, and translation for RNA-based therapeutics > RESULTS > High dynamic range of translation driven by UTRs
boosteddirect- Asserted: passes — The authors put it forward as true.
- Checkable: passes — It can be checked against evidence.
- Load-bearing: unclear — It is unclear whether the paper’s conclusions depend on it.
- Based: passes — The paper gives a reason why it holds.
A result the paper reports from its own data — it cites no other source for it, so there is none to check. The quote shows it is in the paper.
In the paper
“at 6 hours, both Eterna- and Ribotree-derived designs tended to have similar or lower luciferase activities than the reference Nluc sequence”
§ Combinatorial optimization of mRNA structure, stability, and translation for RNA-based therapeutics > RESULTS > Integration of all design rules leads to mRNAs with both high in-solution stability and high protein output
plain- Asserted: passes — The authors put it forward as true.
- Checkable: passes — It can be checked against evidence.
- Load-bearing: passes — The paper’s conclusions depend on it.
- Based: passes — The paper gives a reason why it holds.
A result the paper reports from its own data — it cites no other source for it, so there is none to check. The quote shows it is in the paper.
In the paper
“and these values correlated well with different metrics for predicted structure (see below).”
§ Combinatorial optimization of mRNA structure, stability, and translation for RNA-based therapeutics > RESULTS > mRNA length and structure drive in-solution mRNA stability
boostedcorrelational- Asserted: passes — The authors put it forward as true.
- Checkable: passes — It can be checked against evidence.
- Load-bearing: passes — The paper’s conclusions depend on it.
- Based: passes — The paper gives a reason why it holds.
- The authors state this as an assumption: The high pH buffer containing Mg2+ mimics the high effective pH and positively charged environment that can arise in lipid nanoparticles, protamine, and other formulations for mRNA therapeutics.
A result the paper reports from its own data — it cites no other source for it, so there is none to check. The quote shows it is in the paper.
In the paper
“DegScore correlated strongly with measured in-solution half-life (R = −0.55, p<0.001)”
§ Combinatorial optimization of mRNA structure, stability, and translation for RNA-based therapeutics > RESULTS > Integration of all design rules leads to mRNAs with both high in-solution stability and high protein output
boostedcorrelational- Asserted: passes — The authors put it forward as true.
- Checkable: passes — It can be checked against evidence.
- Load-bearing: passes — The paper’s conclusions depend on it.
- Based: passes — The paper gives a reason why it holds.
A result the paper reports from its own data — it cites no other source for it, so there is none to check. The quote shows it is in the paper.
In the paper
“The predicted and measured luciferase activities showed a correlation of r = 0.71 (Fig. 2F), supporting the accuracy of our model.”
§ Combinatorial optimization of mRNA structure, stability, and translation for RNA-based therapeutics > RESULTS > In-cell mRNA stability is a major predictor of total protein output
plaincorrelational- Asserted: passes — The authors put it forward as true.
- Checkable: passes — It can be checked against evidence.
- Load-bearing: passes — The paper’s conclusions depend on it.
- Based: passes — The paper gives a reason why it holds.
- The authors state this as an assumption: Translation follows first-order kinetics and mRNA and protein decay are exponential.
A result the paper reports from its own data — it cites no other source for it, so there is none to check. The quote shows it is in the paper.
In the paper
“After 6 hours, two CDSs (LinearDesign-1 (Fig. 3) and GCrich_2) achieved similarly high protein levels compared to Nluc start, when combined with hHBB 5’ and 3’ UTRs.”
§ Combinatorial optimization of mRNA structure, stability, and translation for RNA-based therapeutics > RESULTS > One-by-one tests confirm additivity of UTR, CDS, and ψ improvements
plaincorrelational- Asserted: passes — The authors put it forward as true.
- Checkable: passes — It can be checked against evidence.
- Load-bearing: passes — The paper’s conclusions depend on it.
- Based: passes — The paper gives a reason why it holds.
A result the paper reports from its own data — it cites no other source for it, so there is none to check. The quote shows it is in the paper.
In the paper
“and exhibited high levels of protein expression in cells (1.7-fold increase, relative to Nluc start) (Ribotree_LinearDesign_degscoreall_1; Fig. 4C).”
§ Combinatorial optimization of mRNA structure, stability, and translation for RNA-based therapeutics > RESULTS > Integration of all design rules leads to mRNAs with both high in-solution stability and high protein output
plaindirectSingle case- Asserted: passes — The authors put it forward as true.
- Checkable: passes — It can be checked against evidence.
- Load-bearing: passes — The paper’s conclusions depend on it.
- Based: passes — The paper gives a reason why it holds.
A result the paper reports from its own data — it cites no other source for it, so there is none to check. The quote shows it is in the paper.
In the paper
“a key determinant of in-solution RNA degradation is the presence of uridine”
§ Combinatorial optimization of mRNA structure, stability, and translation for RNA-based therapeutics > DISCUSSION
plaindirect- Asserted: passes — The authors put it forward as true.
- Checkable: passes — It can be checked against evidence.
- Load-bearing: passes — The paper’s conclusions depend on it.
- Based: passes — The paper gives a reason why it holds.
A result the paper reports from its own data — it cites no other source for it, so there is none to check. The quote shows it is in the paper.
In the paper
“Among the three UTR combinations and six CDS designs tested, most demonstrated lower overall luciferase activity than the reference start Nluc with hHBB UTRs (Fig 4A).”
§ Combinatorial optimization of mRNA structure, stability, and translation for RNA-based therapeutics > RESULTS > One-by-one tests confirm additivity of UTR, CDS, and ψ improvements
plaincorrelational- Asserted: passes — The authors put it forward as true.
- Checkable: passes — It can be checked against evidence.
- Load-bearing: unclear — It is unclear whether the paper’s conclusions depend on it.
- Based: passes — The paper gives a reason why it holds.
A result the paper reports from its own data — it cites no other source for it, so there is none to check. The quote shows it is in the paper.
In the paper
“but a closer look revealed additional sequence and structure dependent rules for in-line hydrolysis.”
§ Combinatorial optimization of mRNA structure, stability, and translation for RNA-based therapeutics > RESULTS > Eterna-guided In-line-seq yields additional design principles and DegScore predictor
plaincorrelational- Asserted: passes — The authors put it forward as true.
- Checkable: passes — It can be checked against evidence.
- Load-bearing: passes — The paper’s conclusions depend on it.
- Based: passes — The paper gives a reason why it holds.
A result the paper reports from its own data — it cites no other source for it, so there is none to check. The quote shows it is in the paper.
In the paper
“the dengue virus 5’ and 3’ UTRs, which both individually increase ribosome loading”
§ Combinatorial optimization of mRNA structure, stability, and translation for RNA-based therapeutics > DISCUSSION
plaindirect- Asserted: passes — The authors put it forward as true.
- Checkable: passes — It can be checked against evidence.
- Load-bearing: passes — The paper’s conclusions depend on it.
- Based: passes — The paper gives a reason why it holds.
The paper states this without a source or data behind it here, so there is nothing to check it against. The quote shows it is in the paper.
In the paper
“we find that in-cell mRNA stability may be a greater driver of protein output than high ribosome load particularly when proteins need to be expressed from a single dose of mRNAs for long periods of time.”
§ Combinatorial optimization of mRNA structure, stability, and translation for RNA-based therapeutics > DISCUSSION
hedgedconditional- Asserted: passes — The authors put it forward as true.
- Checkable: passes — It can be checked against evidence.
- Load-bearing: passes — The paper’s conclusions depend on it.
- Based: passes — The paper gives a reason why it holds.
The paper states this without a source or data behind it here, so there is nothing to check it against. The quote shows it is in the paper.
In the paper
“By combining optimal UTRs, DegScore optimization with RiboTree, and ψ modification, we are able to achieve high mRNA stability”
§ Combinatorial optimization of mRNA structure, stability, and translation for RNA-based therapeutics > DISCUSSION
plaindirect- Asserted: passes — The authors put it forward as true.
- Checkable: passes — It can be checked against evidence.
- Load-bearing: passes — The paper’s conclusions depend on it.
- Based: passes — The paper gives a reason why it holds.
A conclusion the paper draws from its own results — it cites no other source for it, so there is none to check. The quote shows it is in the paper.
In the paper
“this observation foreshadowed a tradeoff between ribosome load and mRNA stability that we dissect in greater detail below.”
- Also stated in: § In-cell mRNA stability is a major predictor of total protein output · plain
“Importantly, these findings identify an unexpected rule for the design of mRNA – excessively increasing translation efficiency may negatively impact mRNA stability.”
§ Combinatorial optimization of mRNA structure, stability, and translation for RNA-based therapeutics > RESULTS > High dynamic range of translation driven by UTRs
plainconditional- Asserted: passes — The authors put it forward as true.
- Checkable: passes — It can be checked against evidence.
- Load-bearing: passes — The paper’s conclusions depend on it.
- Based: passes — The paper gives a reason why it holds.
- Also stated in: § In-cell mRNA stability is a major predictor of total protein output · plain
What the paper did — it cites no source for this, so there is none to check. The quote shows it is in the paper.
In the paper
“We present a massively parallel reporter assay termed Pooled Evaluation of mRNA in-solution Stability, and In-cell Stability and Translation RNA-seq (PERSIST-seq), which enables systematic determination of the effects of UTR, codon choice and RNA structure on mRNA translation rates in human cells and on mRNA stability, both in cells and in solution.”
§ Combinatorial optimization of mRNA structure, stability, and translation for RNA-based therapeutics > INTRODUCTION
plaincorrelational- Asserted: passes — The authors put it forward as true.
- Checkable: passes — It can be checked against evidence.
- Load-bearing: passes — The paper’s conclusions depend on it.
- Based: passes — The paper gives a reason why it holds.
A conclusion the paper draws from its own results — it cites no other source for it, so there is none to check. The quote shows it is in the paper.
In the paper
“We find that, surprisingly, in-cell stability is a greater driver of protein output than high ribosome load.”
- Also stated in: § In-cell mRNA stability is a major predictor of total protein output · boosted
“Taken together, our large-scale and unbiased pooled measurement of translation and mRNA stability provides a simple but powerful platform to test large numbers of different mRNA sequence designs for desired protein expression and has allowed us to importantly infer that in-cell mRNA stability is the dominant predictor of total protein output (Fig. 2C,E).”
§ Combinatorial optimization of mRNA structure, stability, and translation for RNA-based therapeutics > Abstract
boosteddirect- Asserted: passes — The authors put it forward as true.
- Checkable: passes — It can be checked against evidence.
- Load-bearing: passes — The paper’s conclusions depend on it.
- Based: passes — The paper gives a reason why it holds.
- The authors state this as an assumption: Translation follows first-order kinetics and mRNA and protein decay are exponential.
- Also stated in: § In-cell mRNA stability is a major predictor of total protein output · boosted
A conclusion the paper draws from its own results — it cites no other source for it, so there is none to check. The quote shows it is in the paper.
In the paper
“These data suggested strong potential for using different 5’ UTRs to tune translational efficiency of target mRNAs – more than for any other region (3’ UTR or CDS).”
§ Combinatorial optimization of mRNA structure, stability, and translation for RNA-based therapeutics > RESULTS > High dynamic range of translation driven by UTRs
hedgedconditional- Asserted: passes — The authors put it forward as true.
- Checkable: passes — It can be checked against evidence.
- Load-bearing: passes — The paper’s conclusions depend on it.
- Based: passes — The paper gives a reason why it holds.
A conclusion the paper draws from its own results — it cites no other source for it, so there is none to check. The quote shows it is in the paper.
In the paper
“This represents the first large-scale screen of mRNA redesigned across its entire length.”
§ Combinatorial optimization of mRNA structure, stability, and translation for RNA-based therapeutics > INTRODUCTION
plain- Asserted: passes — The authors put it forward as true.
- Checkable: passes — It can be checked against evidence.
- Load-bearing: unclear — It is unclear whether the paper’s conclusions depend on it.
- Based: passes — The paper gives a reason why it holds.
A conclusion the paper draws from its own results — it cites no other source for it, so there is none to check. The quote shows it is in the paper.
In the paper
“Together, the combination of optimized UTRs for expression, DegScore-optimized CDS structure, and ψ modification provides a general technology that can be applied to stabilize and increase protein expression of candidate mRNA therapeutics.”
§ Combinatorial optimization of mRNA structure, stability, and translation for RNA-based therapeutics > INTRODUCTION
plaindirect- Asserted: passes — The authors put it forward as true.
- Checkable: passes — It can be checked against evidence.
- Load-bearing: passes — The paper’s conclusions depend on it.
- Based: passes — The paper gives a reason why it holds.
A conclusion the paper draws from its own results — it cites no other source for it, so there is none to check. The quote shows it is in the paper.
In the paper
“This model enables identification of optimal mRNA designs without the need to individually test all mRNAs for protein output.”
§ Combinatorial optimization of mRNA structure, stability, and translation for RNA-based therapeutics > INTRODUCTION
plaindirect- Asserted: passes — The authors put it forward as true.
- Checkable: passes — It can be checked against evidence.
- Load-bearing: passes — The paper’s conclusions depend on it.
- Based: passes — The paper gives a reason why it holds.
- The authors state this as an assumption: Translation follows first-order kinetics and mRNA and protein decay are exponential.
A conclusion the paper draws from its own results — it cites no other source for it, so there is none to check. The quote shows it is in the paper.
In the paper
“This finding is consistent with faster mRNA decay compared to hHBB UTRs and our results supporting that in-cell mRNA stability is a primary driver of protein output (Fig. 2C, E).”
- Also stated in: § One-by-one tests confirm additivity of UTR, CDS, and ψ improvements · boosted
“Overall, these results demonstrated the importance of mRNA stability to protein output”
§ Combinatorial optimization of mRNA structure, stability, and translation for RNA-based therapeutics > RESULTS > One-by-one tests confirm additivity of UTR, CDS, and ψ improvements
boosteddirect- Asserted: passes — The authors put it forward as true.
- Checkable: passes — It can be checked against evidence.
- Load-bearing: passes — The paper’s conclusions depend on it.
- Based: passes — The paper gives a reason why it holds.
- Also stated in: § One-by-one tests confirm additivity of UTR, CDS, and ψ improvements · boosted
A conclusion the paper draws from its own results — it cites no other source for it, so there is none to check. The quote shows it is in the paper.
In the paper
“However, for short expression (early time points after mRNA transfection) or for “above-threshold” protein half-lives, translation can become the dominant predictor.”
§ Combinatorial optimization of mRNA structure, stability, and translation for RNA-based therapeutics > RESULTS > In-cell mRNA stability is a major predictor of total protein output
plainconditional- Asserted: passes — The authors put it forward as true.
- Checkable: passes — It can be checked against evidence.
- Load-bearing: passes — The paper’s conclusions depend on it.
- Based: passes — The paper gives a reason why it holds.
- The authors state this as an assumption: Translation follows first-order kinetics and mRNA and protein decay are exponential.
A conclusion the paper draws from its own results — it cites no other source for it, so there is none to check. The quote shows it is in the paper.
In the paper
“Moreover, downstream luciferase expression can be further amplified by ψ modification of mRNAs.”
§ Combinatorial optimization of mRNA structure, stability, and translation for RNA-based therapeutics > RESULTS > Integration of all design rules leads to mRNAs with both high in-solution stability and high protein output
plaindirect- Asserted: passes — The authors put it forward as true.
- Checkable: passes — It can be checked against evidence.
- Load-bearing: passes — The paper’s conclusions depend on it.
- Based: passes — The paper gives a reason why it holds.
A conclusion the paper draws from its own results — it cites no other source for it, so there is none to check. The quote shows it is in the paper.
In the paper
“Taken together, our detailed studies on individual mRNAs (Fig. 4) indicate that combining UTRs that facilitate high levels of translation alongside structural optimization of CDSs via LinearDesign and DegScore-guided RiboTree design, we can enhance both in-solution stability and total in-cell protein output of mRNAs.”
§ Combinatorial optimization of mRNA structure, stability, and translation for RNA-based therapeutics > RESULTS > Integration of all design rules leads to mRNAs with both high in-solution stability and high protein output
hedgeddirectSingle case- Asserted: passes — The authors put it forward as true.
- Checkable: passes — It can be checked against evidence.
- Load-bearing: passes — The paper’s conclusions depend on it.
- Based: passes — The paper gives a reason why it holds.
A conclusion the paper draws from its own results — it cites no other source for it, so there is none to check. The quote shows it is in the paper.
In the paper
“For instance, longer or more branched double-stranded RNA stems may potentially hinder the ability of the ribosome to unwind RNA secondary structure.”
§ Combinatorial optimization of mRNA structure, stability, and translation for RNA-based therapeutics > RESULTS > Integration of all design rules leads to mRNAs with both high in-solution stability and high protein output
hedgedconditional- Asserted: passes — The authors put it forward as true.
- Checkable: passes — It can be checked against evidence.
- Load-bearing: passes — The paper’s conclusions depend on it.
- Based: passes — The paper gives a reason why it holds.
A conclusion the paper draws from its own results — it cites no other source for it, so there is none to check. The quote shows it is in the paper.
In the paper
“This finding indicated that beyond redesigning RNA sequences to take on stable structure, in-solution RNA stability can be significantly further improved by incorporating modified U nucleosides.”
§ Combinatorial optimization of mRNA structure, stability, and translation for RNA-based therapeutics > RESULTS > Pseudouridine stabilizes RNA in solution
hedgeddirect- Asserted: passes — The authors put it forward as true.
- Checkable: passes — It can be checked against evidence.
- Load-bearing: passes — The paper’s conclusions depend on it.
- Based: passes — The paper gives a reason why it holds.
A conclusion the paper draws from its own results — it cites no other source for it, so there is none to check. The quote shows it is in the paper.
In the paper
“There does not have to be a tradeoff between mRNA structure, stability, and protein output.”
§ Combinatorial optimization of mRNA structure, stability, and translation for RNA-based therapeutics > DISCUSSION
plain- Asserted: passes — The authors put it forward as true.
- Checkable: passes — It can be checked against evidence.
- Load-bearing: passes — The paper’s conclusions depend on it.
- Based: passes — The paper gives a reason why it holds.
A conclusion the paper draws from its own results — it cites no other source for it, so there is none to check. The quote shows it is in the paper.
In the paper
“The predicted and measured luciferase activities showed a correlation of r = 0.71 (Fig. 2F), supporting the accuracy of our model.”
§ Combinatorial optimization of mRNA structure, stability, and translation for RNA-based therapeutics > RESULTS > In-cell mRNA stability is a major predictor of total protein output
plaincorrelational- Asserted: passes — The authors put it forward as true.
- Checkable: passes — It can be checked against evidence.
- Load-bearing: passes — The paper’s conclusions depend on it.
- Based: passes — The paper gives a reason why it holds.
- The authors state this as an assumption: Translation follows first-order kinetics and mRNA and protein decay are exponential.
A conclusion the paper draws from its own results — it cites no other source for it, so there is none to check. The quote shows it is in the paper.
In the paper
“Overall, predicted protein expression per mole of transfected mRNA is modeled to be mostly driven by the in-cell mRNA half-life (Fig. 2C, top panel), which more closely trends with predicted protein expression (Fig. 2E) than ribosome load does (Fig. 2C, lower panel).”
§ Combinatorial optimization of mRNA structure, stability, and translation for RNA-based therapeutics > RESULTS > In-cell mRNA stability is a major predictor of total protein output
plaindirect- Asserted: passes — The authors put it forward as true.
- Checkable: passes — It can be checked against evidence.
- Load-bearing: passes — The paper’s conclusions depend on it.
- Based: passes — The paper gives a reason why it holds.
- The authors state this as an assumption: Translation follows first-order kinetics and mRNA and protein decay are exponential.
A conclusion the paper draws from its own results — it cites no other source for it, so there is none to check. The quote shows it is in the paper.
In the paper
“Stated differently, increased polysome load appears counterproductive to the goal of maximizing the total amount of protein expressed over time.”
§ Combinatorial optimization of mRNA structure, stability, and translation for RNA-based therapeutics > RESULTS > In-cell mRNA stability is a major predictor of total protein output
hedgeddirect- Asserted: passes — The authors put it forward as true.
- Checkable: passes — It can be checked against evidence.
- Load-bearing: passes — The paper’s conclusions depend on it.
- Based: passes — The paper gives a reason why it holds.
A conclusion the paper draws from its own results — it cites no other source for it, so there is none to check. The quote shows it is in the paper.
In the paper
“which enables in silico optimization of any RNA sequence”
§ Combinatorial optimization of mRNA structure, stability, and translation for RNA-based therapeutics > DISCUSSION
plaindirect- Asserted: passes — The authors put it forward as true.
- Checkable: passes — It can be checked against evidence.
- Load-bearing: passes — The paper’s conclusions depend on it.
- Based: passes — The paper gives a reason why it holds.
What the paper did — it cites no source for this, so there is none to check. The quote shows it is in the paper.
In the paper
“DegScore, a model for hydrolytic degradation that was independently validated on PERSIST-seq data”
§ Combinatorial optimization of mRNA structure, stability, and translation for RNA-based therapeutics > DISCUSSION
plain- Asserted: passes — The authors put it forward as true.
- Checkable: passes — It can be checked against evidence.
- Load-bearing: passes — The paper’s conclusions depend on it.
- Based: passes — The paper gives a reason why it holds.
What the paper did — it cites no source for this, so there is none to check. The quote shows it is in the paper.
In the paper
“our study has focused on characterizing degradation of naked, non-formulated mRNAs”
§ Combinatorial optimization of mRNA structure, stability, and translation for RNA-based therapeutics > DISCUSSION
plain- Asserted: passes — The authors put it forward as true.
- Checkable: passes — It can be checked against evidence.
- Load-bearing: passes — The paper’s conclusions depend on it.
- Based: passes — The paper gives a reason why it holds.
A conclusion the paper draws from its own results — it cites no other source for it, so there is none to check. The quote shows it is in the paper.
In the paper
“we report a new mRNA design methodology that can dramatically enhance mRNA stability in aqueous solution”
§ Combinatorial optimization of mRNA structure, stability, and translation for RNA-based therapeutics > DISCUSSION
plaindirect- Asserted: passes — The authors put it forward as true.
- Checkable: passes — It can be checked against evidence.
- Load-bearing: passes — The paper’s conclusions depend on it.
- Based: passes — The paper gives a reason why it holds.
A conclusion the paper draws from its own results — it cites no other source for it, so there is none to check. The quote shows it is in the paper.
In the paper
“we report a new mRNA design methodology that can dramatically enhance mRNA stability in aqueous solution while sustaining or even increasing protein expression inside cells”
§ Combinatorial optimization of mRNA structure, stability, and translation for RNA-based therapeutics > DISCUSSION
plaindirect- Asserted: passes — The authors put it forward as true.
- Checkable: passes — It can be checked against evidence.
- Load-bearing: passes — The paper’s conclusions depend on it.
- Based: passes — The paper gives a reason why it holds.
A conclusion the paper draws from its own results — it cites no other source for it, so there is none to check. The quote shows it is in the paper.
In the paper
“Therefore, depending on the desired parameters (early burst of high protein expression or total protein output integrated over a longer time), the most optimal set of UTRs can vary.”
§ Combinatorial optimization of mRNA structure, stability, and translation for RNA-based therapeutics > RESULTS > In-cell mRNA stability is a major predictor of total protein output
plainconditional- Asserted: passes — The authors put it forward as true.
- Checkable: passes — It can be checked against evidence.
- Load-bearing: passes — The paper’s conclusions depend on it.
- Based: passes — The paper gives a reason why it holds.
- The authors state this as an assumption: Translation follows first-order kinetics and mRNA and protein decay are exponential.
A conclusion the paper draws from its own results — it cites no other source for it, so there is none to check. The quote shows it is in the paper.
In the paper
“The result was nevertheless consistent with our model that enhanced in-cell half-life of a structured mRNA can compensate for low translation efficiency (Fig. 2C–E).”
§ Combinatorial optimization of mRNA structure, stability, and translation for RNA-based therapeutics > RESULTS > One-by-one tests confirm additivity of UTR, CDS, and ψ improvements
plainconditional- Asserted: passes — The authors put it forward as true.
- Checkable: passes — It can be checked against evidence.
- Load-bearing: passes — The paper’s conclusions depend on it.
- Based: passes — The paper gives a reason why it holds.
A conclusion the paper draws from its own results — it cites no other source for it, so there is none to check. The quote shows it is in the paper.
In the paper
“Overall, the global assessment of in-solution RNA degradation using PERSIST-Seq reveals pronounced effects of RNA length and structure on RNA half-life in solution.”
§ Combinatorial optimization of mRNA structure, stability, and translation for RNA-based therapeutics > RESULTS > mRNA length and structure drive in-solution mRNA stability
plaincorrelational- Asserted: passes — The authors put it forward as true.
- Checkable: passes — It can be checked against evidence.
- Load-bearing: passes — The paper’s conclusions depend on it.
- Based: passes — The paper gives a reason why it holds.
- The authors state this as an assumption: The high pH buffer containing Mg2+ mimics the high effective pH and positively charged environment that can arise in lipid nanoparticles, protamine, and other formulations for mRNA therapeutics.
A conclusion the paper draws from its own results — it cites no other source for it, so there is none to check. The quote shows it is in the paper.
In the paper
“These modifications are consistent with mitigating hydrolysis as modeled in the DegScore predictor (Fig. 3D).”
§ Combinatorial optimization of mRNA structure, stability, and translation for RNA-based therapeutics > RESULTS > Integration of all design rules leads to mRNAs with both high in-solution stability and high protein output
plaincorrelational- Asserted: passes — The authors put it forward as true.
- Checkable: passes — It can be checked against evidence.
- Load-bearing: passes — The paper’s conclusions depend on it.
- Based: passes — The paper gives a reason why it holds.
What the paper did — it cites no source for this, so there is none to check. The quote shows it is in the paper.
In the paper
“We matched the accelerated degradation conditions used for PERSIST-seq in-solution stability measurements, but also verified that measurements without Mg2+, at lower pH, and higher temperature gave strongly correlated results (Fig. S4A).”
§ Combinatorial optimization of mRNA structure, stability, and translation for RNA-based therapeutics > RESULTS > Eterna-guided In-line-seq yields additional design principles and DegScore predictor
boostedcorrelational- Asserted: passes — The authors put it forward as true.
- Checkable: passes — It can be checked against evidence.
- Load-bearing: unclear — It is unclear whether the paper’s conclusions depend on it.
- Based: passes — The paper gives a reason why it holds.
A conclusion the paper draws from its own results — it cites no other source for it, so there is none to check. The quote shows it is in the paper.
In the paper
“Importantly, these findings identify an unexpected rule for the design of mRNA – excessively increasing translation efficiency may negatively impact mRNA stability.”
§ Combinatorial optimization of mRNA structure, stability, and translation for RNA-based therapeutics > RESULTS > In-cell mRNA stability is a major predictor of total protein output
hedgedconditional- Asserted: passes — The authors put it forward as true.
- Checkable: passes — It can be checked against evidence.
- Load-bearing: passes — The paper’s conclusions depend on it.
- Based: passes — The paper gives a reason why it holds.
A conclusion the paper draws from its own results — it cites no other source for it, so there is none to check. The quote shows it is in the paper.
In the paper
“indicating that, despite ψ modification and highly structured CDSs, translation is sustained.”
§ Combinatorial optimization of mRNA structure, stability, and translation for RNA-based therapeutics > RESULTS > One-by-one tests confirm additivity of UTR, CDS, and ψ improvements
hedged- Asserted: passes — The authors put it forward as true.
- Checkable: passes — It can be checked against evidence.
- Load-bearing: passes — The paper’s conclusions depend on it.
- Based: passes — The paper gives a reason why it holds.
A conclusion the paper draws from its own results — it cites no other source for it, so there is none to check. The quote shows it is in the paper.
In the paper
“This simultaneous increase in in-solution stability with improved and sustained in-cell protein expression provided a strong demonstration of the impact of our design rules for mRNA.”
§ Combinatorial optimization of mRNA structure, stability, and translation for RNA-based therapeutics > RESULTS > Integration of all design rules leads to mRNAs with both high in-solution stability and high protein output
boosteddirectSingle case- Asserted: passes — The authors put it forward as true.
- Checkable: passes — It can be checked against evidence.
- Load-bearing: passes — The paper’s conclusions depend on it.
- Based: passes — The paper gives a reason why it holds.
A conclusion the paper draws from its own results — it cites no other source for it, so there is none to check. The quote shows it is in the paper.
In the paper
“Taken together, these data suggest that by reducing the overall presence of Us in loops and reducing the number of hairpins to generate a “linear” highly double-stranded mRNA can lead to enhanced mRNA stability and protein expression.”
§ Combinatorial optimization of mRNA structure, stability, and translation for RNA-based therapeutics > RESULTS > Integration of all design rules leads to mRNAs with both high in-solution stability and high protein output
hedgeddirectSingle case- Asserted: passes — The authors put it forward as true.
- Checkable: passes — It can be checked against evidence.
- Load-bearing: passes — The paper’s conclusions depend on it.
- Based: passes — The paper gives a reason why it holds.
A conclusion the paper draws from its own results — it cites no other source for it, so there is none to check. The quote shows it is in the paper.
In the paper
“the suppression of in-line hydrolysis appears to be due to local chemical or structural effects.”
§ Combinatorial optimization of mRNA structure, stability, and translation for RNA-based therapeutics > RESULTS > Pseudouridine stabilizes RNA in solution
hedgedconditional- Asserted: passes — The authors put it forward as true.
- Checkable: passes — It can be checked against evidence.
- Load-bearing: passes — The paper’s conclusions depend on it.
- Based: passes — The paper gives a reason why it holds.
- It may state two separate claims as one. 22
- Probably not a substantial claim. 15
- The quote only partly states this claim. 1
The cited sources support only part of this claim — read each source’s verdict below.
In the paper
“mRNA vaccines still suffer from decreased efficacy due to poor RNA stability in solution and in vivo and to limited expression of the payload mRNA; these are all pivotal issues that need to be carefully optimized for preclinical and clinical applications3–6.”
§ Combinatorial optimization of mRNA structure, stability, and translation for RNA-based therapeutics > INTRODUCTION
What the sources say
- Partly supportedcites [3] Sahin, U., Karikó, K. & Türeci, Ö. mRNA-based therapeutics-developing a new class of drugs. Nat. Rev. Drug Discov. 13, 759–780 (2014). sourceExperimental — accuracy not yet measured
The sections on improving mRNA delivery and on translation and stability describe extracellular degradation, intracellular stability, and achieving sufficient expression of the encoded protein as challenges. But Box 4 says RNA is stable in RNase-free environments, while the Conclusions say mRNA instability has been efficiently addressed. The paper therefore does not support a blanket claim that poor stability in solution and in vivo still reduces vaccine efficacy. (LLM, conf=0.88)
- Partly supportedcites [4] Jackson, N. A. C., Kester, K. E., Casimiro, D., Gurunathan, S. & DeRosa, F. The promise of mRNA vaccines: a biotech and industrial perspective. npj Vaccines 5, 11 (2020). sourceExperimental — accuracy not yet measured
The “State-of-the-art” section says mRNA is susceptible to degradation during delivery and that construct quality affects expression. “Perspective #1” links improved stability and expression to greater antigen production and potential potency. The cited paper does not specifically establish poor stability in solution as a cause of decreased vaccine efficacy. (LLM, conf=0.84)
- Not checked — no full text of the sourcecites [5] Weng, Y. et al. The challenge and prospect of mRNA therapeutics landscape. Biotechnol. Adv. 40, 107534 (2020). source
- Partly supportedcites [6] Crommelin, D. J. A., Anchordoquy, T. J., Volkin, D. B., Jiskoot, W. & Mastrobattista, E. Addressing the cold reality of mRNA vaccine stability. J. Pharm. Sci. 110, 997–1001 (2021). sourceExperimental — accuracy not yet measured
The Historical Perspective section (page unavailable) says mRNA degradation can reduce vaccine potency by slowing translation and limiting antigen expression; it also discusses degradation in solution. The Concluding Considerations section (page unavailable) links in vivo delivery and antigen production to immunogenicity, but our copy does not establish poor RNA stability in vivo as a cause of decreased vaccine efficacy. (LLM, conf=0.82)
plaindirect- Asserted: passes — The authors put it forward as true.
- Checkable: passes — It can be checked against evidence.
- Load-bearing: passes — The paper’s conclusions depend on it.
- Based: passes — The paper gives a reason why it holds.
It may state two separate claims as one.
- Partly supported
The cited sources support only part of this claim — read each source’s verdict below.
In the paper
“In particular, RNA is inherently unstable due its 2’-hydroxyl group, and degradation of the mRNA in solution by in-line nucleophilic attack, potentially aggravated by formulations, poses a major challenge6.”
§ Combinatorial optimization of mRNA structure, stability, and translation for RNA-based therapeutics > DISCUSSION
What the sources say
- Partly supportedcites [6] Crommelin, D. J. A., Anchordoquy, T. J., Volkin, D. B., Jiskoot, W. & Mastrobattista, E. Addressing the cold reality of mRNA vaccine stability. J. Pharm. Sci. 110, 997–1001 (2021). sourceExperimental — accuracy not yet measured
The Historical Perspective section (page not provided) describes mRNA degradation in solution, including phosphodiester-bond hydrolysis, and says cationic lipid formulations may increase cleavage rates. The Concluding Considerations section treats stability as a major formulation challenge. Our copy does not identify the 2′-hydroxyl group or in-line nucleophilic attack as the mechanism, so those specific parts are not supported. (LLM, conf=0.86)
plaindirect- Asserted: passes — The authors put it forward as true.
- Checkable: passes — It can be checked against evidence.
- Load-bearing: passes — The paper’s conclusions depend on it.
- Based: passes — The paper gives a reason why it holds.
It may state two separate claims as one.
- Partly supported
The cited sources support only part of this claim — read each source’s verdict below.
In the paper
“In particular, we focused on ψ and m1ψ, since these substitutions for U have been widely adopted for mRNA therapeutics and vaccines due to improved in-cell translation and to better control of innate immune responses2,3,8,67 through avoidance of recognition by cellular toll-like receptors (TLR7 and TLR8)68, RIG‑I, and PKR69–71.”
§ Combinatorial optimization of mRNA structure, stability, and translation for RNA-based therapeutics > RESULTS > Pseudouridine stabilizes RNA in solution
What the sources say
- Partly supportedcites [2] Pardi, N., Hogan, M. J., Porter, F. W. & Weissman, D. mRNA vaccines - a new era in vaccinology. Nat. Rev. Drug Discov. 17, 261–279 (2018). sourceExperimental — accuracy not yet measured
The 'Modulation of immunogenicity' section (page unavailable) says pseudouridine and 1-methylpseudouridine reduce innate immune sensing and that nucleoside-modified mRNA improves translation. It links these advances to interest in vaccines and protein-replacement therapies, but does not establish that both substitutions were widely adopted for those uses; the vaccine section describes the platform as novel. (LLM, conf=0.86)
- Partly supportedcites [3] Sahin, U., Karikó, K. & Türeci, Ö. mRNA-based therapeutics-developing a new class of drugs. Nat. Rev. Drug Discov. 13, 759–780 (2014). sourceExperimental — accuracy not yet measured
Box 1 reports that pseudouridine-modified mRNA can improve translation and reduce innate immune activation, including activation of TLR7 and TLR8. It does not identify m1ψ or establish that both substitutions were widely adopted for mRNA therapeutics and vaccines. No page number is available in our copy. (LLM, conf=0.87)
- Partly supportedcites [8] Mauger, D. M. et al. mRNA structure regulates protein expression through changes in functional half-life. Proc. Natl Acad. Sci. USA 116, 24075–24083 (2019). sourceExperimental — accuracy not yet measured
The Methods (mRNA Preparation) identify Ψ and m1Ψ as substitutions for U. The Results (RNA Sequence and Nucleotide Modifications Combine to Determine Protein Expression) report increased cell expression with m1Ψ and describe m1Ψ as having reduced immunogenicity. They do not establish improved translation for Ψ or widespread adoption of both substitutions in therapeutics and vaccines. The TLR, RIG-I, and PKR mechanism is attached to other citations in the citing sentence. (LLM, conf=0.85)
- Could not verifycites [67] Lorenz, R. et al. ViennaRNA Package 2.0. Algorithms Mol. Biol. 6, 26 (2011). sourceExperimental — accuracy not yet measured
The Background section discusses computational RNA folding and RNA–RNA interactions, not the use of ψ or m1ψ in mRNA therapeutics or vaccines. Searches for those substitutions, in-cell translation, and innate immune receptors found no passage addressing the attributed claim. (LLM, conf=0.76)
- Could not verifycites [68] Diedenhofen, B. & Musch, J. cocor: a comprehensive solution for the statistical comparison of correlations. PLoS ONE 10, e0121945 (2015). sourceExperimental — accuracy not yet measured
The Introduction and Code Examples discuss statistical tests for comparing correlations, not mRNA therapeutics or vaccines. The supplied passages do not address ψ or m1ψ substitutions, translation, or innate immune responses, so our copy provides no evidence for the attributed claim. (LLM, conf=0.78)
- Partly supportedcites [69] Karikó, K. et al. Incorporation of pseudouridine into mRNA yields superior nonimmunogenic vector with increased translational capacity and biological stability. Mol. Ther. 16, 1833–1840 (2008). sourceExperimental — accuracy not yet measured
The Results section reports that Ψ-containing mRNA translated more efficiently than unmodified mRNA in cultured cells, and the Discussion reports diminished immunogenicity in vivo and potential therapeutic and vaccine uses. The paper does not establish that Ψ or m1ψ had been widely adopted, and it does not report results for m1ψ. No page numbers are available in our copy. (LLM, conf=0.88)
- Not checked — no full text of the sourcecites [70] Karikó, K., Buckstein, M., Ni, H. & Weissman, D. Suppression of RNA recognition by Toll-like receptors: the impact of nucleoside modification and the evolutionary origin of RNA. Immunity 23, 165–175 (2005). source
- Not checked — no full text of the sourcecites [71] Hornung, V. et al. 5′-Triphosphate RNA is the ligand for RIG-I. Science 314, 994–997 (2006). source
plaindirect- Asserted: passes — The authors put it forward as true.
- Checkable: passes — It can be checked against evidence.
- Load-bearing: passes — The paper’s conclusions depend on it.
- Based: passes — The paper gives a reason why it holds.
It may state two separate claims as one.
- Partly supported
The cited sources that could be checked couldn’t confirm or dispute this claim.
In the paper
“While ψ and derivatives have been reported to stabilize mRNAs against decay in cells67, the effects of these modifications on mRNA stability in solution have not been reported.”
§ Combinatorial optimization of mRNA structure, stability, and translation for RNA-based therapeutics > RESULTS > Pseudouridine stabilizes RNA in solution
What the sources say
- Could not verifycites [67] Lorenz, R. et al. ViennaRNA Package 2.0. Algorithms Mol. Biol. 6, 26 (2011). sourceExperimental — accuracy not yet measured
The Background section on RNA–RNA interactions discusses structure prediction and binding energies, not whether pseudouridine (ψ) or its derivatives protect mRNA from decay in cells. Searches for pseudouridine, modified nucleotides, and cellular mRNA decay found no passage addressing that claim; references to RNA stability concern secondary structure. (LLM, conf=0.76)
plaindirect- Asserted: passes — The authors put it forward as true.
- Checkable: passes — It can be checked against evidence.
- Load-bearing: fails — The paper’s conclusions may not depend on it.
- Based: passes — The paper gives a reason why it holds.
Probably not a substantial claim. The paper’s conclusions may not depend on it.
- Could not verify
The cited sources that could be checked couldn’t confirm or dispute this claim.
In the paper
“such non-formulated mRNAs also appear optimal for certain applications including personalized cancer mRNA vaccines81”
§ Combinatorial optimization of mRNA structure, stability, and translation for RNA-based therapeutics > DISCUSSION
What the sources say
- Could not verifycites [81] Hu, B., Guo, H., Zhou, P. & Shi, Z.-L. Characteristics of SARS-CoV-2 and COVID-19. Nat. Rev. Microbiol. 19, 141–154 (2020). sourceExperimental — accuracy not yet measured
The Vaccines section discusses lipid nanoparticle-formulated mRNA vaccines against SARS-CoV-2, not non-formulated mRNAs or personalized cancer vaccines. Searches for those terms found no passage addressing whether non-formulated mRNAs are optimal for that application. (LLM, conf=0.76)
hedgedcorrelational- Asserted: passes — The authors put it forward as true.
- Checkable: passes — It can be checked against evidence.
- Load-bearing: fails — The paper’s conclusions may not depend on it.
- Based: passes — The paper gives a reason why it holds.
Probably not a substantial claim. The paper’s conclusions may not depend on it.
- Could not verify
A result the paper reports from its own data — it cites no other source for it, so there is none to check. The quote shows it is in the paper.
In the paper
“Nucleotide-resolution data on thousands of small, structured model RNAs from the Eterna platform revealed novel design rules for reducing solution hydrolysis and enabled development of a regression model termed DegScore that enables in silico RNA sequence optimization for enhanced in-solution stability.”
§ Combinatorial optimization of mRNA structure, stability, and translation for RNA-based therapeutics > INTRODUCTION
plaindirect- Asserted: passes — The authors put it forward as true.
- Checkable: passes — It can be checked against evidence.
- Load-bearing: passes — The paper’s conclusions depend on it.
- Based: passes — The paper gives a reason why it holds.
It may state two separate claims as one.
A result the paper reports from its own data — it cites no other source for it, so there is none to check. The quote shows it is in the paper.
In the paper
“Deleting the full 5’ half (dSL1–3) or the 3’ half (dSL4–5) of the 5’ UTR overall increased ribosome load.”
§ Combinatorial optimization of mRNA structure, stability, and translation for RNA-based therapeutics > RESULTS > High dynamic range of translation driven by UTRs
plaindirect- Asserted: passes — The authors put it forward as true.
- Checkable: passes — It can be checked against evidence.
- Load-bearing: passes — The paper’s conclusions depend on it.
- Based: passes — The paper gives a reason why it holds.
It may state two separate claims as one.
A result the paper reports from its own data — it cites no other source for it, so there is none to check. The quote shows it is in the paper.
In the paper
“These effects included significant depletion of 5’ UTRs that contain out-of-frame AUG start codons relative to the main ORF and enrichments of short stem-loop motifs promoting translation (Fig. S2F).”
§ Combinatorial optimization of mRNA structure, stability, and translation for RNA-based therapeutics > RESULTS > High dynamic range of translation driven by UTRs
plaincorrelational- Asserted: passes — The authors put it forward as true.
- Checkable: passes — It can be checked against evidence.
- Load-bearing: passes — The paper’s conclusions depend on it.
- Based: passes — The paper gives a reason why it holds.
It may state two separate claims as one.
A result the paper reports from its own data — it cites no other source for it, so there is none to check. The quote shows it is in the paper.
In the paper
“The dengue virus 5’ and 3’ UTRs both individually increase ribosome loading, and combining them into one mRNA resulted in an additive effect (Fig. 1E, Table S1).”
§ Combinatorial optimization of mRNA structure, stability, and translation for RNA-based therapeutics > RESULTS > High dynamic range of translation driven by UTRs
plaindirect- Asserted: passes — The authors put it forward as true.
- Checkable: passes — It can be checked against evidence.
- Load-bearing: passes — The paper’s conclusions depend on it.
- Based: passes — The paper gives a reason why it holds.
It may state two separate claims as one.
A result the paper reports from its own data — it cites no other source for it, so there is none to check. The quote shows it is in the paper.
In the paper
“Indeed, the ratio of these half-lives, 3.0±0.7, matched within error the inverse ratio of the lengths of the mRNA regions captured by RT-PCR (958 nt/250 nt = 3.8), supporting theoretical predictions of length effects.”
§ Combinatorial optimization of mRNA structure, stability, and translation for RNA-based therapeutics > RESULTS > mRNA length and structure drive in-solution mRNA stability
plaincorrelational- Asserted: passes — The authors put it forward as true.
- Checkable: passes — It can be checked against evidence.
- Load-bearing: passes — The paper’s conclusions depend on it.
- Based: passes — The paper gives a reason why it holds.
It may state two separate claims as one.
- The authors state this as an assumption: The high pH buffer containing Mg2+ mimics the high effective pH and positively charged environment that can arise in lipid nanoparticles, protamine, and other formulations for mRNA therapeutics.
A result the paper reports from its own data — it cites no other source for it, so there is none to check. The quote shows it is in the paper.
In the paper
“Overall, we observed a wide range of UTR-dependent translation efficiencies in PERSIST-seq which could be further fine-tuned with specific UTR sequence or CDS structure alterations.”
§ Combinatorial optimization of mRNA structure, stability, and translation for RNA-based therapeutics > DISCUSSION
hedgedconditional- Asserted: passes — The authors put it forward as true.
- Checkable: passes — It can be checked against evidence.
- Load-bearing: passes — The paper’s conclusions depend on it.
- Based: passes — The paper gives a reason why it holds.
It may state two separate claims as one.
A result the paper reports from its own data — it cites no other source for it, so there is none to check. The quote shows it is in the paper.
In the paper
“For Nluc-encoding mRNAs, CDS variants were similar in ribosome load or showed a shift towards being less loaded with ribosomes.”
§ Combinatorial optimization of mRNA structure, stability, and translation for RNA-based therapeutics > RESULTS > High dynamic range of translation driven by UTRs
plain- Asserted: passes — The authors put it forward as true.
- Checkable: passes — It can be checked against evidence.
- Load-bearing: unclear — It is unclear whether the paper’s conclusions depend on it.
- Based: passes — The paper gives a reason why it holds.
It may state two separate claims as one.
A result the paper reports from its own data — it cites no other source for it, so there is none to check. The quote shows it is in the paper.
In the paper
“These distinct approaches to normalizing the data gave the same results within estimated error (see below).”
§ Combinatorial optimization of mRNA structure, stability, and translation for RNA-based therapeutics > METHODS > Measurement of in-solution mRNA stability by capillary electrophoresis
hedged- Asserted: passes — The authors put it forward as true.
- Checkable: passes — It can be checked against evidence.
- Load-bearing: fails — The paper’s conclusions may not depend on it.
- Based: passes — The paper gives a reason why it holds.
Probably not a substantial claim. The paper’s conclusions may not depend on it.
- The authors state this as an assumption: The majority of the other RNA in the lane were degradation products from the mRNA of interest.
A result the paper reports from its own data — it cites no other source for it, so there is none to check. The quote shows it is in the paper.
In the paper
“Of these coefficients, G and C were the most favorable (least hydrolysis) to have 3’ of the linkage, followed by A, and a 3’ U was most detrimental to degradation, matching our prior observations.”
§ Combinatorial optimization of mRNA structure, stability, and translation for RNA-based therapeutics > RESULTS > Eterna-guided In-line-seq yields additional design principles and DegScore predictor
plaindirect- Asserted: passes — The authors put it forward as true.
- Checkable: passes — It can be checked against evidence.
- Load-bearing: passes — The paper’s conclusions depend on it.
- Based: passes — The paper gives a reason why it holds.
It may state two separate claims as one.
A conclusion the paper draws from its own results — it cites no other source for it, so there is none to check. The quote shows it is in the paper.
In the paper
“Together, our study demonstrates simultaneous improvement of mRNA stability and protein expression and provides a computational-experimental platform for the enhancement of mRNA medicines.”
§ Combinatorial optimization of mRNA structure, stability, and translation for RNA-based therapeutics > Abstract
boosteddirect- Asserted: passes — The authors put it forward as true.
- Checkable: passes — It can be checked against evidence.
- Load-bearing: passes — The paper’s conclusions depend on it.
- Based: passes — The paper gives a reason why it holds.
It may state two separate claims as one.
A conclusion the paper draws from its own results — it cites no other source for it, so there is none to check. The quote shows it is in the paper.
In the paper
“Our findings show that “superfolder” mRNAs can be designed to improve both stability and expression that are further enhanced through pseudouridine nucleoside modification.”
§ Combinatorial optimization of mRNA structure, stability, and translation for RNA-based therapeutics > Abstract
plaindirect- Asserted: passes — The authors put it forward as true.
- Checkable: passes — It can be checked against evidence.
- Load-bearing: passes — The paper’s conclusions depend on it.
- Based: passes — The paper gives a reason why it holds.
It may state two separate claims as one.
What the paper did — it cites no source for this, so there is none to check. The quote shows it is in the paper.
In the paper
“Normalization was performed using two different methods used to cross-validate.”
§ Combinatorial optimization of mRNA structure, stability, and translation for RNA-based therapeutics > METHODS > Measurement of in-solution mRNA stability by capillary electrophoresis
plain- Asserted: passes — The authors put it forward as true.
- Checkable: passes — It can be checked against evidence.
- Load-bearing: fails — The paper’s conclusions may not depend on it.
- Based: passes — The paper gives a reason why it holds.
Probably not a substantial claim. The paper’s conclusions may not depend on it.
- The authors state this as an assumption: The majority of the other RNA in the lane were degradation products from the mRNA of interest.
A conclusion the paper draws from its own results — it cites no other source for it, so there is none to check. The quote shows it is in the paper.
In the paper
“This is the first massively parallel methodology and large-scale data set applying in-line probing to RNA.”
§ Combinatorial optimization of mRNA structure, stability, and translation for RNA-based therapeutics > RESULTS > Eterna-guided In-line-seq yields additional design principles and DegScore predictor
plain- Asserted: passes — The authors put it forward as true.
- Checkable: passes — It can be checked against evidence.
- Load-bearing: passes — The paper’s conclusions depend on it.
- Based: passes — The paper gives a reason why it holds.
It may state two separate claims as one.
What the paper did — it cites no source for this, so there is none to check. The quote shows it is in the paper.
In the paper
“Because this assay relies on accumulation of luciferase in the cytosol, any signal peptides sequences (Table S1) were removed from the CDS for templates and mRNA for these transfection and luciferase activity experiments.”
§ Combinatorial optimization of mRNA structure, stability, and translation for RNA-based therapeutics > METHODS > Luciferase activity assay after mRNA transfection
plaindirect- Asserted: passes — The authors put it forward as true.
- Checkable: passes — It can be checked against evidence.
- Load-bearing: passes — The paper’s conclusions depend on it.
- Based: passes — The paper gives a reason why it holds.
Probably not a substantial claim.
- Rests on an assumption: The luciferase assay relies on accumulation of luciferase in the cytosol.
What the paper did — it cites no source for this, so there is none to check. The quote shows it is in the paper.
In the paper
“The count matrix was log transformed and normalized column-wise using a linear fit on the dilution series of spike-in constructs in each sample.”
§ Combinatorial optimization of mRNA structure, stability, and translation for RNA-based therapeutics > METHODS > Amplicon sequencing data analysis
plain- Asserted: passes — The authors put it forward as true.
- Checkable: passes — It can be checked against evidence.
- Load-bearing: passes — The paper’s conclusions depend on it.
- Based: passes — The paper gives a reason why it holds.
Probably not a substantial claim.
What the paper did — it cites no source for this, so there is none to check. The quote shows it is in the paper.
In the paper
“Blinding and randomization were not used in any of the experiments.”
§ Combinatorial optimization of mRNA structure, stability, and translation for RNA-based therapeutics > METHODS > Quantification and Statistical Procedures
plain- Asserted: passes — The authors put it forward as true.
- Checkable: passes — It can be checked against evidence.
- Load-bearing: fails — The paper’s conclusions may not depend on it.
- Based: passes — The paper gives a reason why it holds.
Probably not a substantial claim. The paper’s conclusions may not depend on it.
What the paper did — it cites no source for this, so there is none to check. The quote shows it is in the paper.
In the paper
“Amplification of the full-length cDNA product was verified on an agarose gel stained with SYBRSafe (Invitrogen).”
§ Combinatorial optimization of mRNA structure, stability, and translation for RNA-based therapeutics > METHODS > SHAPE and DMS chemical mapping of full-length mRNAs
plain- Asserted: passes — The authors put it forward as true.
- Checkable: passes — It can be checked against evidence.
- Load-bearing: fails — The paper’s conclusions may not depend on it.
- Based: passes — The paper gives a reason why it holds.
Probably not a substantial claim. The paper’s conclusions may not depend on it.
What the paper did — it cites no source for this, so there is none to check. The quote shows it is in the paper.
In the paper
“In all cases, multiple independent experiments were performed on different days to verify the reproducibility of experimental findings.”
§ Combinatorial optimization of mRNA structure, stability, and translation for RNA-based therapeutics > METHODS > Quantification and Statistical Procedures
plain- Asserted: passes — The authors put it forward as true.
- Checkable: passes — It can be checked against evidence.
- Load-bearing: fails — The paper’s conclusions may not depend on it.
- Based: passes — The paper gives a reason why it holds.
Probably not a substantial claim. The paper’s conclusions may not depend on it.
In the paper
“For analysis of sequence and structure motifs, sequences were filtered for low experimental noise and to ensure that the structure predicted in ViennaRNA66 matched the structure inferred through SHAPE mapping data collected at the same time (see Methods); these filters resulted in 2165 sequences and corresponding secondary structures.”
§ Combinatorial optimization of mRNA structure, stability, and translation for RNA-based therapeutics > RESULTS > Eterna-guided In-line-seq yields additional design principles and DegScore predictor
What the sources say
- Not checked — no full text of the sourcecites [66] Regulski, E. E. & Breaker, R. R. In-line probing analysis of riboswitches. Methods Mol. Biol. 419, 53–67 (2008). source
plaindirect- Asserted: passes — The authors put it forward as true.
- Checkable: passes — It can be checked against evidence.
- Load-bearing: passes — The paper’s conclusions depend on it.
- Based: passes — The paper gives a reason why it holds.
Probably not a substantial claim. It may state two separate claims as one.
A conclusion the paper draws from its own results — it cites no other source for it, so there is none to check. The quote shows it is in the paper.
In the paper
“Our study presents advances in tackling both of these challenges, building on two new high-throughput technologies.”
§ Combinatorial optimization of mRNA structure, stability, and translation for RNA-based therapeutics > DISCUSSION
plain- Asserted: passes — The authors put it forward as true.
- Checkable: passes — It can be checked against evidence.
- Load-bearing: passes — The paper’s conclusions depend on it.
- Based: passes — The paper gives a reason why it holds.
It may state two separate claims as one.
- Rests on an assumption: Once delivered into patient cells, the candidate mRNA must outcompete other cytoplasmic mRNAs for the translation machinery and avoid the cellular mRNA degradation machinery to express maximum amounts of the desired encoded protein.
A conclusion the paper draws from its own results — it cites no other source for it, so there is none to check. The quote shows it is in the paper.
In the paper
“Taken together with our results above, these PERSIST-seq measurements indicate that structured CDS regions and a wide variety of 5’ UTR elements from cellular and viral origins can sustain or even improve in-cell translation efficiency compared to reference mRNA sequences.”
§ Combinatorial optimization of mRNA structure, stability, and translation for RNA-based therapeutics > RESULTS > High dynamic range of translation driven by UTRs
hedgedconditional- Asserted: passes — The authors put it forward as true.
- Checkable: passes — It can be checked against evidence.
- Load-bearing: passes — The paper’s conclusions depend on it.
- Based: passes — The paper gives a reason why it holds.
It may state two separate claims as one.
A conclusion the paper draws from its own results — it cites no other source for it, so there is none to check. The quote shows it is in the paper.
In the paper
“for applications with very short mRNAs (as are in use for multi-epitope cancer vaccines, and represented in our MEV sequences80) or much longer mRNAs (as are needed for antigens like the SARS-CoV-2 Spike protein), the best UTRs and the sweet spot for optimal translation efficiency may be different.”
§ Combinatorial optimization of mRNA structure, stability, and translation for RNA-based therapeutics > DISCUSSION
hedgedconditional- Asserted: passes — The authors put it forward as true.
- Checkable: passes — It can be checked against evidence.
- Load-bearing: fails — The paper’s conclusions may not depend on it.
- Based: passes — The paper gives a reason why it holds.
Probably not a substantial claim. The paper’s conclusions may not depend on it.
A conclusion the paper draws from its own results — it cites no other source for it, so there is none to check. The quote shows it is in the paper.
In the paper
“Synthesis of mRNAs with modifications – already in wide use for mitigating innate immune response and translational shutdown by mRNA therapeutics67,68,74,75 – is therefore a simple method to achieve significantly greater in-solution stability while sustaining protein expression.”
§ Combinatorial optimization of mRNA structure, stability, and translation for RNA-based therapeutics > DISCUSSION
plaindirect- Asserted: passes — The authors put it forward as true.
- Checkable: passes — It can be checked against evidence.
- Load-bearing: passes — The paper’s conclusions depend on it.
- Based: passes — The paper gives a reason why it holds.
It may state two separate claims as one.
What the paper did — it cites no source for this, so there is none to check. The quote shows it is in the paper.
In the paper
“DegScore was trained on degradation from unmodified nucleotides that does not account for our observed stabilization via ψ”
§ Combinatorial optimization of mRNA structure, stability, and translation for RNA-based therapeutics > DISCUSSION
plain- Asserted: passes — The authors put it forward as true.
- Checkable: passes — It can be checked against evidence.
- Load-bearing: passes — The paper’s conclusions depend on it.
- Based: passes — The paper gives a reason why it holds.
It may state two separate claims as one.
What the paper did — it cites no source for this, so there is none to check. The quote shows it is in the paper.
In the paper
“our experiments were limited to HEK293T as model human cells”
§ Combinatorial optimization of mRNA structure, stability, and translation for RNA-based therapeutics > DISCUSSION
plain- Asserted: passes — The authors put it forward as true.
- Checkable: passes — It can be checked against evidence.
- Load-bearing: passes — The paper’s conclusions depend on it.
- Based: passes — The paper gives a reason why it holds.
Probably not a substantial claim.
A conclusion the paper draws from its own results — it cites no other source for it, so there is none to check. The quote shows it is in the paper.
In the paper
“the best UTRs for high protein output are likely to be cell-type dependent and therefore will vary from application to application”
§ Combinatorial optimization of mRNA structure, stability, and translation for RNA-based therapeutics > DISCUSSION
hedgedcorrelational- Asserted: passes — The authors put it forward as true.
- Checkable: passes — It can be checked against evidence.
- Load-bearing: passes — The paper’s conclusions depend on it.
- Based: passes — The paper gives a reason why it holds.
It may state two separate claims as one.
A conclusion the paper draws from its own results — it cites no other source for it, so there is none to check. The quote shows it is in the paper.
In the paper
“These results validate and demonstrate a modular and flexible platform that is applicable to potentially any protein target of choice and can accelerate the design of overall improved mRNA therapeutics solutions.”
§ Combinatorial optimization of mRNA structure, stability, and translation for RNA-based therapeutics > RESULTS > Integration of all design rules leads to mRNAs with both high in-solution stability and high protein output
boosteddirect- Asserted: passes — The authors put it forward as true.
- Checkable: passes — It can be checked against evidence.
- Load-bearing: passes — The paper’s conclusions depend on it.
- Based: passes — The paper gives a reason why it holds.
It may state two separate claims as one.
What the paper did — it cites no source for this, so there is none to check. The quote shows it is in the paper.
In the paper
“Subsequently, RNA was purified using Ampure beads + 40% polyethylene glycol 8000 (7:3) and checked again by PAGE-Urea-TBE gel and visualized by SYBR Gold.”
§ Combinatorial optimization of mRNA structure, stability, and translation for RNA-based therapeutics > METHODS > In cell and in-solution RNA degradation time courses
plain- Asserted: passes — The authors put it forward as true.
- Checkable: passes — It can be checked against evidence.
- Load-bearing: fails — The paper’s conclusions may not depend on it.
- Based: passes — The paper gives a reason why it holds.
Probably not a substantial claim. The paper’s conclusions may not depend on it.
What the paper did — it cites no source for this, so there is none to check. The quote shows it is in the paper.
In the paper
“The integrity of each sample was checked by loading 5 μL of total RNA alongside a spike-in control (P4P62HP, 50 ng) onto a PAGE-Urea-TBE gel and visualized by SYBR Gold (Thermo Fisher).”
§ Combinatorial optimization of mRNA structure, stability, and translation for RNA-based therapeutics > METHODS > In cell and in-solution RNA degradation time courses
plain- Asserted: passes — The authors put it forward as true.
- Checkable: passes — It can be checked against evidence.
- Load-bearing: passes — The paper’s conclusions depend on it.
- Based: passes — The paper gives a reason why it holds.
Probably not a substantial claim.
What the paper did — it cites no source for this, so there is none to check. The quote shows it is in the paper.
In the paper
“Each experiment was performed a minimum of three independent times.”
§ Combinatorial optimization of mRNA structure, stability, and translation for RNA-based therapeutics > METHODS > Luciferase activity assay after mRNA transfection
plain- Asserted: passes — The authors put it forward as true.
- Checkable: passes — It can be checked against evidence.
- Load-bearing: passes — The paper’s conclusions depend on it.
- Based: passes — The paper gives a reason why it holds.
Probably not a substantial claim. The quote only partly states this claim.
A conclusion the paper draws from its own results — it cites no other source for it, so there is none to check. The quote shows it is in the paper.
In the paper
“These observations suggest that resistance to RNA hydrolysis, as predicted by DegScore and quantified by in-solution half-life, is important for longer protein expression, but that other RNA sequence and structural features govern protein expression at shorter timescales.”
§ Combinatorial optimization of mRNA structure, stability, and translation for RNA-based therapeutics > RESULTS > Integration of all design rules leads to mRNAs with both high in-solution stability and high protein output
hedgeddirect- Asserted: passes — The authors put it forward as true.
- Checkable: passes — It can be checked against evidence.
- Load-bearing: passes — The paper’s conclusions depend on it.
- Based: passes — The paper gives a reason why it holds.
It may state two separate claims as one.
The authors state this as an assumption.
Nucleotides that are not base paired in structure are uniformly prone to hydrolytic degradation.
“the assumption that nucleotides that are not base paired in structure would be uniformly prone to hydrolytic degradation7.”
The authors state this as an assumption.
Translation follows first-order kinetics and mRNA and protein decay are exponential.
“assuming first-order rate of translation and exponential decay for mRNAs and for proteins.”
The authors state this as an assumption.
The high pH buffer containing Mg2+ mimics the high effective pH and positively charged environment that can arise in lipid nanoparticles, protamine, and other formulations for mRNA therapeutics.
“To mimic the high effective pH and positively charged environment that can arise in lipid nanoparticles, protamine, and other formulations for mRNA therapeutics6, we used a high pH buffer containing Mg2+ to accelerate degradation (10 mM MgCl2, 50 mM Na-CHES, pH 10.0, 24 °C); conditions without Mg2+ or at lower pH lead to similar conclusions on relative stabilities across RNA variants (see below).”
The paper relies on this without support.
The effects of ψ modifications on mRNA stability in solution have not been reported.
“While ψ and derivatives have been reported to stabilize mRNAs against decay in cells67, the effects of these modifications on mRNA stability in solution have not been reported.”
The paper relies on this without support.
High mRNA structure adversely impacts the cellular translational apparatus.
“the expectation that high mRNA structure should adversely impact the cellular translational apparatus.”
The paper relies on this without support.
Once delivered into patient cells, the candidate mRNA must outcompete other cytoplasmic mRNAs for the translation machinery and avoid the cellular mRNA degradation machinery to express maximum amounts of the desired encoded protein.
“Moreover, once delivered into patient cells, the candidate mRNA must outcompete other cytoplasmic mRNAs for the translation machinery and avoid the cellular mRNA degradation machinery to express maximum amounts of the desired encoded protein.”
The authors state this as an assumption.
mRNA translation and mRNA/protein decay follow first-order kinetics.
“To calculated the expected protein levels assuming first order kinetics of mRNA translation and mRNA/protein decay, the following differential equations are used:”
The paper relies on this without support.
The luciferase assay relies on accumulation of luciferase in the cytosol.
“Because this assay relies on accumulation of luciferase in the cytosol, any signal peptides sequences (Table S1) were removed from the CDS for templates and mRNA for these transfection and luciferase activity experiments.”
The authors state this as an assumption.
The majority of the other RNA in the lane were degradation products from the mRNA of interest.
“assuming that the majority of the other RNA in the lane were degradation products from the mRNA of interest”
Claims other papers make about this one
Each is checked against this paper’s own text: does it say what the citing paper says it does?
The source backs part of the claim, not all of it — or backs it for a different population, condition or comparison.
In the citing paper
“which is also consistent with a recent study29 in which LinearDesign-generated sequences with three different UTRs exhibited stronger in vitro protein expression over all benchmark sequences”
From Algorithm for optimized mRNA design improves stability and immunogenicity (2023) · cites this paper as [29]
Experimental — accuracy not yet measuredThe source backs part of the claim, not all of it — or backs it for a different population, condition or comparison.
In the citing paper
“This evidence suggests that LinearDesign is likely to remain effective independent of the choice of UTRs, which is also consistent with a recent study29 in which LinearDesign-generated sequences with three different UTRs exhibited stronger in vitro protein expression over all benchmark sequences”
From Algorithm for optimized mRNA design improves stability and immunogenicity (2023) · cites this paper as [29]
Experimental — accuracy not yet measuredThe source backs part of the claim, not all of it — or backs it for a different population, condition or comparison.
In the citing paper
“LinearDesign had a central role in their work as the starting point of their optimizations (see figure 4b of their paper), followed by fine-tunings by both human players and a Monte Carlo tree search algorithm.”
From Algorithm for optimized mRNA design improves stability and immunogenicity (2023) · cites this paper as [29]
Experimental — accuracy not yet measuredThe source backs part of the claim, not all of it — or backs it for a different population, condition or comparison.
In the citing paper
“LinearDesign-generated sequences showed strong stability and protein expression results with different UTRs (figures 2g and 4a of their paper), independently confirming our in vitro experiments.”
From Algorithm for optimized mRNA design improves stability and immunogenicity (2023) · cites this paper as [29]
Experimental — accuracy not yet measuredThe cited source says what the claim attributes to it.
In the citing paper
“However, they did not perform any in vivo validations.”
From Algorithm for optimized mRNA design improves stability and immunogenicity (2023) · cites this paper as [29]
The cited source says what the claim attributes to it.
In the citing paper
“Another recent work29 optimized mRNA designs and screened them via an experimental platform.”
From Algorithm for optimized mRNA design improves stability and immunogenicity (2023) · cites this paper as [29]
Self-check
Percentages, sums and reported differences re-computed from the paper’s own numbers.
Each contradiction between two passages listed here was confirmed by an independent check.
Rated minor: it would not touch a result — a value no result rests on, a p-value that stays on the same side of the significance level, or a conflict that is clerical, resolved elsewhere in the paper, or outside its own findings.
In the paper
§ Combinatorial optimization of mRNA structure, stability, and translation for RNA-based therapeutics > METHODS > Sucrose gradient fractionation analysis
“cells were washed, trypsinized and harvested using PBS, trypsin, and culture media containing 100 g/mL cycloheximide.”
§ Combinatorial optimization of mRNA structure, stability, and translation for RNA-based therapeutics > METHODS > Sucrose gradient fractionation analysis
“Cell culture media was replaced with cycloheximide (MilliporeSigma, C7698–1G) containing media at 100ug/mL.”
Rated minor: it would not touch a result — a value no result rests on, a p-value that stays on the same side of the significance level, or a conflict that is clerical, resolved elsewhere in the paper, or outside its own findings.
In the paper
§ Combinatorial optimization of mRNA structure, stability, and translation for RNA-based therapeutics > METHODS > Measurement of in-solution mRNA stability by capillary electrophoresis
“Fi=Ae−τ/t Where Fi is an array of fraction intact values across multiple time points, A is the amplitude of the exponential decay function, τ is the time constant, and t is an array of time points in hours.”
§ Combinatorial optimization of mRNA structure, stability, and translation for RNA-based therapeutics > METHODS > Measurement of in-solution mRNA stability by capillary electrophoresis
“FractionIntacti=NormalizedAreaiNormalizedArea0hours”
Rated minor: it would not touch a result — a value no result rests on, a p-value that stays on the same side of the significance level, or a conflict that is clerical, resolved elsewhere in the paper, or outside its own findings.
In the paper
§ Combinatorial optimization of mRNA structure, stability, and translation for RNA-based therapeutics > METHODS > Quantitative RT-PCR (RT-qPCR) Analysis
“0.5 mg of RNA was converted to cDNA using iScript Supermix (Bio-Rad, 1708840).”
§ Combinatorial optimization of mRNA structure, stability, and translation for RNA-based therapeutics > METHODS > Quantitative RT-PCR (RT-qPCR) Analysis
“cDNA was synthesized from 100–200 ng of total RNA using iScript Supermix (Bio-Rad, 1708840) containing random hexamer primers”
Citations
Cites
Fast gapped-read alignment with Bowtie 2
Langmead, B., & Salzberg, S. L. (2012) · Nature Methods · doi:10.1038/nmeth.1923 · Cited by 56,400
Cutadapt removes adapter sequences from high-throughput sequencing reads
Martin, M. (2011) · EMBnet.journal · doi:10.14806/ej.17.1.200 · Cited by 33,889
Safety and Efficacy of the BNT162b2 mRNA Covid-19 Vaccine
Polack, F. P., Thomas, S. J., Kitchin, N., Absalon, J., Gurtman, A., Lockhart, S., Perez, J. L., Pérez Marc, G., Moreira, E. D., Zerbini, C., et al. (2020) · New England Journal of Medicine · doi:10.1056/nejmoa2034577 · Cited by 14,592
Self-citationEfficacy and Safety of the mRNA-1273 SARS-CoV-2 Vaccine
Baden, L. R., El Sahly, H. M., Essink, B., Kotloff, K., Frey, S., Novak, R., Diemert, D., Spector, S. A., Rouphael, N., Creech, C. B., et al. (2021) · New England Journal of Medicine · doi:10.1056/nejmoa2035389 · Cited by 10,119
Global quantification of mammalian gene expression control
Schwanhäusser, B., Busse, D., Li, N., Dittmar, G., Schuchhardt, J., Wolf, J., Chen, W., & Selbach, M. (2011) · Nature · doi:10.1038/nature10098 · Cited by 6,566
Characteristics of SARS-CoV-2 and COVID-19
Hu, B., Guo, H., Zhou, P., & Shi, Z.-L. (2021) · Nature Reviews Microbiology · doi:10.1038/s41579-020-00459-7 · Cited by 5,291
Lorenz, R., Bernhart, S. H., Höner zu Siederdissen, C., Tafer, H., Flamm, C., Stadler, P. F., & Hofacker, I. L. (2011) · Algorithms for Molecular Biology · doi:10.1186/1748-7188-6-26 · Cited by 5,098
An analysis of 5'-noncoding sequences from 699 vertebrate messenger RNAs
Kozak, M. (1987) · Nucleic Acids Research · doi:10.1093/nar/15.20.8125 · Cited by 5,090
mRNA vaccines — a new era in vaccinology
Pardi, N., Hogan, M. J., Porter, F. W., & Weissman, D. (2018) · Nature Reviews Drug Discovery · doi:10.1038/nrd.2017.243 · Cited by 4,667
Sharp, P. M., & Li, W.-H. (1987) · Nucleic Acids Research · doi:10.1093/nar/15.3.1281 · Cited by 3,992
Cited by
Sorted by citations
mRNA-based therapeutics: powerful and versatile tools to combat diseases
Qin, S., Tang, X., Chen, Y., Chen, K., Fan, N., Xiao, W., Zheng, Q., Li, G., Teng, Y., Wu, M., et al. (2022) · Signal Transduction and Targeted Therapy · doi:10.1038/s41392-022-01007-w · Cited by 852
Mendes, B. B., Conniot, J., Avital, A., Yao, D., Jiang, X., Zhou, X., Sharf-Pauker, N., Xiao, Y., Adir, O., Liang, H., et al. (2022) · Nature Reviews Methods Primers · doi:10.1038/s43586-022-00104-y · Cited by 719
The landscape of mRNA nanomedicine
Huang, X., Kong, N., Zhang, X., Cao, Y., Langer, R., & Tao, W. (2022) · Nature Medicine · doi:10.1038/s41591-022-02061-1 · Cited by 511
Algorithm for optimized mRNA design improves stability and immunogenicity
Zhang, H., Zhang, L., Lin, A., Xu, C., Li, Z., Liu, K., Liu, B., Ma, X., Zhao, F., Jiang, H., et al. (2023) · Nature · doi:10.1038/s41586-023-06127-z · Cited by 531
mRNA vaccines for infectious diseases — advances, challenges and opportunities
Pardi, N., & Krammer, F. (2024) · Nature Reviews Drug Discovery · doi:10.1038/s41573-024-01042-y · Cited by 252
Metadata
- Authors
- Leppek, K., Byeon, G. W., Kladwang, W., Wayment-Steele, H. K., Kerr, C. H., Xu, A. F., Kim, D. S., Topkar, V. V., Choe, C., Rothschild, D., Tiu, G. C., Wellington-Oguri, R., Fujii, K., Sharma, E., Watkins, A. M., Nicol, J. J., Romano, J., Tunguz, B., Diaz, F., Cai, H., Guo, P., Wu, J., Meng, F., Shi, S., Participants, E., Dormitzer, P. R., Solórzano, A., Barna, M., & Das, R.
- Affiliations
- Stanford University (US)
- Eterna Massive Open Laboratory (US)
- Nvidia (United States) (US)
- Pfizer (United States) (US)
- Corresponding author
- Barna, Maria
- Das, Rhiju
- ORCID
- Leppek, Kathrin
- Byeon, Gun Woo
- Kladwang, Wipapat
- Wayment-Steele, Hannah K.
- Kerr, Craig H.
- Xu, Adele F.
- Kim, Do Soon
- Topkar, Ved V.
- Choe, Christian
- Rothschild, Daphna
- Tiu, Gerald C.
- Wellington-Oguri, Roger
- Fujii, Kotaro
- Sharma, Eesha
- Watkins, Andrew M.
- Romano, Jonathan
- Cai, Hui
- Guo, Pengbo
- Wu, Jiewei
- Meng, Fanyu
- Participants, Eterna
- Dormitzer, Philip R.
- Solórzano, Alicia
- Barna, Maria
- Das, Rhiju
- Venue
- Nature Communications
- Published
- 2022-03-22
- Volume
- 13
- Issue
- 1
- Pages
- 1536-1536
- ISSN
- 2041-1723 (ISSN-L)
- PMC
- PMC8020971
- OpenAlex
- W4220991830
- Cited by
- 399
- References
- 117
- Citations by year
- 2026: 88 · 2025: 127 · 2024: 99 · 2023: 53 · 2022: 23
- FWCI
- 24.66
- Type
- journal article
- Language
- en
- Open access
- gold
- doi.org
- Locations
- Nature Communications (publishedVersion, cc-by)
- bioRxiv (Cold Spring Harbor Laboratory) (acceptedVersion, cc-by-nc)
- PubMed Central (publishedVersion, cc-by)
- PubMed (publishedVersion)
- PubMed Central (submittedVersion, cc-by-nc)
- RePEc: Research Papers in Economics (submittedVersion)
- DOAJ (DOAJ: Directory of Open Access Journals) (submittedVersion)
- Funders
- National Science Foundation
- Damon Runyon Cancer Research Foundation (DRG-2237-15)
- Pfizer
- Oregon State University
- Baidu
- National Institutes of Health
- University of California, San Francisco
- Stanford Bio-X
- Chemistry, Engineering and Medicine for Human Health, Stanford University
- Canadian Institutes of Health Research
- National Cancer Institute (R21CA219847)
- National Institute of General Medical Sciences (R35GM122579)
- Eunice Kennedy Shriver National Institute of Child Health and Human Development (F30HD100123, R01HD086634)
- Topics
- Life Sciences › Biochemistry, Genetics and Molecular Biology › Molecular Biology › RNA and protein synthesis mechanisms
- Life Sciences › Biochemistry, Genetics and Molecular Biology › Molecular Biology › RNA Interference and Gene Delivery
- Life Sciences › Biochemistry, Genetics and Molecular Biology › Molecular Biology › RNA Research and Splicing
- Keywords
- mRNA stability, mRNA structure, mRNA vaccines, RNA therapeutics, protein expression, hydrolytic degradation, pseudouridine modification, mRNA design, COVID-19 vaccines
About these checks
Registry, retraction, Cites and statistics results are computed, not judged, with one exception: a printed reference that no index lists is read once by a model before it counts as a citation error. Claims are extracted by a model and kept only when their quote appears verbatim in the text; each cited source is then checked, with a model’s help, for whether it says what the claim relies on. Those verdicts can be wrong — read the claim’s quote and the cited source before relying on one.
A language model drew the claims from the paper on 2026-11-05, under version 3 of the claim definition (model deepseek-v4.1-flash, prompt extract-v3).
A second model labelled each claim on 2026-11-05 (model jev-1.13-20260917, definition revision gold-guideline-v0.2).
Cited sources are checked with a language model’s help (gpt-6-sol).
Statistics and arithmetic are recomputed, not judged.
Confidence bands are shown only for fields calibrated on our annotated test set. None is calibrated yet, so no band is shown.
What counts as a claim ›How we measure confidence ›How we check this ›
Are you an author, or do you see a problem with this page? Request a review
