

The DOI matches its Crossref record; 62 of the 62 references it cites were found in a registry or an index; 10 of the 56 sources its claims cite were checked for support.
Hypoxia induces HIF1α-dependent epigenetic vulnerability in triple negative breast cancer to confer immune effector dysfunction and resistance to anti-PD-1 immunotherapy
Open accessAbstract
The hypoxic tumor microenvironment has been implicated in immune escape, but the underlying mechanism remains elusive. Using an in vitro culture system modeling human T cell dysfunction and exhaustion in triple-negative breast cancer (TNBC), we find that hypoxia suppresses immune effector gene expression, including in T and NK cells, resulting in immune effector cell dysfunction and resistance to immunotherapy. We demonstrate that hypoxia-induced factor 1α (HIF1α) interaction with HDAC1 and concurrent PRC2 dependency causes chromatin remolding resulting in epigenetic suppression of effector genes and subsequent immune dysfunction. Targeting HIF1α and the associated epigenetic machinery can reverse the immune effector dysfunction and overcome resistance to PD-1 blockade, as demonstrated both in vitro and in vivo using syngeneic and humanized mice models. These findings identify a HIF1α-mediated epigenetic mechanism in immune dysfunction and provide a potential strategy to overcome immune resistance in TNBC.
Overview
AI snapshot
Written from the paper’s full text.
TL;DR
Hypoxia in triple-negative breast cancer suppresses T and NK effector gene expression via HIF1α-dependent recruitment of HDAC1 and pre-existing PRC2, producing chromatin remodeling and resistance to anti-PD-1 therapy. Targeting HIF1α or the associated epigenetic machinery restores immune effector function and sensitizes TNBC to PD-1 blockade in vitro and in mouse models.
Key findings
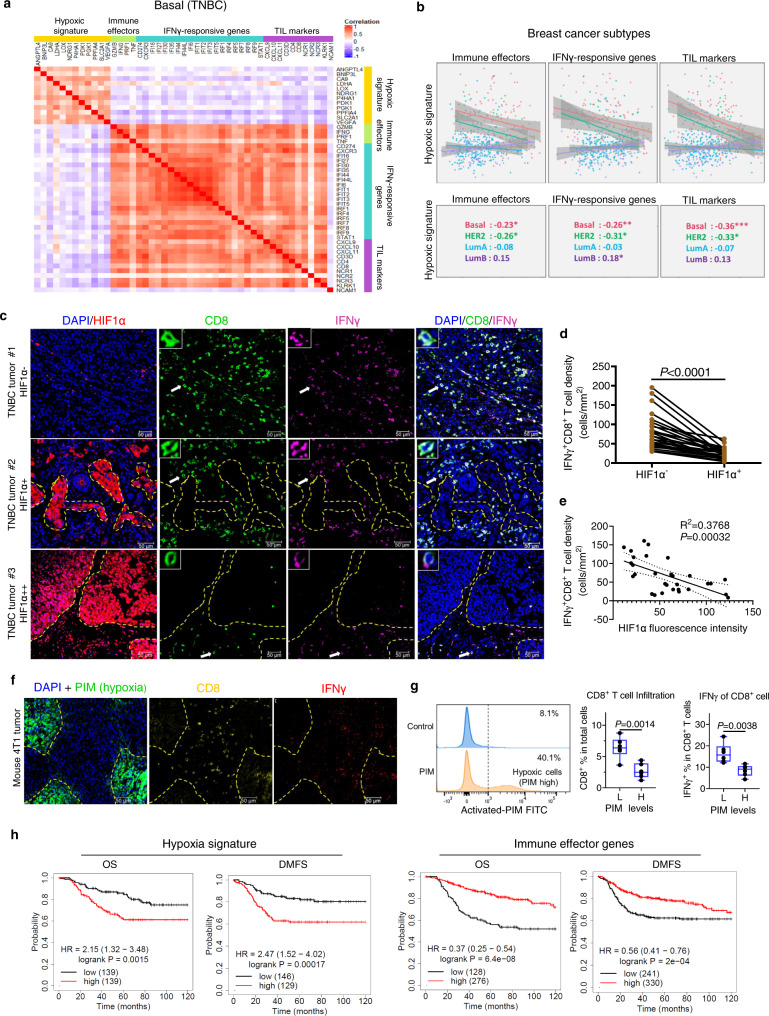
- In TCGA basal TNBC samples (n = 98 in Fig. 1a), hypoxia gene signature expression was inversely correlated with immune effector genes (IFNG, TNF, GZMB, PRF1), IFNγ-responsive genes, and TIL-associated genes; in human TNBC samples (n = 30), HIF1α-high tumor areas had reduced CD8+ T cell infiltration and IFNγ expression.
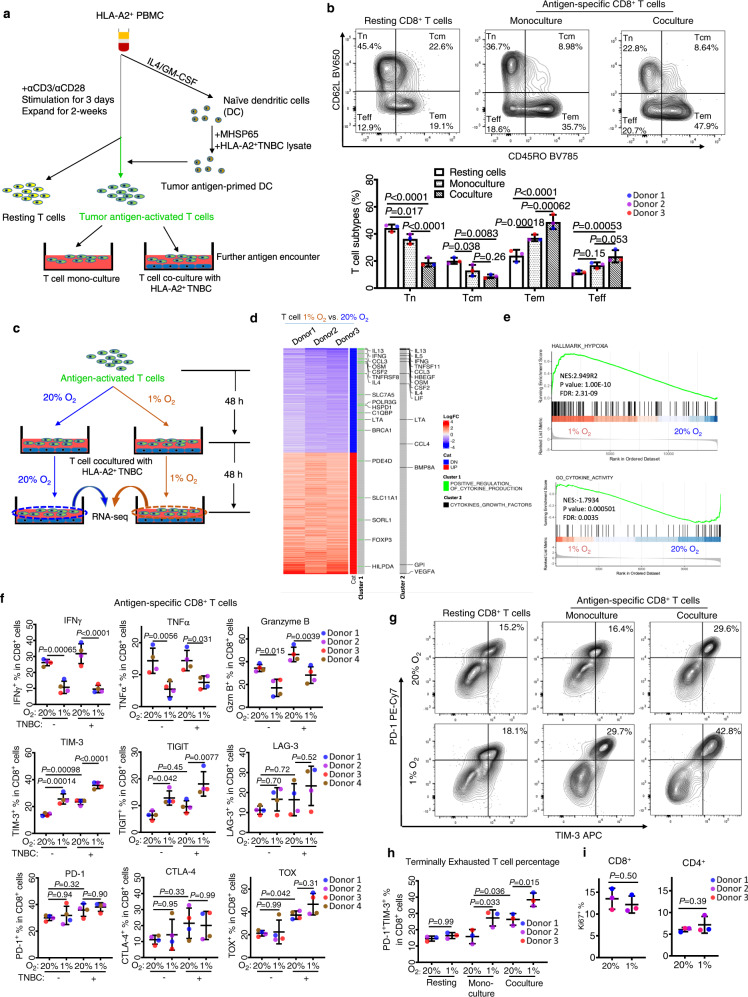
- Hypoxia (1% O2) suppressed IFNγ, TNFα, and granzyme B in CD8+ T cells and NK cells, and induced TIM-3/TIGIT; hypoxia plus TNBC coculture increased PD-1+TIM-3+ double-positive CD8+ T cells to 30–40% versus 10–20% in resting T cells.
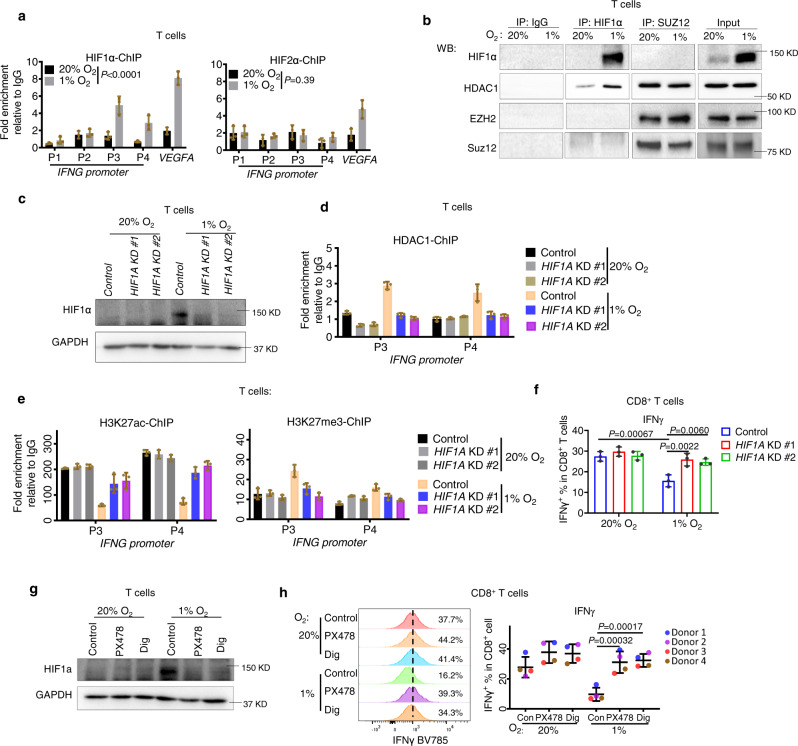
- Hypoxia increased HIF1α and HDAC1 occupancy at IFNG and TNF promoters, reduced H3K27ac, and increased H3K27me3; HIF1α co-immunoprecipitated with HDAC1, and HDAC1 also interacted with SUZ12. HDAC inhibitor entinostat, EZH2 inhibitor EPZ6438, HIF1α inhibitors PX478/digoxin, or CRISPR depletion of HDAC1/EZH2 restored effector expression.
- In 4T1 syngeneic and humanized NIKO/LM2 mouse models, anti-PD-1 alone had minimal effect, but anti-PD-1 combined with PX478 or entinostat induced tumor regression, suppressed lung metastasis, and improved survival; depletion of T or NK cells largely abolished combination efficacy.
Methods
- Human T and NK cells were isolated from healthy donor PBMC, expanded, and cultured under normoxia (20% O2) or hypoxia (1% O2), alone or cocultured with TNBC lines BT549, MDA-MB-231, or MDA-MB-231-LM2; assays included RNA-seq, flow cytometry, RT-qPCR, ChIP-qPCR, co-immunoprecipitation, CRISPR knockdown, and luciferase-based cytotoxicity.
- TCGA breast cancer data were analyzed by PAM50 subtype (basal/TNBC n = 98; HER2+ n = 58; Luminal A n = 231; Luminal B n = 129); immunofluorescence used human TNBC samples (n = 30) and mouse 4T1 tumors.
- In vivo work used BALB/c mice bearing orthotopic 4T1-Luc tumors and humanized NOD/SCID/IL2Rg−/− (NIKO) mice reconstituted with human CD34+ cells and engrafted with MDA-MB-231-LM2; treatments included anti-PD-1/Keytruda with PX478, entinostat, or EPZ6438. Statistics used ANOVA, t-tests, and log-rank tests; RNA-seq DEG thresholds were |logFC| > 1 and adjusted P < 0.01.
Limitations
- The paper states that PX478 and epigenetic drugs have additional effects on other tumor microenvironment elements such as myeloid cells and macrophages, and that EPZ6438 could not achieve satisfactory solubility in different formulations, likely explaining its weaker in vivo effects.
- The paper notes that HIF1α-independent induction of TIM-3 and TIGIT remains to be explored as a possible additional strategy to prevent T cell exhaustion.
- Evident from the text: the mechanistic evidence relies heavily on in vitro healthy-donor human immune cells and mouse/humanized models, with no clinical trial validation; TCGA findings are correlative, and the 1% O2 system may not fully capture heterogeneous tumor hypoxia.
Model-written summary. Check it against the paper before relying on it.
Integrity signals
Registry
Cites
Statistics
Figures
Verification
Claims the paper makes
87 Own result · 45 Own interpretation · 24 Not checked yet · 9 Own method · 3 Partly supported · 1 Mixed support · 1 No basis given · accuracy not yet measured
The cited sources support only part of this claim — read each source’s verdict below.
In the paper
“In breast cancer, hypoxia is more evident in TNBC than in other breast cancer subtypes11,12.”
§ Hypoxia induces HIF1α-dependent epigenetic vulnerability in triple negative breast cancer to confer immune effector dysfunction and resistance to anti-PD-1 immunotherapy > Introduction
What the sources say
- Partly supportedcites [11] Cancer Genome Atlas Network. Comprehensive molecular portraits of human breast tumours. Nature 490, 61–70 (2012). sourceExperimental — accuracy not yet measured
The Basal-like summary analysis reports hyperactivation of the HIF1α/ARNT pathway in Basal-like cancers compared with Luminal cancers and notes that most Basal-like cancers are TNBC. It does not directly establish that hypoxia is more evident in TNBC than in every other breast cancer subtype; Basal-like and TNBC are not identical groups. (LLM, conf=0.85)
- Supportedcites [12] Tutzauer, J. et al. Breast cancer hypoxia in relation to prognosis and benefit from radiotherapy after breast-conserving surgery in a large, randomised trial with long-term follow-up. Br. J. Cancer 126, 1145–1156 (2022). source
The Discussion reports that HIF-1α positivity, used here as a marker of tumour hypoxia, increases across breast cancer subtypes from luminal A through luminal B and HER2-positive to triple-negative tumours. This supports the claim that hypoxia is more evident in TNBC than in the other subtypes examined. (LLM, conf=0.93)
plaincorrelational- Asserted: passes — The authors put it forward as true.
- Checkable: passes — It can be checked against evidence.
- Load-bearing: passes — The paper’s conclusions depend on it.
- Based: passes — The paper gives a reason why it holds.
- Partly supported
None of the sources cited for this claim have been checked yet.
In the paper
“data analysis of The Cancer Genome Atlas (TCGA) dataset11 identified that hypoxic gene signature, which includes commonly documented hypoxia-responsive genes26, was inversely correlated with immune effector genes (IFNG, TNF, GZMB, PRF1), IFNγ-responsive genes, as well as genes associated with tumor-infiltrating lymphocytes (TILs) in TNBC (n = 99) (also referred as a basal subtype of breast cancer)”
§ Hypoxia induces HIF1α-dependent epigenetic vulnerability in triple negative breast cancer to confer immune effector dysfunction and resistance to anti-PD-1 immunotherapy > Results > Hypoxia is associated with immune escape in breast cancer
What the sources say
- Not checked yetcites [11] Cancer Genome Atlas Network. Comprehensive molecular portraits of human breast tumours. Nature 490, 61–70 (2012). source
- Not checked yetcites [26] Mahara, S. et al. HIFI-alpha activation underlies a functional switch in the paradoxical role of Ezh2/PRC2 in breast cancer. Proc. Natl Acad. Sci. USA 113, E3735–E3744 (2016). source
plaincorrelationaln = 99- Asserted: passes — The authors put it forward as true.
- Checkable: passes — It can be checked against evidence.
- Load-bearing: passes — The paper’s conclusions depend on it.
- Based: passes — The paper gives a reason why it holds.
A result the paper reports from its own data — it cites no other source for it, so there is none to check. The quote shows it is in the paper.
In the paper
“Therefore, we showed that this protocol could efficiently differentiate the peripheral naive T cells into antigen-specific cytotoxic effector and memory T cells.”
§ Hypoxia induces HIF1α-dependent epigenetic vulnerability in triple negative breast cancer to confer immune effector dysfunction and resistance to anti-PD-1 immunotherapy > Results > Hypoxia induces T cell dysfunction, which upon further antigen stimulation, drives towards an exhaustion-like state
hedgeddirect- Asserted: passes — The authors put it forward as true.
- Checkable: passes — It can be checked against evidence.
- Load-bearing: unclear — It is unclear whether the paper’s conclusions depend on it.
- Based: passes — The paper gives a reason why it holds.
A result the paper reports from its own data — it cites no other source for it, so there is none to check. The quote shows it is in the paper.
In the paper
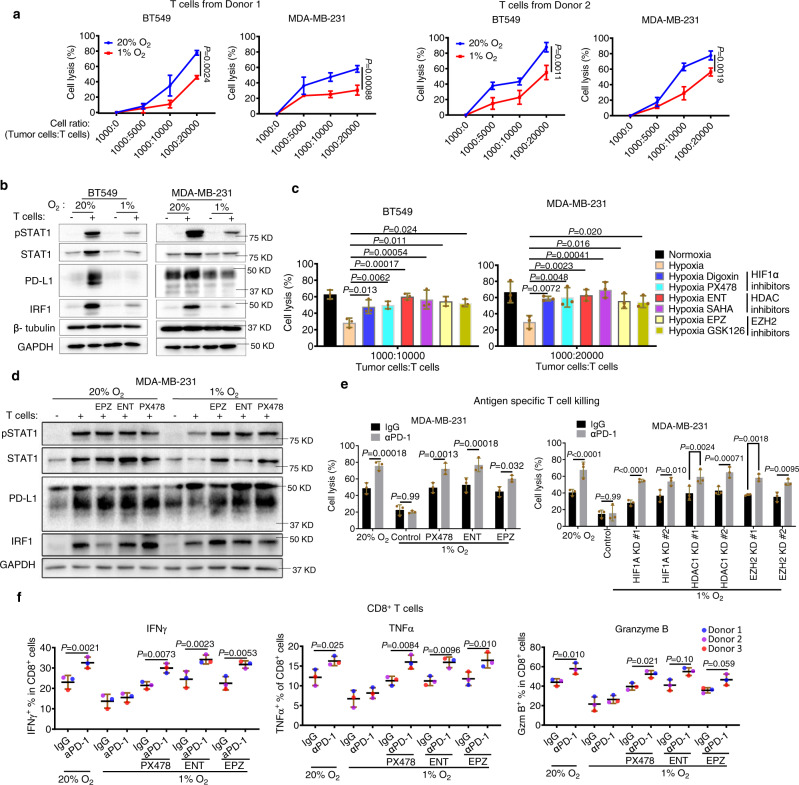
“The results showed that hypoxia caused marked downregulations of IFNγ, TNFα, and granzyme B in CD8+ T cells in both monoculture and coculture conditions (Fig. 2f).”
§ Hypoxia induces HIF1α-dependent epigenetic vulnerability in triple negative breast cancer to confer immune effector dysfunction and resistance to anti-PD-1 immunotherapy > Results > Hypoxia induces T cell dysfunction, which upon further antigen stimulation, drives towards an exhaustion-like state
plaindirect- Asserted: passes — The authors put it forward as true.
- Checkable: passes — It can be checked against evidence.
- Load-bearing: passes — The paper’s conclusions depend on it.
- Based: passes — The paper gives a reason why it holds.
A result the paper reports from its own data — it cites no other source for it, so there is none to check. The quote shows it is in the paper.
In the paper
“Conversely, TNBC patients with higher immune effector gene signatures are associated with prolonged survivals (Fig. 1h).”
§ Hypoxia induces HIF1α-dependent epigenetic vulnerability in triple negative breast cancer to confer immune effector dysfunction and resistance to anti-PD-1 immunotherapy > Results > Hypoxia is associated with immune escape in breast cancer
plaincorrelational- Asserted: passes — The authors put it forward as true.
- Checkable: passes — It can be checked against evidence.
- Load-bearing: passes — The paper’s conclusions depend on it.
- Based: passes — The paper gives a reason why it holds.
A result the paper reports from its own data — it cites no other source for it, so there is none to check. The quote shows it is in the paper.
In the paper
“Intratumoral analysis showed that tumor areas with high levels of hypoxia, as indicated by staining of HIF1α, displayed markedly reduced CD8+ T cell infiltration as well as IFNγ expression compared to low hypoxic areas (Fig. 1c, d).”
§ Hypoxia induces HIF1α-dependent epigenetic vulnerability in triple negative breast cancer to confer immune effector dysfunction and resistance to anti-PD-1 immunotherapy > Results > Hypoxia is associated with immune escape in breast cancer
plaincorrelational- Asserted: passes — The authors put it forward as true.
- Checkable: passes — It can be checked against evidence.
- Load-bearing: passes — The paper’s conclusions depend on it.
- Based: passes — The paper gives a reason why it holds.
A result the paper reports from its own data — it cites no other source for it, so there is none to check. The quote shows it is in the paper.
In the paper
“TNF (TNFα) and GZMB (granzyme B) were also downregulated by hypoxia in two of the three donors (1.7–2.4 fold), though they did not meet the cutoff criteria.”
§ Hypoxia induces HIF1α-dependent epigenetic vulnerability in triple negative breast cancer to confer immune effector dysfunction and resistance to anti-PD-1 immunotherapy > Results > Hypoxia induces T cell dysfunction, which upon further antigen stimulation, drives towards an exhaustion-like state
plaindirectn = 2- Asserted: passes — The authors put it forward as true.
- Checkable: passes — It can be checked against evidence.
- Load-bearing: unclear — It is unclear whether the paper’s conclusions depend on it.
- Based: passes — The paper gives a reason why it holds.
A result the paper reports from its own data — it cites no other source for it, so there is none to check. The quote shows it is in the paper.
In the paper
“Consistent with the gene signature analysis in TCGA, an inverse correlation between HIF1α and IFNγ+/ CD8+ T cells in TNBC was confirmed (Fig. 1e).”
§ Hypoxia induces HIF1α-dependent epigenetic vulnerability in triple negative breast cancer to confer immune effector dysfunction and resistance to anti-PD-1 immunotherapy > Results > Hypoxia is associated with immune escape in breast cancer
boostedcorrelational- Asserted: passes — The authors put it forward as true.
- Checkable: passes — It can be checked against evidence.
- Load-bearing: passes — The paper’s conclusions depend on it.
- Based: passes — The paper gives a reason why it holds.
A result the paper reports from its own data — it cites no other source for it, so there is none to check. The quote shows it is in the paper.
In the paper
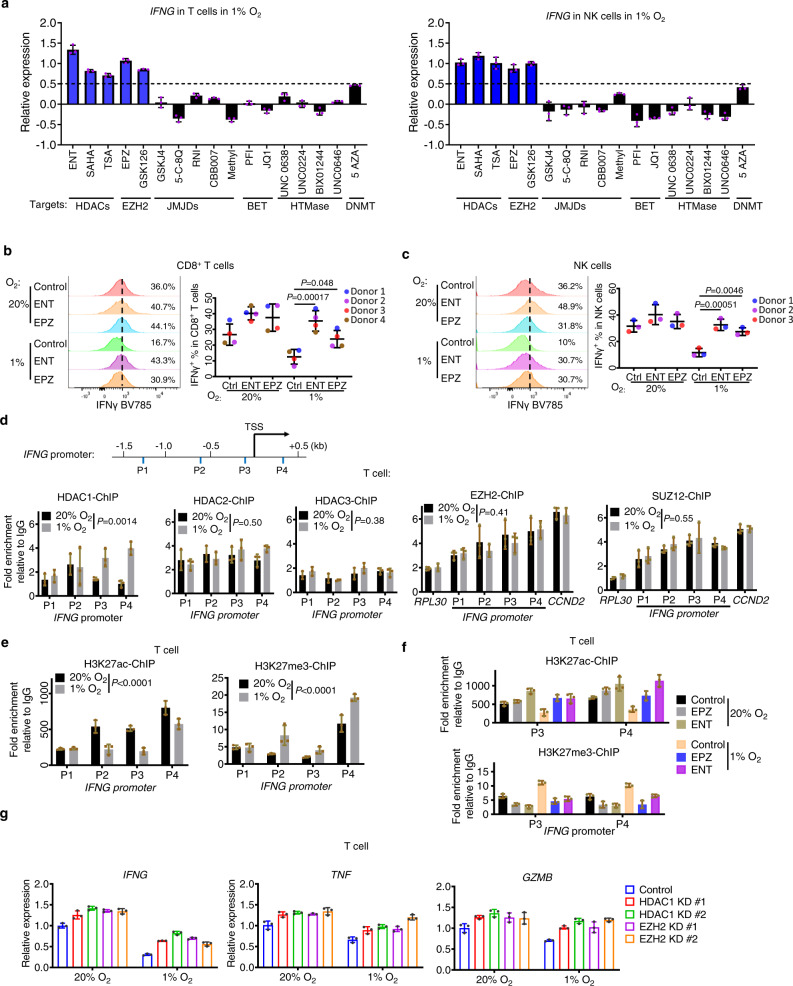
“Among the drugs tested that target different epigenetic modifications, inhibitors of histone deacetylase (HDAC) and Enhancer of zeste homolog 2 (EZH2)/PRC2, and to a lesser extent, DNMT inhibitor 5-azacytidine (AZA), were found to consistently induce the expression of IFNG in both T and NK cells (Fig. 3a).”
§ Hypoxia induces HIF1α-dependent epigenetic vulnerability in triple negative breast cancer to confer immune effector dysfunction and resistance to anti-PD-1 immunotherapy > Results > Hypoxia induces chromatin remodeling to suppress immune effector gene expression in T and NK cells
plaindirect- Asserted: passes — The authors put it forward as true.
- Checkable: passes — It can be checked against evidence.
- Load-bearing: passes — The paper’s conclusions depend on it.
- Based: passes — The paper gives a reason why it holds.
A result the paper reports from its own data — it cites no other source for it, so there is none to check. The quote shows it is in the paper.
In the paper
“Further verification by flow cytometry has demonstrated that HDAC inhibitor Entinostat (ENT) and EZH2 inhibitor EPZ6438 (EPZ), both of which are clinically approved drugs, were able to rescue the IFNγ, TNFα and granzyme B expression in hypoxic CD8+, CD4+ T cells and NK cells (Fig. 3b, c and Fig. S3a, b).”
§ Hypoxia induces HIF1α-dependent epigenetic vulnerability in triple negative breast cancer to confer immune effector dysfunction and resistance to anti-PD-1 immunotherapy > Results > Hypoxia induces chromatin remodeling to suppress immune effector gene expression in T and NK cells
boosteddirect- Asserted: passes — The authors put it forward as true.
- Checkable: passes — It can be checked against evidence.
- Load-bearing: passes — The paper’s conclusions depend on it.
- Based: passes — The paper gives a reason why it holds.
- Probably not a substantial claim. 27
- It may state two separate claims as one. 51
- The quote only partly states this claim. 1
Some cited sources support this claim and some don’t — read each source’s verdict below.
In the paper
“Triple-negative breast cancer (TNBC) is an aggressive subtype of breast cancer that lacks effective treatment1,2.”
§ Hypoxia induces HIF1α-dependent epigenetic vulnerability in triple negative breast cancer to confer immune effector dysfunction and resistance to anti-PD-1 immunotherapy > Introduction
What the sources say
- Disputedcites [1] Bianchini, G., Balko, J. M., Mayer, I. A., Sanders, M. E. & Gianni, L. Triple-negative breast cancer: challenges and opportunities of a heterogeneous disease. Nat. Rev. Clin. Oncol. 13, 674–690 (2016). sourceExperimental — accuracy not yet measured
The Abstract describes TNBC as having aggressive clinical behaviour, supporting that part of the claim. But “Chemotherapy for TNBC” says chemotherapy provides significant benefit and identifies taxanes and anthracyclines as effective treatments. The paper reports a lack of recognized molecular targets, not a lack of effective treatment. (LLM, conf=0.88)
Checked by a reasoning model — may be wrong.
- Partly supportedcites [2] Podo, F. et al. Triple-negative breast cancer: present challenges and new perspectives. Mol. Oncol. 4, 209–229 (2010). sourceExperimental — accuracy not yet measured
The Introduction describes TNBC as aggressive and notes a lack of targeted therapies. Section 2.2 reports that chemotherapy can produce responses, though relapse remains a problem. The claim’s broad statement that TNBC lacks effective treatment overstates the narrower treatment limitation described in the paper. (LLM, conf=0.88)
plain- Asserted: passes — The authors put it forward as true.
- Checkable: passes — It can be checked against evidence.
- Load-bearing: fails — The paper’s conclusions may not depend on it.
- Based: passes — The paper gives a reason why it holds.
Probably not a substantial claim. The paper’s conclusions may not depend on it. It may state two separate claims as one.
- Disputed
The cited sources support only part of this claim — read each source’s verdict below.
In the paper
“Immune checkpoint blockade (ICB) directed against programmed death-1 (PD-1) or programmed death-ligand 1 (PD-L1) has shown promising results in TNBC4–6, but the overall response rate of ICB is less than 20%7.”
§ Hypoxia induces HIF1α-dependent epigenetic vulnerability in triple negative breast cancer to confer immune effector dysfunction and resistance to anti-PD-1 immunotherapy > Introduction
What the sources say
- Supportedcites [4] Nanda, R. et al. Effect of pembrolizumab plus neoadjuvant chemotherapy on pathologic complete response in women with early-stage breast cancer: an analysis of the ongoing phase 2 adaptively randomized I-SPY2 trial. JAMA Oncol. 6, 676–684 (2020). source
The cited paper supports the promising-results clause attached to references 4–6. Its Results report an estimated pathologic complete response rate of 60% with pembrolizumab plus chemotherapy versus 22% with chemotherapy alone in the TNBC cohort. The separate claim that the overall response rate is below 20% is attached to reference 7, not attributed to this source. (LLM, conf=0.91)
- Supportedcites [5] Schmid, P. et al. Pembrolizumab plus chemotherapy as neoadjuvant treatment of high-risk, early-stage triple-negative breast cancer: results from the phase 1b open-label, multicohort KEYNOTE-173 study. Ann. Oncol. 31, 569–581 (2020). source
This source is cited for the promising-results clause, not the less-than-20% response-rate clause, which has a separate citation. The Abstract reports promising antitumor activity for PD-1-directed pembrolizumab plus chemotherapy in early-stage TNBC, with a 60% pathological complete response rate. (LLM, conf=0.90)
- Not checked yetcites [6] Schmid, P. et al. Pembrolizumab for early triple-negative breast cancer. N. Engl. J. Med. 382, 810–821 (2020). source
- Partly supportedcites [7] Nanda, R. et al. Pembrolizumab in patients with advanced triple-negative breast cancer: phase Ib KEYNOTE-012 study. J. Clin. Oncol. 34, 2460–2467 (2016). sourceExperimental — accuracy not yet measured
The Results report an 18.5% overall response rate among 27 evaluable patients with advanced, PD-L1-positive TNBC treated with pembrolizumab. That supports the less-than-20% figure for this study, but not a general response rate for all PD-1 or PD-L1 immune checkpoint blockade in TNBC. (LLM, conf=0.86)
plain- Asserted: passes — The authors put it forward as true.
- Checkable: passes — It can be checked against evidence.
- Load-bearing: passes — The paper’s conclusions depend on it.
- Based: passes — The paper gives a reason why it holds.
Probably not a substantial claim. It may state two separate claims as one.
- Supported
The cited sources support only part of this claim — read each source’s verdict below.
In the paper
“Hypoxia is a hallmark of most solid tumors and a common trait of TME that is associated with cancer progression and metastasis8–10.”
§ Hypoxia induces HIF1α-dependent epigenetic vulnerability in triple negative breast cancer to confer immune effector dysfunction and resistance to anti-PD-1 immunotherapy > Introduction
What the sources say
- Partly supportedcites [8] Chaturvedi, P., Gilkes, D. M., Takano, N. & Semenza, G. L. Hypoxia-inducible factor-dependent signaling between triple-negative breast cancer cells and mesenchymal stem cells promotes macrophage recruitment. Proc. Natl Acad. Sci. USA 111, E2120–E2129 (2014). sourceExperimental — accuracy not yet measured
The introductory HIF-1 section (page unavailable) calls intratumoral hypoxia a major microenvironmental factor associated with invasion and metastasis. The Significance section also links hypoxia in breast cancer to metastatic risk. Our copy does not establish that hypoxia is a hallmark of most solid tumors, so the claim’s prevalence statement is unsupported. (LLM, conf=0.84)
- Supportedcites [9] Rankin, E. B. & Giaccia, A. J. Hypoxic control of metastasis. Science 352, 175–180 (2016). source
The Hypoxic signaling section calls hypoxia a hallmark of the tumor microenvironment, estimates that 50–60% of solid tumors contain hypoxic or anoxic regions, and associates hypoxia with metastasis and tumor progression. This supports the citing sentence’s description of hypoxia as common in solid tumors and associated with progression and metastasis. (LLM, conf=0.93)
- Supportedcites [10] Pietrobon, V. & Marincola, F. M. Hypoxia and the phenomenon of immune exclusion. J. Transl. Med. 19, 9 (2021). source
The section “Techniques to map hypoxic areas and immune infiltration” calls hypoxia a hallmark of most solid tumors and describes its effects on the tumor microenvironment. “Molecular mechanisms involved in cell response to hypoxia” says hypoxic conditions favor aggressive tumor clones and that hypoxic tumors have increased metastatic potential. Page numbers are not provided in our copy. (LLM, conf=0.94)
plaincorrelational- Asserted: passes — The authors put it forward as true.
- Checkable: passes — It can be checked against evidence.
- Load-bearing: passes — The paper’s conclusions depend on it.
- Based: passes — The paper gives a reason why it holds.
Probably not a substantial claim. It may state two separate claims as one.
- Partly supported
None of the sources cited for this claim have been checked yet.
In the paper
“Kaplan–Meier analysis using public breast cancer meta-analysis database11,30 reveals that TNBC patients with higher hypoxia gene signature are associated with worse disease outcomes, including both overall survival (OS) and distant metastasis-free survival (DMFS), compared to those with lower expression of hypoxia gene signature (Fig. 1h).”
§ Hypoxia induces HIF1α-dependent epigenetic vulnerability in triple negative breast cancer to confer immune effector dysfunction and resistance to anti-PD-1 immunotherapy > Results > Hypoxia is associated with immune escape in breast cancer
What the sources say
plaincorrelational- Asserted: passes — The authors put it forward as true.
- Checkable: passes — It can be checked against evidence.
- Load-bearing: passes — The paper’s conclusions depend on it.
- Based: passes — The paper gives a reason why it holds.
It may state two separate claims as one.
A result the paper reports from its own data — it cites no other source for it, so there is none to check. The quote shows it is in the paper.
In the paper
“Hypoxia did not seem to affect the CD4+ and CD8+ T cell compositions (Fig. S2b), nor did it affect the overall T cell differentiation status, though it slightly decreased the Tem population and increased Teff population (Fig. S2d).”
§ Hypoxia induces HIF1α-dependent epigenetic vulnerability in triple negative breast cancer to confer immune effector dysfunction and resistance to anti-PD-1 immunotherapy > Results > Hypoxia induces T cell dysfunction, which upon further antigen stimulation, drives towards an exhaustion-like state
hedged- Asserted: passes — The authors put it forward as true.
- Checkable: passes — It can be checked against evidence.
- Load-bearing: unclear — It is unclear whether the paper’s conclusions depend on it.
- Based: passes — The paper gives a reason why it holds.
It may state two separate claims as one.
A result the paper reports from its own data — it cites no other source for it, so there is none to check. The quote shows it is in the paper.
In the paper
“Further analysis of other breast cancer subtypes revealed that the inverse correlation between hypoxia gene signature and immune gene activity was also observed in HER2+ breast cancer but not in luminal breast cancers, which were less aggressive and less hypoxic (Fig. 1b).”
§ Hypoxia induces HIF1α-dependent epigenetic vulnerability in triple negative breast cancer to confer immune effector dysfunction and resistance to anti-PD-1 immunotherapy > Results > Hypoxia is associated with immune escape in breast cancer
plaincorrelational- Asserted: passes — The authors put it forward as true.
- Checkable: passes — It can be checked against evidence.
- Load-bearing: unclear — It is unclear whether the paper’s conclusions depend on it.
- Based: passes — The paper gives a reason why it holds.
It may state two separate claims as one.
A result the paper reports from its own data — it cites no other source for it, so there is none to check. The quote shows it is in the paper.
In the paper
“Flow cytometry analysis also confirmed that intratumor T cells with higher levels of PIM exhibited lower numbers of CD8+ T cells and reduced IFNγ expression in CD8+ T cells (Fig. 1g).”
§ Hypoxia induces HIF1α-dependent epigenetic vulnerability in triple negative breast cancer to confer immune effector dysfunction and resistance to anti-PD-1 immunotherapy > Results > Hypoxia is associated with immune escape in breast cancer
plaincorrelational- Asserted: passes — The authors put it forward as true.
- Checkable: passes — It can be checked against evidence.
- Load-bearing: passes — The paper’s conclusions depend on it.
- Based: passes — The paper gives a reason why it holds.
It may state two separate claims as one.
A result the paper reports from its own data — it cites no other source for it, so there is none to check. The quote shows it is in the paper.
In the paper
“A similar result was also found in HER2+ breast cancer but not in luminal breast cancers (Fig. S1).”
§ Hypoxia induces HIF1α-dependent epigenetic vulnerability in triple negative breast cancer to confer immune effector dysfunction and resistance to anti-PD-1 immunotherapy > Results > Hypoxia is associated with immune escape in breast cancer
plaincorrelational- Asserted: passes — The authors put it forward as true.
- Checkable: passes — It can be checked against evidence.
- Load-bearing: unclear — It is unclear whether the paper’s conclusions depend on it.
- Based: passes — The paper gives a reason why it holds.
It may state two separate claims as one.
A result the paper reports from its own data — it cites no other source for it, so there is none to check. The quote shows it is in the paper.
In the paper
“Tumor areas showing higher levels of PIM exhibited minimum staining of IFNγ and CD8 signals, while the tumor areas showing lower levels of PIM were enriched with IFNγ and CD8 signals (Fig. 1f).”
§ Hypoxia induces HIF1α-dependent epigenetic vulnerability in triple negative breast cancer to confer immune effector dysfunction and resistance to anti-PD-1 immunotherapy > Results > Hypoxia is associated with immune escape in breast cancer
plaincorrelational- Asserted: passes — The authors put it forward as true.
- Checkable: passes — It can be checked against evidence.
- Load-bearing: passes — The paper’s conclusions depend on it.
- Based: passes — The paper gives a reason why it holds.
It may state two separate claims as one.
A result the paper reports from its own data — it cites no other source for it, so there is none to check. The quote shows it is in the paper.
In the paper
“Among them, IFNG (IFNγ) was one of the top genes downregulated in hypoxia and was consistently downregulated in all three donors.”
§ Hypoxia induces HIF1α-dependent epigenetic vulnerability in triple negative breast cancer to confer immune effector dysfunction and resistance to anti-PD-1 immunotherapy > Results > Hypoxia induces T cell dysfunction, which upon further antigen stimulation, drives towards an exhaustion-like state
plaindirectn = 3- Asserted: passes — The authors put it forward as true.
- Checkable: passes — It can be checked against evidence.
- Load-bearing: unclear — It is unclear whether the paper’s conclusions depend on it.
- Based: passes — The paper gives a reason why it holds.
It may state two separate claims as one.
In the paper
“The data analysis showed that hypoxia treatment resulted in substantial transcriptional changes in T cells. These included marked downregulation of a cohort of cytokines expression, one of the critical hallmark features of T cell exhaustion25, accompanied by upregulation of genes enriched in the hypoxia pathway (Fig. 2d, e; twofold change, p < 0.01 as cutoffs).”
§ Hypoxia induces HIF1α-dependent epigenetic vulnerability in triple negative breast cancer to confer immune effector dysfunction and resistance to anti-PD-1 immunotherapy > Results > Hypoxia induces T cell dysfunction, which upon further antigen stimulation, drives towards an exhaustion-like state
What the sources say
- Not checked yetcites [25] Collier, J. L., Weiss, S. A., Pauken, K. E., Sen, D. R. & Sharpe, A. H. Not-so-opposite ends of the spectrum: CD8(+) T cell dysfunction across chronic infection, cancer and autoimmunity. Nat. Immunol. 22, 809–819 (2021). source
plaindirectn = 3 ·- Asserted: passes — The authors put it forward as true.
- Checkable: passes — It can be checked against evidence.
- Load-bearing: passes — The paper’s conclusions depend on it.
- Based: passes — The paper gives a reason why it holds.
It may state two separate claims as one.
A result the paper reports from its own data — it cites no other source for it, so there is none to check. The quote shows it is in the paper.
In the paper
“Interestingly, hypoxia significantly induced TIM-3 and TIGIT protein expression, though it did not affect the classic checkpoint molecules PD-1 and CTLA-4 (Fig. 2f).”
§ Hypoxia induces HIF1α-dependent epigenetic vulnerability in triple negative breast cancer to confer immune effector dysfunction and resistance to anti-PD-1 immunotherapy > Results > Hypoxia induces T cell dysfunction, which upon further antigen stimulation, drives towards an exhaustion-like state
plaindirect- Asserted: passes — The authors put it forward as true.
- Checkable: passes — It can be checked against evidence.
- Load-bearing: passes — The paper’s conclusions depend on it.
- Based: passes — The paper gives a reason why it holds.
It may state two separate claims as one.
A result the paper reports from its own data — it cites no other source for it, so there is none to check. The quote shows it is in the paper.
In the paper
“Of notice, hypoxia-induced suppression of immune effectors occurred across all the subsets of CD8+ cells, despite more obvious in effector subsets (both Tem and Teff) (Fig. S2e), indicating that hypoxia can induce effector suppression regardless of T cell differentiation.”
§ Hypoxia induces HIF1α-dependent epigenetic vulnerability in triple negative breast cancer to confer immune effector dysfunction and resistance to anti-PD-1 immunotherapy > Results > Hypoxia induces T cell dysfunction, which upon further antigen stimulation, drives towards an exhaustion-like state
plaindirect- Asserted: passes — The authors put it forward as true.
- Checkable: passes — It can be checked against evidence.
- Load-bearing: unclear — It is unclear whether the paper’s conclusions depend on it.
- Based: passes — The paper gives a reason why it holds.
It may state two separate claims as one.
A result the paper reports from its own data — it cites no other source for it, so there is none to check. The quote shows it is in the paper.
In the paper
“Consistent with this hypothesis, we see that HDAC inhibition by HDAC inhibitor ENT or EZH2 inhibition by EPZ reversed the hypoxia-induced changes in H3K27ac and H3K27me3 at IFNG (Fig. 3f).”
§ Hypoxia induces HIF1α-dependent epigenetic vulnerability in triple negative breast cancer to confer immune effector dysfunction and resistance to anti-PD-1 immunotherapy > Results > Hypoxia induces chromatin remodeling to suppress immune effector gene expression in T and NK cells
plaindirect- Asserted: passes — The authors put it forward as true.
- Checkable: passes — It can be checked against evidence.
- Load-bearing: passes — The paper’s conclusions depend on it.
- Based: passes — The paper gives a reason why it holds.
It may state two separate claims as one.
A result the paper reports from its own data — it cites no other source for it, so there is none to check. The quote shows it is in the paper.
In the paper
“Corresponding to the increased HDAC1 enrichment in hypoxia, H3K27ac at IFNG and TNF showed decreased enrichment in hypoxia while H3K27me3 enrichment was increased (Fig. 3e and Fig. S3d).”
§ Hypoxia induces HIF1α-dependent epigenetic vulnerability in triple negative breast cancer to confer immune effector dysfunction and resistance to anti-PD-1 immunotherapy > Results > Hypoxia induces chromatin remodeling to suppress immune effector gene expression in T and NK cells
plaindirect- Asserted: passes — The authors put it forward as true.
- Checkable: passes — It can be checked against evidence.
- Load-bearing: passes — The paper’s conclusions depend on it.
- Based: passes — The paper gives a reason why it holds.
It may state two separate claims as one.
A result the paper reports from its own data — it cites no other source for it, so there is none to check. The quote shows it is in the paper.
In the paper
“Hypoxia-induced suppression of effector expression and upregulation of TIM-3 was also observed in NK cells isolated from PBMC (Fig. S2g, h), though the effect on TIGIT was not so obvious upon coculture with TNBC (Fig. S2h).”
§ Hypoxia induces HIF1α-dependent epigenetic vulnerability in triple negative breast cancer to confer immune effector dysfunction and resistance to anti-PD-1 immunotherapy > Results > Hypoxia induces T cell dysfunction, which upon further antigen stimulation, drives towards an exhaustion-like state
plaindirect- Asserted: passes — The authors put it forward as true.
- Checkable: passes — It can be checked against evidence.
- Load-bearing: unclear — It is unclear whether the paper’s conclusions depend on it.
- Based: passes — The paper gives a reason why it holds.
It may state two separate claims as one.
A result the paper reports from its own data — it cites no other source for it, so there is none to check. The quote shows it is in the paper.
In the paper
“Interestingly, EZH2 and its PRC2 partner SUZ12 already showed a significant enrichment at IFNG in normoxia, indicating a pre-existing PRC2 complex at IFNG, and hypoxia did not further increase their enrichments (Fig. 3d).”
§ Hypoxia induces HIF1α-dependent epigenetic vulnerability in triple negative breast cancer to confer immune effector dysfunction and resistance to anti-PD-1 immunotherapy > Results > Hypoxia induces chromatin remodeling to suppress immune effector gene expression in T and NK cells
hedged- Asserted: passes — The authors put it forward as true.
- Checkable: passes — It can be checked against evidence.
- Load-bearing: passes — The paper’s conclusions depend on it.
- Based: passes — The paper gives a reason why it holds.
It may state two separate claims as one.
A result the paper reports from its own data — it cites no other source for it, so there is none to check. The quote shows it is in the paper.
In the paper
“Of note, hypoxia did not change the bulk expression levels of HDACs, EZH2, SUZ12, and EED (Fig. S4d), nor the global levels of H3K27me3 and H3K27ac in T and NK cells (Fig. S4d).”
§ Hypoxia induces HIF1α-dependent epigenetic vulnerability in triple negative breast cancer to confer immune effector dysfunction and resistance to anti-PD-1 immunotherapy > Results > Hypoxia induces chromatin remodeling to suppress immune effector gene expression in T and NK cells
plain- Asserted: passes — The authors put it forward as true.
- Checkable: passes — It can be checked against evidence.
- Load-bearing: passes — The paper’s conclusions depend on it.
- Based: passes — The paper gives a reason why it holds.
It may state two separate claims as one.
A result the paper reports from its own data — it cites no other source for it, so there is none to check. The quote shows it is in the paper.
In the paper
“Further validation using CRISPR-mediated depletion of HDAC1 or EZH2 recapitulated the effect of ENT or EPZ and restored effector gene expression in T and NK cells (Fig. S4a, b, Fig. 3g, and Fig. S4c).”
§ Hypoxia induces HIF1α-dependent epigenetic vulnerability in triple negative breast cancer to confer immune effector dysfunction and resistance to anti-PD-1 immunotherapy > Results > Hypoxia induces chromatin remodeling to suppress immune effector gene expression in T and NK cells
plaindirect- Asserted: passes — The authors put it forward as true.
- Checkable: passes — It can be checked against evidence.
- Load-bearing: passes — The paper’s conclusions depend on it.
- Based: passes — The paper gives a reason why it holds.
It may state two separate claims as one.
A result the paper reports from its own data — it cites no other source for it, so there is none to check. The quote shows it is in the paper.
In the paper
“Scanning the promoter regions across −1.5 to 1 Kb of TSS of IFNG and TNF showed that although with minimum enrichments of HDACs in normoxia, hypoxia treatment resulted in higher HDAC1 enrichment at both IFNG and TNF, though without affecting HDAC2 and HDAC3 (Fig. 3d and Fig. S3c).”
§ Hypoxia induces HIF1α-dependent epigenetic vulnerability in triple negative breast cancer to confer immune effector dysfunction and resistance to anti-PD-1 immunotherapy > Results > Hypoxia induces chromatin remodeling to suppress immune effector gene expression in T and NK cells
plaindirect- Asserted: passes — The authors put it forward as true.
- Checkable: passes — It can be checked against evidence.
- Load-bearing: passes — The paper’s conclusions depend on it.
- Based: passes — The paper gives a reason why it holds.
It may state two separate claims as one.
A result the paper reports from its own data — it cites no other source for it, so there is none to check. The quote shows it is in the paper.
In the paper
“We also found that neither hypoxic culture nor the drug treatment significantly affects the viability of T cells within a time course of 6 days (Fig. S6c).”
§ Hypoxia induces HIF1α-dependent epigenetic vulnerability in triple negative breast cancer to confer immune effector dysfunction and resistance to anti-PD-1 immunotherapy > Results > Hypoxia-induced epigenetic inactivation of effector genes is HIF1α-dependent
plain- Asserted: passes — The authors put it forward as true.
- Checkable: passes — It can be checked against evidence.
- Load-bearing: unclear — It is unclear whether the paper’s conclusions depend on it.
- Based: passes — The paper gives a reason why it holds.
It may state two separate claims as one.
A result the paper reports from its own data — it cites no other source for it, so there is none to check. The quote shows it is in the paper.
In the paper
“HDAC1, but not HIF1α, was also found in SUZ12 pulldown (Fig. 4b).”
§ Hypoxia induces HIF1α-dependent epigenetic vulnerability in triple negative breast cancer to confer immune effector dysfunction and resistance to anti-PD-1 immunotherapy > Results > Hypoxia-induced epigenetic inactivation of effector genes is HIF1α-dependent
plain- Asserted: passes — The authors put it forward as true.
- Checkable: passes — It can be checked against evidence.
- Load-bearing: unclear — It is unclear whether the paper’s conclusions depend on it.
- Based: passes — The paper gives a reason why it holds.
It may state two separate claims as one.
A result the paper reports from its own data — it cites no other source for it, so there is none to check. The quote shows it is in the paper.
In the paper
“By contrast, in the absence of immune cells, neither hypoxia nor the above drugs altered the IRF1 and PD-L1 expression and the viability of the two TNBC cell lines (Fig. S7g, h).”
§ Hypoxia induces HIF1α-dependent epigenetic vulnerability in triple negative breast cancer to confer immune effector dysfunction and resistance to anti-PD-1 immunotherapy > Results > Hypoxia impairs the immune cell cytotoxicity, reduces interferon signaling response, and confers resistance to anti-PD-1 blockade
plainn = 2- Asserted: passes — The authors put it forward as true.
- Checkable: passes — It can be checked against evidence.
- Load-bearing: passes — The paper’s conclusions depend on it.
- Based: passes — The paper gives a reason why it holds.
It may state two separate claims as one.
A result the paper reports from its own data — it cites no other source for it, so there is none to check. The quote shows it is in the paper.
In the paper
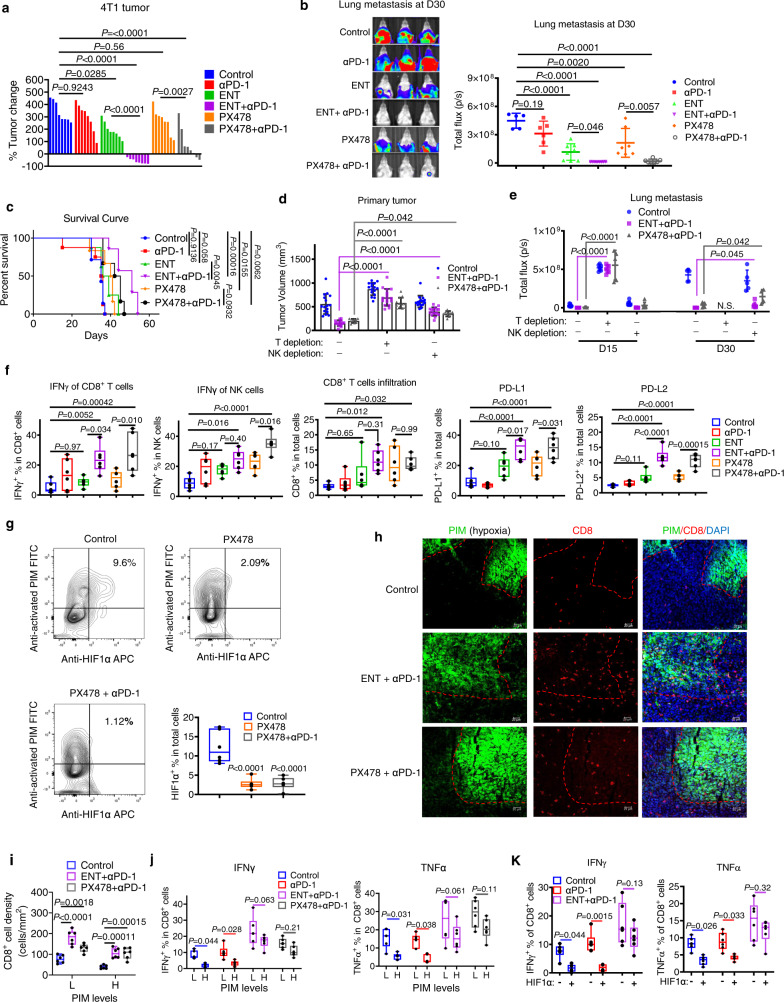
“Hypoxia also weakened the mouse T cell cytotoxicity and anti-PD-1 response towards 4T1”
§ Hypoxia induces HIF1α-dependent epigenetic vulnerability in triple negative breast cancer to confer immune effector dysfunction and resistance to anti-PD-1 immunotherapy > Results > Targeting HIF1α and associated epigenetic dependency overcomes resistance to PD-1 blockade in both syngeneic and humanized mouse models
plaindirect- Asserted: passes — The authors put it forward as true.
- Checkable: passes — It can be checked against evidence.
- Load-bearing: passes — The paper’s conclusions depend on it.
- Based: passes — The paper gives a reason why it holds.
It may state two separate claims as one.
A result the paper reports from its own data — it cites no other source for it, so there is none to check. The quote shows it is in the paper.
In the paper
“Indeed, hypoxia-induced resistance to anti-PD-1 was reversed by PX478, ENT, and EPZ, as well as the knockdown of HIF1α, HDAC1, or EZH2 (Fig. 5e).”
§ Hypoxia induces HIF1α-dependent epigenetic vulnerability in triple negative breast cancer to confer immune effector dysfunction and resistance to anti-PD-1 immunotherapy > Results > Hypoxia impairs the immune cell cytotoxicity, reduces interferon signaling response, and confers resistance to anti-PD-1 blockade
plaindirect- Asserted: passes — The authors put it forward as true.
- Checkable: passes — It can be checked against evidence.
- Load-bearing: passes — The paper’s conclusions depend on it.
- Based: passes — The paper gives a reason why it holds.
It may state two separate claims as one.
A result the paper reports from its own data — it cites no other source for it, so there is none to check. The quote shows it is in the paper.
In the paper
“the combination treatments reversed the hypoxic effect and promoted the effector T cell infiltration into the hypoxic region (Fig. 6h, i).”
§ Hypoxia induces HIF1α-dependent epigenetic vulnerability in triple negative breast cancer to confer immune effector dysfunction and resistance to anti-PD-1 immunotherapy > Results > Targeting HIF1α and associated epigenetic dependency overcomes resistance to PD-1 blockade in both syngeneic and humanized mouse models
plaindirect- Asserted: passes — The authors put it forward as true.
- Checkable: passes — It can be checked against evidence.
- Load-bearing: passes — The paper’s conclusions depend on it.
- Based: passes — The paper gives a reason why it holds.
It may state two separate claims as one.
A result the paper reports from its own data — it cites no other source for it, so there is none to check. The quote shows it is in the paper.
In the paper
“but combinations with ENT or PX478 restored the expression of IFNγ and TNFα in CD8+ TILs and blunted the hypoxic effect (Fig. 6j).”
§ Hypoxia induces HIF1α-dependent epigenetic vulnerability in triple negative breast cancer to confer immune effector dysfunction and resistance to anti-PD-1 immunotherapy > Results > Targeting HIF1α and associated epigenetic dependency overcomes resistance to PD-1 blockade in both syngeneic and humanized mouse models
plaindirect- Asserted: passes — The authors put it forward as true.
- Checkable: passes — It can be checked against evidence.
- Load-bearing: passes — The paper’s conclusions depend on it.
- Based: passes — The paper gives a reason why it holds.
It may state two separate claims as one.
A result the paper reports from its own data — it cites no other source for it, so there is none to check. The quote shows it is in the paper.
In the paper
“T cell depletion also markedly promoted lung metastasis and abolished the drug combination effects on metastasis”
§ Hypoxia induces HIF1α-dependent epigenetic vulnerability in triple negative breast cancer to confer immune effector dysfunction and resistance to anti-PD-1 immunotherapy > Results > Targeting HIF1α and associated epigenetic dependency overcomes resistance to PD-1 blockade in both syngeneic and humanized mouse models
plaindirect- Asserted: passes — The authors put it forward as true.
- Checkable: passes — It can be checked against evidence.
- Load-bearing: passes — The paper’s conclusions depend on it.
- Based: passes — The paper gives a reason why it holds.
It may state two separate claims as one.
A result the paper reports from its own data — it cites no other source for it, so there is none to check. The quote shows it is in the paper.
In the paper
“EPZ combined with anti-PD-1 also improved the effect on tumor growth and metastasis, though the effects were less potent than PX478 and ENT (Fig. S9b, c)”
§ Hypoxia induces HIF1α-dependent epigenetic vulnerability in triple negative breast cancer to confer immune effector dysfunction and resistance to anti-PD-1 immunotherapy > Results > Targeting HIF1α and associated epigenetic dependency overcomes resistance to PD-1 blockade in both syngeneic and humanized mouse models
plaindirect- Asserted: passes — The authors put it forward as true.
- Checkable: passes — It can be checked against evidence.
- Load-bearing: unclear — It is unclear whether the paper’s conclusions depend on it.
- Based: passes — The paper gives a reason why it holds.
It may state two separate claims as one.
A result the paper reports from its own data — it cites no other source for it, so there is none to check. The quote shows it is in the paper.
In the paper
“We found that hypoxia induces HIF1α and HDAC1 co-occupancy at the effector genes, leading to reductions of H3K27ac and increases of H3K27me3 through a pre-existing PRC2 presence effector gene loci, and suppressed effector gene expression in both T and NK cells.”
§ Hypoxia induces HIF1α-dependent epigenetic vulnerability in triple negative breast cancer to confer immune effector dysfunction and resistance to anti-PD-1 immunotherapy > Discussion
plaindirect- Asserted: passes — The authors put it forward as true.
- Checkable: passes — It can be checked against evidence.
- Load-bearing: passes — The paper’s conclusions depend on it.
- Based: passes — The paper gives a reason why it holds.
It may state two separate claims as one.
A result the paper reports from its own data — it cites no other source for it, so there is none to check. The quote shows it is in the paper.
In the paper
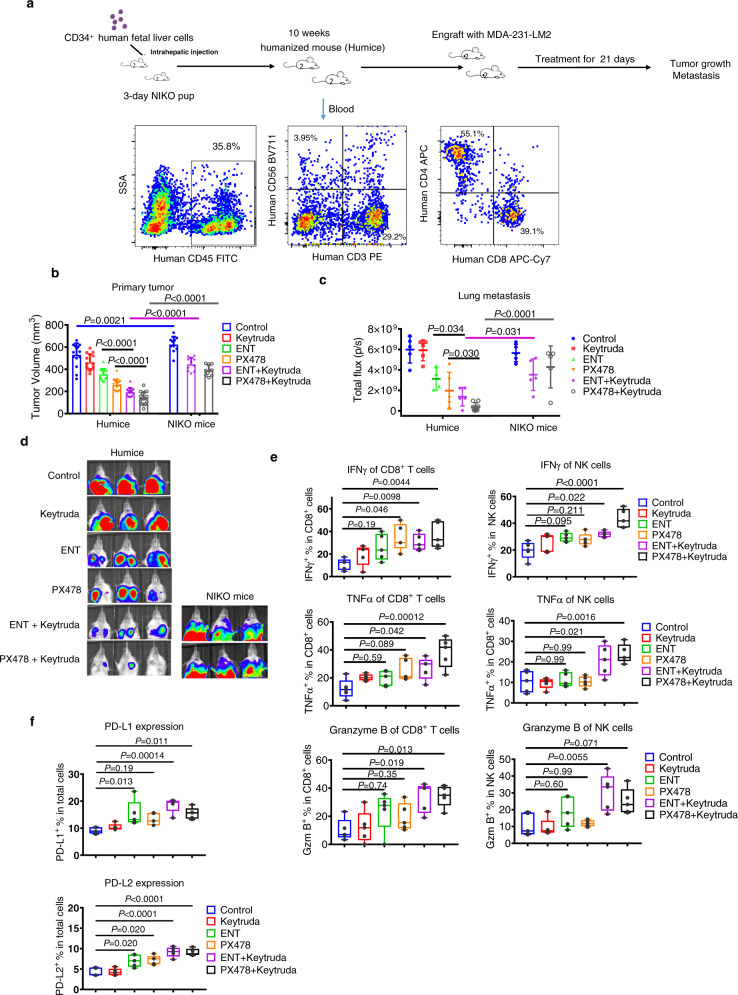
“In both syngeneic and humanized mouse models, PD-1 blockade plus inhibition of HIF1α or HDAC1 is sufficient to increase intratumoral expression of effector genes on CD8+ T cells and NK cells and IFNγ production in tumors that showed a regressive response.”
§ Hypoxia induces HIF1α-dependent epigenetic vulnerability in triple negative breast cancer to confer immune effector dysfunction and resistance to anti-PD-1 immunotherapy > Discussion
plaindirect- Asserted: passes — The authors put it forward as true.
- Checkable: passes — It can be checked against evidence.
- Load-bearing: passes — The paper’s conclusions depend on it.
- Based: passes — The paper gives a reason why it holds.
It may state two separate claims as one.
A result the paper reports from its own data — it cites no other source for it, so there is none to check. The quote shows it is in the paper.
In the paper
“we have validated that the combination treatments significantly promoted CD8+ T cell infiltration in hypoxic tumor areas and increased IFNγ expression in the intratumoral CD8+ T and NK cells.”
§ Hypoxia induces HIF1α-dependent epigenetic vulnerability in triple negative breast cancer to confer immune effector dysfunction and resistance to anti-PD-1 immunotherapy > Discussion
boosteddirect- Asserted: passes — The authors put it forward as true.
- Checkable: passes — It can be checked against evidence.
- Load-bearing: passes — The paper’s conclusions depend on it.
- Based: passes — The paper gives a reason why it holds.
It may state two separate claims as one.
None of the sources cited for this claim have been checked yet.
In the paper
“Paradoxically, despite strong immunogenicity and a higher prevalence of tumor-infiltrating lymphocytes (TILs) in TNBC3, patients often progress to metastasis with poor clinical outcomes1.”
§ Hypoxia induces HIF1α-dependent epigenetic vulnerability in triple negative breast cancer to confer immune effector dysfunction and resistance to anti-PD-1 immunotherapy > Introduction
What the sources say
- Not checked yetcites [3] Liu, Z., Li, M., Jiang, Z. & Wang, X. A comprehensive immunologic portrait of triple-negative breast cancer. Transl. oncol. 11, 311–329 (2018). source
- Not checked yetcites [1] Bianchini, G., Balko, J. M., Mayer, I. A., Sanders, M. E. & Gianni, L. Triple-negative breast cancer: challenges and opportunities of a heterogeneous disease. Nat. Rev. Clin. Oncol. 13, 674–690 (2016). source
plaincorrelational- Asserted: passes — The authors put it forward as true.
- Checkable: passes — It can be checked against evidence.
- Load-bearing: passes — The paper’s conclusions depend on it.
- Based: passes — The paper gives a reason why it holds.
It may state two separate claims as one.
None of the sources cited for this claim have been checked yet.
In the paper
“Nevertheless, there are also contradictory reports showing the role of hypoxia in potentiating the activity of cytotoxic T cells, though these studies were mainly conducted in mouse models22–24.”
§ Hypoxia induces HIF1α-dependent epigenetic vulnerability in triple negative breast cancer to confer immune effector dysfunction and resistance to anti-PD-1 immunotherapy > Introduction
What the sources say
- Not checked yetcites [22] Doedens, A. L. et al. Hypoxia-inducible factors enhance the effector responses of CD8(+) T cells to persistent antigen. Nat. Immunol. 14, 1173–1182 (2013). source
- Not checked yetcites [23] Palazon, A. et al. An HIF-1alpha/VEGF-A axis in cytotoxic T cells regulates tumor progression. Cancer Cell 32, 669–683 e665 (2017). source
- Not checked yetcites [24] Labiano, S. et al. CD69 is a direct HIF-1alpha target gene in hypoxia as a mechanism enhancing expression on tumor-infiltrating T lymphocytes. Oncoimmunology 6, e1283468 (2017). source
plaindirect- Asserted: passes — The authors put it forward as true.
- Checkable: passes — It can be checked against evidence.
- Load-bearing: fails — The paper’s conclusions may not depend on it.
- Based: passes — The paper gives a reason why it holds.
Probably not a substantial claim. The paper’s conclusions may not depend on it. It may state two separate claims as one.
In the paper
“Tumor-infiltrating T cell terminal exhaustion resulting from chronic and continuous tumor antigen stimulation is the primary factor contributing to immune evasion and resistance to cancer immunotherapy25.”
§ Hypoxia induces HIF1α-dependent epigenetic vulnerability in triple negative breast cancer to confer immune effector dysfunction and resistance to anti-PD-1 immunotherapy > Introduction
What the sources say
- Not checked yetcites [25] Collier, J. L., Weiss, S. A., Pauken, K. E., Sen, D. R. & Sharpe, A. H. Not-so-opposite ends of the spectrum: CD8(+) T cell dysfunction across chronic infection, cancer and autoimmunity. Nat. Immunol. 22, 809–819 (2021). source
plaindirect- Asserted: passes — The authors put it forward as true.
- Checkable: passes — It can be checked against evidence.
- Load-bearing: fails — The paper’s conclusions may not depend on it.
- Based: passes — The paper gives a reason why it holds.
Probably not a substantial claim. The paper’s conclusions may not depend on it.
A conclusion the paper draws from its own results — it cites no other source for it, so there is none to check. The quote shows it is in the paper.
In the paper
“Together, these findings support that hypoxia has a role in immune exclusion in TNBC and is associated with poor disease outcomes.”
§ Hypoxia induces HIF1α-dependent epigenetic vulnerability in triple negative breast cancer to confer immune effector dysfunction and resistance to anti-PD-1 immunotherapy > Results > Hypoxia is associated with immune escape in breast cancer
plaincorrelational- Asserted: passes — The authors put it forward as true.
- Checkable: passes — It can be checked against evidence.
- Load-bearing: passes — The paper’s conclusions depend on it.
- Based: passes — The paper gives a reason why it holds.
It may state two separate claims as one.
A conclusion the paper draws from its own results — it cites no other source for it, so there is none to check. The quote shows it is in the paper.
In the paper
“Therefore, hypoxia triggered an epigenetic remodeling and HDAC1/PRC2 concurrent dependency, resulting in effector gene suppression.”
§ Hypoxia induces HIF1α-dependent epigenetic vulnerability in triple negative breast cancer to confer immune effector dysfunction and resistance to anti-PD-1 immunotherapy > Results > Hypoxia induces chromatin remodeling to suppress immune effector gene expression in T and NK cells
plaindirect- Asserted: passes — The authors put it forward as true.
- Checkable: passes — It can be checked against evidence.
- Load-bearing: passes — The paper’s conclusions depend on it.
- Based: passes — The paper gives a reason why it holds.
It may state two separate claims as one.
A conclusion the paper draws from its own results — it cites no other source for it, so there is none to check. The quote shows it is in the paper.
In the paper
“These findings suggest that HDAC1 interacts with HIF1α and PRC2 after hypoxia to form two distinct repressor complexes that co-occupy the effector gene promoters.”
§ Hypoxia induces HIF1α-dependent epigenetic vulnerability in triple negative breast cancer to confer immune effector dysfunction and resistance to anti-PD-1 immunotherapy > Results > Hypoxia-induced epigenetic inactivation of effector genes is HIF1α-dependent
hedgeddirect- Asserted: passes — The authors put it forward as true.
- Checkable: passes — It can be checked against evidence.
- Load-bearing: passes — The paper’s conclusions depend on it.
- Based: passes — The paper gives a reason why it holds.
It may state two separate claims as one.
A conclusion the paper draws from its own results — it cites no other source for it, so there is none to check. The quote shows it is in the paper.
In the paper
“Targeting HIF1α and the associated epigenetic machinery can reverse the immune effector dysfunction and overcome resistance to PD-1 blockade, as demonstrated both in vitro and in vivo using syngeneic and humanized mice models.”
§ Hypoxia induces HIF1α-dependent epigenetic vulnerability in triple negative breast cancer to confer immune effector dysfunction and resistance to anti-PD-1 immunotherapy > Abstract
boosteddirect- Asserted: passes — The authors put it forward as true.
- Checkable: passes — It can be checked against evidence.
- Load-bearing: passes — The paper’s conclusions depend on it.
- Based: passes — The paper gives a reason why it holds.
It may state two separate claims as one.
- Rests on an assumption: The in vitro culture system models human T cell dysfunction and exhaustion in TNBC.
A conclusion the paper draws from its own results — it cites no other source for it, so there is none to check. The quote shows it is in the paper.
In the paper
“Using an in vitro culture system modeling human T cell dysfunction and exhaustion in triple-negative breast cancer (TNBC), we find that hypoxia suppresses immune effector gene expression, including in T and NK cells, resulting in immune effector cell dysfunction and resistance to immunotherapy.”
§ Hypoxia induces HIF1α-dependent epigenetic vulnerability in triple negative breast cancer to confer immune effector dysfunction and resistance to anti-PD-1 immunotherapy > Abstract
plaindirect- Asserted: passes — The authors put it forward as true.
- Checkable: passes — It can be checked against evidence.
- Load-bearing: passes — The paper’s conclusions depend on it.
- Based: passes — The paper gives a reason why it holds.
It may state two separate claims as one.
- Rests on an assumption: The in vitro culture system models human T cell dysfunction and exhaustion in TNBC.
A conclusion the paper draws from its own results — it cites no other source for it, so there is none to check. The quote shows it is in the paper.
In the paper
“We demonstrate that hypoxia-induced factor 1α (HIF1α) interaction with HDAC1 and concurrent PRC2 dependency causes chromatin remolding resulting in epigenetic suppression of effector genes and subsequent immune dysfunction.”
§ Hypoxia induces HIF1α-dependent epigenetic vulnerability in triple negative breast cancer to confer immune effector dysfunction and resistance to anti-PD-1 immunotherapy > Abstract
boosteddirect- Asserted: passes — The authors put it forward as true.
- Checkable: passes — It can be checked against evidence.
- Load-bearing: passes — The paper’s conclusions depend on it.
- Based: passes — The paper gives a reason why it holds.
It may state two separate claims as one.
- Rests on an assumption: The in vitro culture system models human T cell dysfunction and exhaustion in TNBC.
A conclusion the paper draws from its own results — it cites no other source for it, so there is none to check. The quote shows it is in the paper.
In the paper
“Moreover, although inhibition of HIF1α, HDAC1, or EZH2 in immune cells can restore immune cytotoxicity, it also paradoxically induces PD-L1 and PD-L2 expression in tumor cells that in turn could weaken anticancer immunity.”
§ Hypoxia induces HIF1α-dependent epigenetic vulnerability in triple negative breast cancer to confer immune effector dysfunction and resistance to anti-PD-1 immunotherapy > Results > Hypoxia impairs the immune cell cytotoxicity, reduces interferon signaling response, and confers resistance to anti-PD-1 blockade
hedgeddirect- Asserted: passes — The authors put it forward as true.
- Checkable: passes — It can be checked against evidence.
- Load-bearing: passes — The paper’s conclusions depend on it.
- Based: passes — The paper gives a reason why it holds.
It may state two separate claims as one.
A conclusion the paper draws from its own results — it cites no other source for it, so there is none to check. The quote shows it is in the paper.
In the paper
“Therefore, hypoxia drives the T cell to an exhausted-like state through both HIF1α-dependent and HIF1α-independent mechanisms.”
§ Hypoxia induces HIF1α-dependent epigenetic vulnerability in triple negative breast cancer to confer immune effector dysfunction and resistance to anti-PD-1 immunotherapy > Results > Hypoxia-induced epigenetic inactivation of effector genes is HIF1α-dependent
plaindirect- Asserted: passes — The authors put it forward as true.
- Checkable: passes — It can be checked against evidence.
- Load-bearing: passes — The paper’s conclusions depend on it.
- Based: passes — The paper gives a reason why it holds.
It may state two separate claims as one.
In the paper
“interferon signaling is of central importance to antitumor immune response43.”
§ Hypoxia induces HIF1α-dependent epigenetic vulnerability in triple negative breast cancer to confer immune effector dysfunction and resistance to anti-PD-1 immunotherapy > Results > Hypoxia impairs the immune cell cytotoxicity, reduces interferon signaling response, and confers resistance to anti-PD-1 blockade
What the sources say
- Not checked yetcites [43] Benci, J. L. et al. Tumor interferon signaling regulates a multigenic resistance program to immune checkpoint blockade. Cell 167, 1540–1554 e1512 (2016). source
plain- Asserted: passes — The authors put it forward as true.
- Checkable: passes — It can be checked against evidence.
- Load-bearing: passes — The paper’s conclusions depend on it.
- Based: passes — The paper gives a reason why it holds.
Probably not a substantial claim.
None of the sources cited for this claim have been checked yet.
In the paper
“the 4T1 xenograft tumor is also known to be highly hypoxic and resistant to PD-1 blockade treatment44,45.”
§ Hypoxia induces HIF1α-dependent epigenetic vulnerability in triple negative breast cancer to confer immune effector dysfunction and resistance to anti-PD-1 immunotherapy > Results > Targeting HIF1α and associated epigenetic dependency overcomes resistance to PD-1 blockade in both syngeneic and humanized mouse models
What the sources say
- Not checked yetcites [44] Cao, Y. et al. Observation of incipient tumor angiogenesis that is independent of hypoxia and hypoxia inducible factor-1 activation. Cancer Res. 65, 5498–5505 (2005). source
- Not checked yetcites [45] Booth, L. et al. HDAC inhibitors enhance neratinib activity and when combined enhance the actions of an anti-PD-1 immunomodulatory antibody in vivo. Oncotarget 8, 90262–90277 (2017). source
boostedcorrelational- Asserted: passes — The authors put it forward as true.
- Checkable: passes — It can be checked against evidence.
- Load-bearing: passes — The paper’s conclusions depend on it.
- Based: passes — The paper gives a reason why it holds.
It may state two separate claims as one.
In the paper
“which is an ideal xenograft model for studying tumor growth and lung metastasis47.”
§ Hypoxia induces HIF1α-dependent epigenetic vulnerability in triple negative breast cancer to confer immune effector dysfunction and resistance to anti-PD-1 immunotherapy > Results > Targeting HIF1α and associated epigenetic dependency overcomes resistance to PD-1 blockade in both syngeneic and humanized mouse models
What the sources say
- Not checked yetcites [47] Minn, A. J. et al. Genes that mediate breast cancer metastasis to lung. Nature 436, 518–524 (2005). source
plain- Asserted: passes — The authors put it forward as true.
- Checkable: passes — It can be checked against evidence.
- Load-bearing: fails — The paper’s conclusions may not depend on it.
- Based: passes — The paper gives a reason why it holds.
Probably not a substantial claim. The paper’s conclusions may not depend on it.
None of the sources cited for this claim have been checked yet.
In the paper
“While some studies have shown that hypoxia promotes mouse T cell cytotoxicity22,23”
§ Hypoxia induces HIF1α-dependent epigenetic vulnerability in triple negative breast cancer to confer immune effector dysfunction and resistance to anti-PD-1 immunotherapy > Discussion
What the sources say
- Not checked yetcites [22] Doedens, A. L. et al. Hypoxia-inducible factors enhance the effector responses of CD8(+) T cells to persistent antigen. Nat. Immunol. 14, 1173–1182 (2013). source
- Not checked yetcites [23] Palazon, A. et al. An HIF-1alpha/VEGF-A axis in cytotoxic T cells regulates tumor progression. Cancer Cell 32, 669–683 e665 (2017). source
hedgeddirect- Asserted: passes — The authors put it forward as true.
- Checkable: passes — It can be checked against evidence.
- Load-bearing: fails — The paper’s conclusions may not depend on it.
- Based: passes — The paper gives a reason why it holds.
Probably not a substantial claim. The paper’s conclusions may not depend on it.
A conclusion the paper draws from its own results — it cites no other source for it, so there is none to check. The quote shows it is in the paper.
In the paper
“In the present study, we demonstrate that hypoxia suppresses immune effector activity through epigenetic reprogramming, which, together with continuous antigen stimulation, is crucial to developing immune exhaustion and resistance to immunotherapy.”
§ Hypoxia induces HIF1α-dependent epigenetic vulnerability in triple negative breast cancer to confer immune effector dysfunction and resistance to anti-PD-1 immunotherapy > Discussion
boosteddirect- Asserted: passes — The authors put it forward as true.
- Checkable: passes — It can be checked against evidence.
- Load-bearing: passes — The paper’s conclusions depend on it.
- Based: passes — The paper gives a reason why it holds.
It may state two separate claims as one.
- Rests on an assumption: The role of hypoxia in modulating cancer immunity and the corresponding mechanism remains unclear.
None of the sources cited for this claim have been checked yet.
In the paper
“Hypoxia plays a crucial role in tumor growth, metastasis, and drug resistance in solid tumors8,9”
§ Hypoxia induces HIF1α-dependent epigenetic vulnerability in triple negative breast cancer to confer immune effector dysfunction and resistance to anti-PD-1 immunotherapy > Discussion
What the sources say
- Not checked yetcites [8] Chaturvedi, P., Gilkes, D. M., Takano, N. & Semenza, G. L. Hypoxia-inducible factor-dependent signaling between triple-negative breast cancer cells and mesenchymal stem cells promotes macrophage recruitment. Proc. Natl Acad. Sci. USA 111, E2120–E2129 (2014). source
- Not checked yetcites [9] Rankin, E. B. & Giaccia, A. J. Hypoxic control of metastasis. Science 352, 175–180 (2016). source
plaindirect- Asserted: passes — The authors put it forward as true.
- Checkable: passes — It can be checked against evidence.
- Load-bearing: passes — The paper’s conclusions depend on it.
- Based: passes — The paper gives a reason why it holds.
Probably not a substantial claim. It may state two separate claims as one.
In the paper
“A recent study has shown that ectopic HIF1α overexpression in mouse T cells diminished the antitumor activity in an adoptive-transfer model50.”
§ Hypoxia induces HIF1α-dependent epigenetic vulnerability in triple negative breast cancer to confer immune effector dysfunction and resistance to anti-PD-1 immunotherapy > Discussion
What the sources say
- Not checked yetcites [50] Veliça, P. et al. Modified hypoxia-inducible factor expression in CD8+ T cells increases antitumor efficacy. Cancer Immunol. Res. 9, 401–414 (2021). source
plaindirect- Asserted: passes — The authors put it forward as true.
- Checkable: passes — It can be checked against evidence.
- Load-bearing: fails — The paper’s conclusions may not depend on it.
- Based: passes — The paper gives a reason why it holds.
Probably not a substantial claim. The paper’s conclusions may not depend on it.
None of the sources cited for this claim have been checked yet.
In the paper
“there are also opposite reports showing that tumor hypoxia induces mouse T cell exhaustion and resistance to immunotherapy and depletion of HIF1α increases NK cell activity and tumor infiltration16,17,19,48,49.”
§ Hypoxia induces HIF1α-dependent epigenetic vulnerability in triple negative breast cancer to confer immune effector dysfunction and resistance to anti-PD-1 immunotherapy > Discussion
What the sources say
- Not checked yetcites [16] Jayaprakash, P. et al. Targeted hypoxia reduction restores T cell infiltration and sensitizes prostate cancer to immunotherapy. J. Clin. Invest. 128, 5137–5149 (2018). source
- Not checked yetcites [17] Ni, J. et al. Single-cell RNA sequencing of tumor-infiltrating NK cells reveals that inhibition of transcription factor HIF-1alpha unleashes NK cell activity. Immunity 52, 1075–1087 e1078 (2020). source
- Not checked yetcites [19] Scharping, N. E. et al. Mitochondrial stress induced by continuous stimulation under hypoxia rapidly drives T cell exhaustion. Nat. Immunol. 22, 205–215 (2021). source
plaindirect- Asserted: passes — The authors put it forward as true.
- Checkable: passes — It can be checked against evidence.
- Load-bearing: fails — The paper’s conclusions may not depend on it.
- Based: passes — The paper gives a reason why it holds.
Probably not a substantial claim. The paper’s conclusions may not depend on it. It may state two separate claims as one.
None of the sources cited for this claim have been checked yet.
In the paper
“Current studies have focused on the role of hypoxia-induced metabolic reprogramming in causing T cell dysfunction and exhaustion16,19,52–55.”
§ Hypoxia induces HIF1α-dependent epigenetic vulnerability in triple negative breast cancer to confer immune effector dysfunction and resistance to anti-PD-1 immunotherapy > Discussion
What the sources say
- Not checked yetcites [16] Jayaprakash, P. et al. Targeted hypoxia reduction restores T cell infiltration and sensitizes prostate cancer to immunotherapy. J. Clin. Invest. 128, 5137–5149 (2018). source
- Not checked yetcites [19] Scharping, N. E. et al. Mitochondrial stress induced by continuous stimulation under hypoxia rapidly drives T cell exhaustion. Nat. Immunol. 22, 205–215 (2021). source
- Not checked yetcites [52] Scharping, N. E., Menk, A. V., Whetstone, R. D., Zeng, X. & Delgoffe, G. M. Efficacy of PD-1 blockade is potentiated by metformin-induced reduction of tumor hypoxia. Cancer Immunol. Res. 5, 9–16 (2017). source
plaindirect- Asserted: passes — The authors put it forward as true.
- Checkable: passes — It can be checked against evidence.
- Load-bearing: fails — The paper’s conclusions may not depend on it.
- Based: passes — The paper gives a reason why it holds.
Probably not a substantial claim. The paper’s conclusions may not depend on it.
In the paper
“a recent study showed that hypoxia and continued antigen stimulation could induce mitochondrial stress in mouse T cells, leading to terminal exhaustion but in a HIF1α-independent manner19.”
§ Hypoxia induces HIF1α-dependent epigenetic vulnerability in triple negative breast cancer to confer immune effector dysfunction and resistance to anti-PD-1 immunotherapy > Discussion
What the sources say
- Not checked yetcites [19] Scharping, N. E. et al. Mitochondrial stress induced by continuous stimulation under hypoxia rapidly drives T cell exhaustion. Nat. Immunol. 22, 205–215 (2021). source
plaindirect- Asserted: passes — The authors put it forward as true.
- Checkable: passes — It can be checked against evidence.
- Load-bearing: fails — The paper’s conclusions may not depend on it.
- Based: passes — The paper gives a reason why it holds.
Probably not a substantial claim. The paper’s conclusions may not depend on it.
A conclusion the paper draws from its own results — it cites no other source for it, so there is none to check. The quote shows it is in the paper.
In the paper
“Importantly, in both in vitro and in vivo syngeneic and humanized models, we show that targeting the HIF1α-dependent epigenetic mechanism seems sufficient to rescue the T cell dysfunction and sensitizes to PD-1 blockade.”
§ Hypoxia induces HIF1α-dependent epigenetic vulnerability in triple negative breast cancer to confer immune effector dysfunction and resistance to anti-PD-1 immunotherapy > Discussion
hedgedconditional- Asserted: passes — The authors put it forward as true.
- Checkable: passes — It can be checked against evidence.
- Load-bearing: passes — The paper’s conclusions depend on it.
- Based: passes — The paper gives a reason why it holds.
It may state two separate claims as one.
A conclusion the paper draws from its own results — it cites no other source for it, so there is none to check. The quote shows it is in the paper.
In the paper
“which holds very promising potential in the future treatment of metastatic TNBC.”
§ Hypoxia induces HIF1α-dependent epigenetic vulnerability in triple negative breast cancer to confer immune effector dysfunction and resistance to anti-PD-1 immunotherapy > Discussion
boosted- Asserted: passes — The authors put it forward as true.
- Checkable: fails — It may be too vague to check against evidence.
- Load-bearing: passes — The paper’s conclusions depend on it.
- Based: passes — The paper gives a reason why it holds.
Probably not a substantial claim. It may be too vague to check against evidence.
A conclusion the paper draws from its own results — it cites no other source for it, so there is none to check. The quote shows it is in the paper.
In the paper
“Our in vitro system for studying human immune cell activity shows that hypoxia can induce HIF1α-dependent epigenetic events to directly suppress immune effector expression in both T and NK cells, leading to impaired immune effector dysfunction.”
§ Hypoxia induces HIF1α-dependent epigenetic vulnerability in triple negative breast cancer to confer immune effector dysfunction and resistance to anti-PD-1 immunotherapy > Discussion
plaindirect- Asserted: passes — The authors put it forward as true.
- Checkable: passes — It can be checked against evidence.
- Load-bearing: passes — The paper’s conclusions depend on it.
- Based: passes — The paper gives a reason why it holds.
It may state two separate claims as one.
A conclusion the paper draws from its own results — it cites no other source for it, so there is none to check. The quote shows it is in the paper.
In the paper
“and targeting this pathway through either genetic depletion or therapeutic intervention may be helpful to overcome immune escape in TNBC where immune checkpoint immunotherapies have limited response.”
§ Hypoxia induces HIF1α-dependent epigenetic vulnerability in triple negative breast cancer to confer immune effector dysfunction and resistance to anti-PD-1 immunotherapy > Discussion
hedgedconditional- Asserted: passes — The authors put it forward as true.
- Checkable: passes — It can be checked against evidence.
- Load-bearing: passes — The paper’s conclusions depend on it.
- Based: passes — The paper gives a reason why it holds.
Probably not a substantial claim.
In the paper
“in a recent report, ENT plus DNA demethylation agent AZA was found to promote the migration of myeloid cells to the metastatic niche to suppress metastasis in different tumor models56.”
§ Hypoxia induces HIF1α-dependent epigenetic vulnerability in triple negative breast cancer to confer immune effector dysfunction and resistance to anti-PD-1 immunotherapy > Discussion
What the sources say
- Not checked yetcites [56] Lu, Z. et al. Epigenetic therapy inhibits metastases by disrupting premetastatic niches. Nature 579, 284–290 (2020). source
plaindirect- Asserted: passes — The authors put it forward as true.
- Checkable: passes — It can be checked against evidence.
- Load-bearing: fails — The paper’s conclusions may not depend on it.
- Based: passes — The paper gives a reason why it holds.
Probably not a substantial claim. The paper’s conclusions may not depend on it.
What the paper did — it cites no source for this, so there is none to check. The quote shows it is in the paper.
In the paper
“Immune-humanized mice reconstituted with 20–50% of human CD45+ cells were used for engraftment59.”
§ Hypoxia induces HIF1α-dependent epigenetic vulnerability in triple negative breast cancer to confer immune effector dysfunction and resistance to anti-PD-1 immunotherapy > Methods > Human CD34+ cells and NIKO, immune, and TNBC-immune-humanized mice
plain- Asserted: passes — The authors put it forward as true.
- Checkable: passes — It can be checked against evidence.
- Load-bearing: passes — The paper’s conclusions depend on it.
- Based: passes — The paper gives a reason why it holds.
Probably not a substantial claim.
What the paper did — it cites no source for this, so there is none to check. The quote shows it is in the paper.
In the paper
“All manipulations and procedures with mice were approved by Agency for Science, Technology and Research (A*STAR) Institutional Animal Care and Use Committee (IACUC).”
§ Hypoxia induces HIF1α-dependent epigenetic vulnerability in triple negative breast cancer to confer immune effector dysfunction and resistance to anti-PD-1 immunotherapy > Methods > Human CD34+ cells and NIKO, immune, and TNBC-immune-humanized mice
plain- Asserted: passes — The authors put it forward as true.
- Checkable: passes — It can be checked against evidence.
- Load-bearing: fails — The paper’s conclusions may not depend on it.
- Based: passes — The paper gives a reason why it holds.
Probably not a substantial claim. The paper’s conclusions may not depend on it.
What the paper did — it cites no source for this, so there is none to check. The quote shows it is in the paper.
In the paper
“Human umbilical cord blood was collected from KK Women’s and Children’s Hospital (KKH), with written consent obtained from guardians of donors, and in accordance with the ethical guidelines of KKH.”
§ Hypoxia induces HIF1α-dependent epigenetic vulnerability in triple negative breast cancer to confer immune effector dysfunction and resistance to anti-PD-1 immunotherapy > Methods > Human CD34+ cells and NIKO, immune, and TNBC-immune-humanized mice
plain- Asserted: passes — The authors put it forward as true.
- Checkable: passes — It can be checked against evidence.
- Load-bearing: fails — The paper’s conclusions may not depend on it.
- Based: passes — The paper gives a reason why it holds.
Probably not a substantial claim. The paper’s conclusions may not depend on it. It may state two separate claims as one.
What the paper did — it cites no source for this, so there is none to check. The quote shows it is in the paper.
In the paper
“Drug treatments at the indicated doses did not show toxicity to the T or NK cells.”
§ Hypoxia induces HIF1α-dependent epigenetic vulnerability in triple negative breast cancer to confer immune effector dysfunction and resistance to anti-PD-1 immunotherapy > Methods > Hypoxic culture of human T cells and NK cells
plain- Asserted: passes — The authors put it forward as true.
- Checkable: passes — It can be checked against evidence.
- Load-bearing: passes — The paper’s conclusions depend on it.
- Based: passes — The paper gives a reason why it holds.
Probably not a substantial claim.
What the paper did — it cites no source for this, so there is none to check. The quote shows it is in the paper.
In the paper
“For the drug administration, mice were randomized and drug treatments started 10 days after tumor injection when the tumor volume reached 70–100 mm3.”
§ Hypoxia induces HIF1α-dependent epigenetic vulnerability in triple negative breast cancer to confer immune effector dysfunction and resistance to anti-PD-1 immunotherapy > Methods > Syngeneic mouse TNBC model
plain- Asserted: passes — The authors put it forward as true.
- Checkable: passes — It can be checked against evidence.
- Load-bearing: fails — The paper’s conclusions may not depend on it.
- Based: passes — The paper gives a reason why it holds.
Probably not a substantial claim. The paper’s conclusions may not depend on it.
A conclusion the paper draws from its own results — it cites no other source for it, so there is none to check. The quote shows it is in the paper.
In the paper
“given that hypoxia is a common trait for solid tumors, we believe that both the mechanism and the combinational therapy we have identified are expandable to the treatment of other different tumor types in addition to TNBC.”
§ Hypoxia induces HIF1α-dependent epigenetic vulnerability in triple negative breast cancer to confer immune effector dysfunction and resistance to anti-PD-1 immunotherapy > Discussion
hedgedconditional- Asserted: passes — The authors put it forward as true.
- Checkable: fails — It may be too vague to check against evidence.
- Load-bearing: fails — The paper’s conclusions may not depend on it.
- Based: fails — The paper may give no reason why it holds.
Probably not a substantial claim. It may be too vague to check against evidence. The paper’s conclusions may not depend on it. The paper may give no reason why it holds.
- Rests on an assumption: Hypoxia is a common trait for solid tumors.
What the paper did — it cites no source for this, so there is none to check. The quote shows it is in the paper.
In the paper
“Drug treatments at the indicated doses did not show toxicity to mouse T cells.”
§ Hypoxia induces HIF1α-dependent epigenetic vulnerability in triple negative breast cancer to confer immune effector dysfunction and resistance to anti-PD-1 immunotherapy > Methods > Mouse T cell expansion and cultures
plain- Asserted: passes — The authors put it forward as true.
- Checkable: passes — It can be checked against evidence.
- Load-bearing: fails — The paper’s conclusions may not depend on it.
- Based: passes — The paper gives a reason why it holds.
Probably not a substantial claim. The paper’s conclusions may not depend on it.
A conclusion the paper draws from its own results — it cites no other source for it, so there is none to check. The quote shows it is in the paper.
In the paper
“In summary, our findings add to our fundamental understanding of hypoxia regulation of immune response, which aids in providing alternative strategies for developing a therapeutic intervention to treat TNBC.”
§ Hypoxia induces HIF1α-dependent epigenetic vulnerability in triple negative breast cancer to confer immune effector dysfunction and resistance to anti-PD-1 immunotherapy > Discussion
plain- Asserted: passes — The authors put it forward as true.
- Checkable: fails — It may be too vague to check against evidence.
- Load-bearing: passes — The paper’s conclusions depend on it.
- Based: passes — The paper gives a reason why it holds.
Probably not a substantial claim. It may be too vague to check against evidence. It may state two separate claims as one.
What the paper did — it cites no source for this, so there is none to check. The quote shows it is in the paper.
In the paper
“For the drug administration, mice were randomized and drug treatments started 15 days after tumor injection when the tumor volume reached 70–100 mm3.”
§ Hypoxia induces HIF1α-dependent epigenetic vulnerability in triple negative breast cancer to confer immune effector dysfunction and resistance to anti-PD-1 immunotherapy > Methods > Human CD34+ cells and NIKO, immune, and TNBC-immune-humanized mice
plain- Asserted: passes — The authors put it forward as true.
- Checkable: passes — It can be checked against evidence.
- Load-bearing: fails — The paper’s conclusions may not depend on it.
- Based: passes — The paper gives a reason why it holds.
Probably not a substantial claim. The paper’s conclusions may not depend on it.
A conclusion the paper draws from its own results — it cites no other source for it, so there is none to check. The quote shows it is in the paper.
In the paper
“Moreover, depletion of T or NK cells abolished the combination effect, further supporting our claim that the synergistic effect act by removing the hypoxia-mediated epigenetic suppression of immune effector expression.”
§ Hypoxia induces HIF1α-dependent epigenetic vulnerability in triple negative breast cancer to confer immune effector dysfunction and resistance to anti-PD-1 immunotherapy > Discussion
boosteddirect- Asserted: passes — The authors put it forward as true.
- Checkable: passes — It can be checked against evidence.
- Load-bearing: passes — The paper’s conclusions depend on it.
- Based: passes — The paper gives a reason why it holds.
It may state two separate claims as one.
What the paper did — it cites no source for this, so there is none to check. The quote shows it is in the paper.
In the paper
“The depletion of NK or T cells were examined by flow cytometry of PBMC extracted from mouse blood.”
§ Hypoxia induces HIF1α-dependent epigenetic vulnerability in triple negative breast cancer to confer immune effector dysfunction and resistance to anti-PD-1 immunotherapy > Methods > Syngeneic mouse TNBC model
plain- Asserted: passes — The authors put it forward as true.
- Checkable: passes — It can be checked against evidence.
- Load-bearing: passes — The paper’s conclusions depend on it.
- Based: passes — The paper gives a reason why it holds.
Probably not a substantial claim.
What the paper did — it cites no source for this, so there is none to check. The quote shows it is in the paper.
In the paper
“All experiments were conducted in compliance with animal protocols approved by the ASTAR-Biopolis Institutional Animal Care and Use Committee of Singapore.”
§ Hypoxia induces HIF1α-dependent epigenetic vulnerability in triple negative breast cancer to confer immune effector dysfunction and resistance to anti-PD-1 immunotherapy > Methods > Syngeneic mouse TNBC model
plain- Asserted: passes — The authors put it forward as true.
- Checkable: passes — It can be checked against evidence.
- Load-bearing: fails — The paper’s conclusions may not depend on it.
- Based: passes — The paper gives a reason why it holds.
Probably not a substantial claim. The paper’s conclusions may not depend on it. The quote only partly states this claim.
The paper relies on this without support.
The in vitro culture system models human T cell dysfunction and exhaustion in TNBC.
“Using an in vitro culture system modeling human T cell dysfunction and exhaustion in triple-negative breast cancer (TNBC)”
The paper relies on this without support.
The fundamental mechanism governing tumor immune resistance remains unanswered.
“However, the fundamental mechanism governing tumor immune resistance remains unanswered.”
The paper relies on this without support.
Inhibition of IFNγ production and interferon response including PD-L1 is expected to induce resistance to PD-1/PD-L1 blockade.
“Inhibition of IFNγ production and interferon response including PD-L1 is expected to induce resistance to the PD-1/PD-L1 blockade.”
The paper relies on this without support.
The role of hypoxia in modulating cancer immunity and the corresponding mechanism remains unclear.
“but its role in modulating cancer immunity and the corresponding mechanism remains unclear.”
The authors state this as an assumption.
PX478 and epigenetic drugs also have additional effects on other elements such as myeloid cells and macrophages in the tumor microenvironment.
“Admittedly, there is no doubt that PX478 and epigenetic drugs also have additional effects on other elements such as myeloid cells and macrophages in the tumor microenvironment.”
The paper relies on this without support.
Hypoxia is a common trait for solid tumors.
“given that hypoxia is a common trait for solid tumors”
Claims other papers make about this one
Each is checked against this paper’s own text: does it say what the citing paper says it does?
In the citing paper
“Hypoxic TME is still one of the major causes of resistance to radiotherapy, chemotherapy, and immunotherapy,”
From Hypoxia signaling in cancer: Implications for therapeutic interventions (2023) · cites this paper as [189]
Self-check
Percentages, sums and reported differences re-computed from the paper’s own numbers.
Each contradiction between two passages listed here was confirmed by an independent check.
Rated minor: it would not touch a result — a value no result rests on, a p-value that stays on the same side of the significance level, or a conflict that is clerical, resolved elsewhere in the paper, or outside its own findings.
In the paper
§ Hypoxia induces HIF1α-dependent epigenetic vulnerability in triple negative breast cancer to confer immune effector dysfunction and resistance to anti-PD-1 immunotherapy > Results > Targeting HIF1α and associated epigenetic dependency overcomes resistance to PD-1 blockade in both syngeneic and humanized mouse models
“Ten weeks after transplanting CD34+ human fetal liver cells into 3-day-old NIKO pup, mice were evaluated for human T and NK cells reconstitution (Fig. 7a).”
§ Hypoxia induces HIF1α-dependent epigenetic vulnerability in triple negative breast cancer to confer immune effector dysfunction and resistance to anti-PD-1 immunotherapy > Methods > Human CD34+ cells and NIKO, immune, and TNBC-immune-humanized mice
“The mice were bled at 12 weeks post-transplantation to determine the fraction of human immune cell reconstitution.”
Rated minor: it would not touch a result — a value no result rests on, a p-value that stays on the same side of the significance level, or a conflict that is clerical, resolved elsewhere in the paper, or outside its own findings.
In the paper
§ Hypoxia induces HIF1α-dependent epigenetic vulnerability in triple negative breast cancer to confer immune effector dysfunction and resistance to anti-PD-1 immunotherapy > Results > Hypoxia is associated with immune escape in breast cancer
“in TNBC (n = 99) (also referred as a basal subtype of breast cancer) (Fig. 1a)”
§ Hypoxia induces HIF1α-dependent epigenetic vulnerability in triple negative breast cancer to confer immune effector dysfunction and resistance to anti-PD-1 immunotherapy > Results > Hypoxia is associated with immune escape in breast cancer
“a Heatmap showing Pearson’s correlation between hypoxic signature genes expression and immune-related genes expression in basal TNBC samples (n = 98) in TCGA dataset.”
Rated minor: it would not touch a result — a value no result rests on, a p-value that stays on the same side of the significance level, or a conflict that is clerical, resolved elsewhere in the paper, or outside its own findings.
In the paper
§ Hypoxia induces HIF1α-dependent epigenetic vulnerability in triple negative breast cancer to confer immune effector dysfunction and resistance to anti-PD-1 immunotherapy > Results > Hypoxia induces chromatin remodeling to suppress immune effector gene expression in T and NK cells
“normalized to the control group under normoxia (1% O2)”
§ Hypoxia induces HIF1α-dependent epigenetic vulnerability in triple negative breast cancer to confer immune effector dysfunction and resistance to anti-PD-1 immunotherapy > Results > Hypoxia induces T cell dysfunction, which upon further antigen stimulation, drives towards an exhaustion-like state
“the normoxia (20% O2) and hypoxia (1% O2) culture condition”
Rated minor: it would not touch a result — a value no result rests on, a p-value that stays on the same side of the significance level, or a conflict that is clerical, resolved elsewhere in the paper, or outside its own findings.
In the paper
§ Hypoxia induces HIF1α-dependent epigenetic vulnerability in triple negative breast cancer to confer immune effector dysfunction and resistance to anti-PD-1 immunotherapy > Results > Targeting HIF1α and associated epigenetic dependency overcomes resistance to PD-1 blockade in both syngeneic and humanized mouse models
“Ten weeks after transplanting CD34+ human fetal liver cells into 3-day-old NIKO pup, mice were evaluated for human T and NK cells reconstitution (Fig. 7a).”
§ Hypoxia induces HIF1α-dependent epigenetic vulnerability in triple negative breast cancer to confer immune effector dysfunction and resistance to anti-PD-1 immunotherapy > Methods > Human CD34+ cells and NIKO, immune, and TNBC-immune-humanized mice
“For immune-humanized mice, one to three days old NIKO pups were irradiated with a 55 s exposure equaling 1.1 Gy and transplanted with 1 × 10⁵ CD34+ human cord blood cells (HLA-A2+) by intra-hepatic injections46.”
Rated minor: it would not touch a result — a value no result rests on, a p-value that stays on the same side of the significance level, or a conflict that is clerical, resolved elsewhere in the paper, or outside its own findings.
In the paper
§ Hypoxia induces HIF1α-dependent epigenetic vulnerability in triple negative breast cancer to confer immune effector dysfunction and resistance to anti-PD-1 immunotherapy > Methods > Mouse T cell expansion and cultures
“After another 48 h (day 4), the mouse T cells in suspension were gently collected from the coculture for flow cytometry.”
§ Hypoxia induces HIF1α-dependent epigenetic vulnerability in triple negative breast cancer to confer immune effector dysfunction and resistance to anti-PD-1 immunotherapy > Methods > Mouse T cell expansion and cultures
“After another 48 h (day 4), the cells were harvested and 1 × 10⁵ T cells were seeded onto a monolayer of 2 × 10⁵ mouse 4T1 cells in 2 ml fresh TexMACS medium + rhIL2 in a 12-well plate.”
Citations
Cites
PD-1 and PD-L1 Immune Checkpoint Blockade to Treat Breast Cancer
Hartkopf, A. D., Taran, F., Wallwiener, M., Walter, C. B., Krämer, B., Grischke, E., & Brucker, S. Y. (2016) · Breast Care · doi:10.1159/000453569 · Cited by 30,989
Nishimura, R., Osako, T., Nishiyama, Y., Tashima, R., Nakano, M., Fujisue, M., Toyozumi, Y., & Arima, N. (2013) · Oncology · doi:10.1159/000353099 · Cited by 13,239
Comprehensive molecular portraits of human breast tumours
The Cancer Genome Atlas Network (2012) · Nature · doi:10.1038/nature11412 · Cited by 12,129
Genomic and Transcriptomic Features of Response to Anti-PD-1 Therapy in Metastatic Melanoma
Hugo, W., Zaretsky, J. M., Sun, L., Song, C., Moreno, B. H., Hu-Lieskovan, S., Berent-Maoz, B., Pang, J., Chmielowski, B., Cherry, G., et al. (2016) · Cell · doi:10.1016/j.cell.2016.02.065 · Cited by 3,448
Pembrolizumab for Early Triple-Negative Breast Cancer
Schmid, P., Cortes, J., Pusztai, L., McArthur, H., Kümmel, S., Bergh, J., Denkert, C., Park, Y. H., Hui, R., Harbeck, N., et al. (2020) · New England Journal of Medicine · doi:10.1056/nejmoa1910549 · Cited by 3,270
Triple-negative breast cancer: challenges and opportunities of a heterogeneous disease
Bianchini, G., Balko, J. M., Mayer, I. A., Sanders, M. E., & Gianni, L. (2016) · Nature Reviews Clinical Oncology · doi:10.1038/nrclinonc.2016.66 · Cited by 3,079
Genes that mediate breast cancer metastasis to lung
Minn, A. J., Gupta, G. P., Siegel, P. M., Bos, P. D., Shu, W., Giri, D. D., Viale, A., Olshen, A. B., Gerald, W. L., & Massagué, J. (2005) · Nature · doi:10.1038/nature03799 · Cited by 2,922
Pembrolizumab in Patients With Advanced Triple-Negative Breast Cancer: Phase Ib KEYNOTE-012 Study
Nanda, R., Chow, L. Q. M., Dees, E. C., Berger, R., Gupta, S., Geva, R., Pusztai, L., Pathiraja, K., Aktan, G., Cheng, J. D., et al. (2016) · Journal of Clinical Oncology · doi:10.1200/jco.2015.64.8931 · Cited by 1,477
Pancancer survival analysis of cancer hallmark genes
Nagy, Á., Munkácsy, G., & Győrffy, B. (2021) · Scientific Reports · doi:10.1038/s41598-021-84787-5 · Cited by 1,381
Epigenetic stability of exhausted T cells limits durability of reinvigoration by PD-1 blockade
Pauken, K. E., Sammons, M. A., Odorizzi, P. M., Manne, S., Godec, J., Khan, O., Drake, A. M., Chen, Z., Sen, D. R., Kurachi, M., et al. (2016) · Science · doi:10.1126/science.aaf2807 · Cited by 1,348
Cited by
Sorted by citations
Items 101–200 of 200
Gan, Y., Meng, D., Lang, L., Luo, J., Dai, P., Chang, C., Lu, Z., Guo, Y., Wang, R., Chen, S.-C., et al. (2025) · Advanced Science · doi:10.1002/advs.202510224 · Cited by 6
Self-citationThe role and mechanisms of the HIF-1 signaling pathway in LC-COPD
Zheng, Y., & Qian, J. (2025) · Journal of Cancer Research and Clinical Oncology · doi:10.1007/s00432-025-06373-w · Cited by 6
Oxidative Stress and DNA Epigenetic Modifications in Cancer: Mechanisms and Targeted Therapeutics
Yang, X., Chen, Q., Yu, Y., Zang, Y., Zheng, R., Zhang, Z., Lu, S., & Zhou, L. (2026) · MedComm – Oncology · doi:10.1002/mog2.70065 · Cited by 7
Self-citationCong, J., Zheng, S., Zhang, H., Li, Y., & Liu, Z. (2026) · Cancer Letters · doi:10.1016/j.canlet.2026.218548 · Cited by 7
Liu, J., Li, H., Zhang, N., Dong, Q., & Liang, Z. (2024) · Current Medicinal Chemistry · doi:10.2174/0109298673313281240425050032 · Cited by 6
Targeting the hypoxia signaling pathway with nanomedicine to reverse immunotherapy resistance
Cheng, X., Wang, P., Lyu, H., Lee, Y., Yoon, J., & Dong, H. (2025) · Cancer Drug Resistance · doi:10.20517/cdr.2025.132 · Cited by 5
CRISPR/Cas as a tool to overcome drug resistance in cancer: From challenge to opportunity
Hussen, B. M., Abdullah, S. R., Hidayat, H. J., Glassy, M. C., Safarzadeh, A., Komaki, A., Samsami, M., & Taheri, M. N. (2025) · Molecular and Cellular Probes · doi:10.1016/j.mcp.2025.102052 · Cited by 6
Leveraging T cells for cancer immunotherapy
Bates, A., Fletcher, N. E., Gao, F., Pinho, M. P., & Dong, T. (2025) · Immunity & Inflammation · doi:10.1007/s44466-025-00007-z · Cited by 8
Wang, Y., Sun, C., Liu, M., Xu, P., Li, Y., Zhang, Y., & Huang, J. (2024) · Frontiers in Immunology · doi:10.3389/fimmu.2024.1424393 · Cited by 5
Self-citationZhu, Y., He, X., Ma, X., Zhang, Y., & Feng, W. (2025) · Oncogenesis · doi:10.1038/s41389-025-00555-4 · Cited by 5
Kalliolias, G. D., & Papavassiliou, A. G. (2024) · Pharmacological Research · doi:10.1016/j.phrs.2024.107537 · Cited by 5
Yang, J., Wan, S., Zhao, M., Cai, H., Gao, Y., & Wang, H. (2023) · Reproductive Sciences · doi:10.1007/s43032-023-01304-x · Cited by 5
Ghasemi, K. (2025) · Pathology - Research and Practice · doi:10.1016/j.prp.2025.156163 · Cited by 4
Ren, Y., Li, Y., Wang, Z., Cui, Y., Xing, Z., Zhang, Y., Cao, N., Yu, Y., Guo, Y., & Li, X. (2025) · Frontiers in Immunology · doi:10.3389/fimmu.2025.1634399 · Cited by 4
Zhou, M., Xu, T., Yuan, S., Ma, X., Xu, Y., Xie, J., Hu, D., & Ju, S. (2025) · Advanced Healthcare Materials · doi:10.1002/adhm.202504479 · Cited by 4
Vo, H. V., 徐, R. 榕. X., Boyden, E. S., & Zhao, Y. (2026) · Nature Reviews Methods Primers · doi:10.1038/s43586-026-00480-9 · Cited by 7
Self-citationZhao, Y., Shang, Y., Luan, T., Yu, Z., Yang, Y., Niu, X., Li, H., Wang, S., Wang, C., & Liu, L. (2026) · Molecular Cancer · doi:10.1186/s12943-026-02674-x · Cited by 4
Self-citationShi, T., Guo, Y., Tang, X., Liu, Z., Guo, Q., Fang, T., Xu, S., & Zhuang, Z. (2026) · Neoplasia · doi:10.1016/j.neo.2026.101348 · Cited by 9
Remodelling hypoxic TNBC microenvironment restores antitumor efficacy of Vγ9Vδ2 T cell therapy
Jing, Y.-Y., Wu, Y., Hu, Q., Wu, W., Li, D., Hu, W., Li, H., Fu, M., Huang, X., & Hu, Y. (2025) · British Journal of Cancer · doi:10.1038/s41416-025-03045-x · Cited by 4
Zhong, J., Shen, X., Zhou, J.-J., Yu, H.-P., Wang, B.-R., Sun, J., Wang, J., & Liu, F. (2023) · Frontiers in Oncology · doi:10.3389/fonc.2023.1077342 · Cited by 5
Matossian, M. D., Chen, N., & Nanda, R. (2023) · Current Breast Cancer Reports · doi:10.1007/s12609-023-00492-4 · Cited by 4
Multifaceted roles of PD‐1 in tumorigenesis: From immune checkpoint to tumor cell‐intrinsic function
Chen, H., Wei, J., Zhu, Z., & Hou, Y. (2024) · Molecular Carcinogenesis · doi:10.1002/mc.23740 · Cited by 4
Xing, C., Hu, W., & Zhao, L. (2025) · Journal of Translational Medicine · doi:10.1186/s12967-025-06936-y · Cited by 4
Obeagu, E. (2025) · Annals of Medicine and Surgery · doi:10.1097/ms9.0000000000003500 · Cited by 3
Zhang, J., Xie, F., Zhang, Y., Chen, S., Shi, W., Yang, X., Ren, Y., Li, Y., Arumugam, M., Kong, X., et al. (2025) · Small · doi:10.1002/smll.202506115 · Cited by 3
Yang, H., Hao, J., Wu, R., Tong, H., Chen, L., & Luo, K. Q. (2025) · Advanced Science · doi:10.1002/advs.202515772 · Cited by 3
Hypoxia regulates Th17/Treg balance by altering chromatin accessibility and gene expression
Cázares-Olivera, M., Song, S., Ylinen, S., Qureshi, T., Li, B., & Chen, Z. J. (2025) · FEBS Journal · doi:10.1111/febs.70353 · Cited by 3
The purinergic signaling interfaces in breast cancer angiogenesis
da Silva, F. C., Stabile, J., Fürstenau, C. R., & Araújo, T. G. (2026) · Purinergic Signalling · doi:10.1007/s11302-025-10119-1 · Cited by 3
Gao, K., Li, Y., Song, X., Ju, M., Liu, W. T., Xu, J., Jie, L., Zhang, H., Wei, Q., & Zhao, L. (2026) · Pharmacological Research · doi:10.1016/j.phrs.2026.108307 · Cited by 3
Kaur, P., Ring, A., Porras, T. B., Zhou, G., Lu, J. M., Kang, I. M., & Lang, J. E. (2024) · Cancers · doi:10.3390/cancers16030516 · Cited by 3
Regulatory T cells in cancer anti-PD-(L)1 therapy
Mortezaee, K. (2025) · Human Cell · doi:10.1007/s13577-025-01280-1 · Cited by 3
Wang, L., Han, H., Ma, J., Feng, Y., Han, Z., Maharaj, V. J., Tian, J., Zhu, W., Li, S., & Shao, X. (2024) · ONCOLOGIE · doi:10.1515/oncologie-2023-0539 · Cited by 3
Ba, L., Zhao, Z., Zhang, C., Chu, Y., & Wu, C. (2024) · International Immunopharmacology · doi:10.1016/j.intimp.2024.113810 · Cited by 3
5-Aminolevulinic Acid: A Novel Approach to Improving Radioresistance in Prostate Cancer
Maesaka, F., Nakai, Y., Yoshida, T., Tomizawa, M., Shimizu, T., Owari, T., Onishi, K., Miyake, M., Kuniyasu, H., Fujimoto, K., et al. (2025) · Cancers · doi:10.3390/cancers17081286 · Cited by 2
Duan, Z., Zhou, Y., & Wu, Y. (2025) · Discover Oncology · doi:10.1007/s12672-025-03324-2 · Cited by 2
3D bioprinting innovations: a new frontier in breast cancer research
Seifi, Z., Khazaei, M., Dayani, M., Zamani, S., Abdalla, S. B., & Rezakhani, L. (2025) · Medical Oncology · doi:10.1007/s12032-025-03069-6 · Cited by 3
Regulatory effects of traditional Chinese medicine on the breast-cancer immune microenvironment
Liu, T., Shang, J., Wang, J., Han, L., Yang, M., Li, R., Ni, B., & Jiang, J. (2026) · Frontiers in Immunology · doi:10.3389/fimmu.2025.1706379 · Cited by 2
Hidalgo-Filho, C. M., Santo, V., Gariazzo, E., Aldea, M. D., Pecci, F., Danlos, F., Junior, G. D. C., & Ricciuti, B. (2026) · Journal of Clinical Oncology · doi:10.1200/jco-25-03026 · Cited by 2
Bree, B. A. V., & Eichner, L. J. (2026) · Science Advances · doi:10.1126/sciadv.aee7295 · Cited by 2
Xu, H., Wei, F., Hou, M., Zhong, L., Feng, Y., & Shen, X. (2026) · Biomaterials · doi:10.1016/j.biomaterials.2026.124447 · Cited by 2
Differential response of luminal and basal breast cancer cells to acute and chronic hypoxia
Liu, Q., Liu, N., van der Noord, V. E., van der Stel, W., van de Water, B., Danen, E. H. J., & Dévédec, S. E. L. (2023) · Breast Cancer Research and Treatment · doi:10.1007/s10549-023-06863-w · Cited by 4
Zohar, N., Maguire, R., Khalilieh, S., Jain, A., Bosykh, D. A., Bowne, W. B., Lavu, H., Yeo, C. J., & Nevler, A. (2025) · International Journal of Molecular Sciences · doi:10.3390/ijms26072848 · Cited by 2
Zinc finger protein 217 contributes to natural killer cell dysfunction in murine colorectal cancer
Yu, Y., Yang, H., Wang, H., & Xiao, F. (2025) · Cellular Immunology · doi:10.1016/j.cellimm.2025.104971 · Cited by 2
Myoglobin expression improves T-cell metabolism and antitumor effector function
Werner, J., Xu, H., Theodorakis, G., Katahira, I., Ghosh, M., Gorzkiewicz, M., Santos, L. D. S., Bergmann, A. K., Anstötz, M., Busch, A., et al. (2025) · Journal for ImmunoTherapy of Cancer · doi:10.1136/jitc-2025-011503 · Cited by 4
Hypoxia Promotes Early Tumorigenesis through Dynamical-Mechanical Balance and Genetic InstabilityPreprint
Wang, Z., Tian, L., & Li, B. (2025) · bioRxiv (Cold Spring Harbor Laboratory) · doi:10.1101/2024.12.31.630973 · Cited by 3
Blood transfusion mediated tumor microenvironment remodeling in breast cancer
Yin, Q., Zhang, S., Ouchari, M., Wang, P., Zhao, A., Zeng, L., Wang, J., Yao, K., Tang, S., Ma, H., et al. (2025) · Acta Histochemica · doi:10.1016/j.acthis.2025.152289 · Cited by 1
Ramadan, W. S. H., Menon, V., Zein, R. A., Alqedra, S., El-Gharib, Y., Al-Shihabi, A. M., Alhamidi, R. S., İlçe, B. Y., Hamoudi, R., & El‐Awady, R. (2025) · Biochemical Pharmacology · doi:10.1016/j.bcp.2025.117535 · Cited by 1
Yang, F., Li, S., Chen, F., Ji, Q., Wu, Y., Zhang, F., Wang, Y., Luo, C., & Li, S. (2026) · Materials Today · doi:10.1016/j.mattod.2026.103261 · Cited by 1
Molecular Targets for Cancer Immunotherapy: Focusing on (Immune and Tumor) Cell-Derived Metabolites
Quintans, R. D. T., de Freitas, Â. A., de Souza, M. M., Dias-Lopes, G., & Silva, R. C. M. C. (2026) · Applied Sciences · doi:10.3390/app16052461 · Cited by 1
Zhang, Y., Peng, S., Akhbariyoon, H., Kim, S., Lai, E., & Cai, E. (2026) · Frontiers in Immunology · doi:10.3389/fimmu.2026.1761715 · Cited by 1
Huang, S., Lv, Y., Wang, Y., Duan, Y., Li, S., Guo, Y., Xie, S., Dong, C., Yang, Y., Sun, S.-K., et al. (2026) · European Journal of Medicinal Chemistry · doi:10.1016/j.ejmech.2026.118982 · Cited by 1
Mechanism and Therapeutic Potential of Viral Mimicry in Cancer Immunotherapy
Kirkland, A. P., Shah, M., & Spruck, C. (2026) · Biomolecules · doi:10.3390/biom16050709 · Cited by 1
Sharma, N., Yadav, V., Sinha, S., Kumari, L., Sethi, A., Marcus, S., Singh, M., Kaur, S., Garg, N., Pathak, A., et al. (2026) · Molecular Aspects of Medicine · doi:10.1016/j.mam.2026.101486 · Cited by 1
Honokiol and Its Emerging Role in Breast Cancer Therapy
Singh, S. K., Kondamudi, M., Ittuveetil, A., Dababneh, M., Rivers, B. M., & Singh, R. (2026) · Cancers · doi:10.3390/cancers18121989 · Cited by 1
Liu, Y., Du, W., & Deng, W. (2026) · International Reviews of Immunology · doi:10.1080/08830185.2026.2687543 · Cited by 1
Lu, W., Wang, W., Chen, B., Huang, Z., & Jiang, R. (2026) · Biochemical and Biophysical Research Communications · doi:10.1016/j.bbrc.2026.154365 · Cited by 1
Self-citationAlaa, A. R., El-Din, S. A. B., Farrag, M. A., Ahmed, Y., Aziz, M. E. A., Abdel-Ghany, S. E., Arneth, B., & Sabit, H. (2026) · Biomedicines · doi:10.3390/biomedicines14092013 · Cited by 1
Exosomes shape inflammatory tumor microenvironment
He, C., Yu, W., Zhao, Q., Liu, H., Wang, Y., Xiong, Y., Zeng, Y., Zhao, J., Xu, Z. P., & Zhang, L. L. (2025) · Chinese Chemical Letters · doi:10.1016/j.cclet.2025.111900 · Cited by 1
You, Z., Li, J., Zhai, S., Zhao, J., & Lu, K. (2023) · Research Square · doi:10.21203/rs.3.rs-2928582/v1 · Cited by 1
A novel in vitro 3D cancer model based on modular tissue engineering approachPreprint
Baghbadorani, N. D., Bosso, M., Greene, R., Dzikowski, T., Johannson, M., Gagnon, A., & Chamberlain, M. D. (2025) · bioRxiv (Cold Spring Harbor Laboratory) · doi:10.1101/2025.02.25.640239
THER: Integrative Web Tool for Tumour Hypoxia Exploration and Research
Zhang, Y., Liu, H., Zhang, P., Ye, B., Ying, H., Yang, H. Y., Zhang, J., Zhang, N., Li, K., Wei, T., et al. (2025) · Cell Proliferation · doi:10.1111/cpr.70053
Precision medicine approaches and the management of triple-negative breast cancer
Soni, R., Rajput, M. S., & Shah, J. (2025) · Elsevier eBooks · doi:10.1016/b978-0-443-33653-9.00015-6
Ranjan, G., Pattanayak, S. P., & Sunita, P. (2025) · Current Cancer Drug Targets · doi:10.2174/0115680096410336250918141943
Doly, N. J., Lee, D. Y., Tahsin, K. N., Akhter, J., Sultana, S., Khatun, J., Chua, S.-Z., Banu, A. T., Chen, Q., & Iqbal, J. (2025) · Genes · doi:10.3390/genes16111313
Self-citationSun, K., Song, L., Cui, W., Qian, C., & Liu, Q. (2025) · Biochemical and Biophysical Research Communications · doi:10.1016/j.bbrc.2025.152933
Cha, M. C., Yeo, E., & Lee, D. (2025) · Integrative Cancer Therapies · doi:10.1177/15347354251401187
Zhang, C., Jin, Y., Yu, Y., Chen, Y., Yang, J., Zhang, J., Lu, Q., Jiang, H., Sun, Y., Zhang, Y., et al. (2025) · Journal of Biological Chemistry · doi:10.1016/j.jbc.2025.111068
Schmidt, K., Thatcher, A., Grobe, A. C., Broussard, P., Hicks, L. D., Gu, H., Ellies, L. G., Sears, D. D., Kalachev, L., & Kroll, E. (2024) · Figshare · doi:10.6084/m9.figshare.26085082
Role of Tumor Microenvironment in Metastatic Breast Cancer
Kaçaroğlu, D., & Gürbüz, N. (2026) · Springer eBooks · doi:10.1007/978-981-95-3682-5_3
Wang, S., You, W., Zhu, Y., Liu, F., Shen, Y., & Han, F. (2026) · Current Cancer Drug Targets · doi:10.2174/0115680096433626251104054626
Li, X., Zhang, X., Dai, Y., Huang, F., Wei, R., Huang, X., Ma, D., Li, F., & Li, X. (2026) · BMC Cancer · doi:10.1186/s12885-026-15597-z
Huo, J., Wang, Y., Liu, L., Li, J., Yang, L., Wang, Z., Li, B., Zhang, W., Wang, X., Siringan, M. J., et al. (2026) · Bioactive Materials · doi:10.1016/j.bioactmat.2026.03.016
A 3D Collagen-Based In Vitro Cancer Model Created Through Modular Tissue Engineering
Baghbadorani, N. D., Bosso, M., Greene, R., Dzikowski, T., Bevelander, B. B., Gagnon, A., Johannson, M., Javan, M., Soori, P., & Chamberlain, M. D. (2026) · Cancers · doi:10.3390/cancers18060935
Liu, Y., Qiu, Q., Deng, H., Song, P., Bu, J., & Zhang, M. (2026) · International Journal of General Medicine · doi:10.2147/ijgm.s583369
Zhang, S. (2024) · theses.fr (ABES) · doi:10.70675/60a97388z3f39z4829zbe4ezd73224b4a333
Fang, L., Qiu, F., Wu, Y., Li, H., Zhang, S., Liu, S.-Y., Shao, J., Shen, Y., & Chen, W. (2026) · European Journal of Medicinal Chemistry · doi:10.1016/j.ejmech.2026.118962
Yang, W., 游家逢, Zhang, H., Wu, J., Guo, X., Guan, D., & 杨国旺 (2026) · Frontiers in Immunology · doi:10.3389/fimmu.2026.1824721 · Cited by 1
HIFs: The central drivers of tumors and their role as molecular switches in targeted therapy?
Peng, Y., Che, Y., Zhao, Y., Wang, Z., Pei, Z., Hu, Y., Yin, Y., Pan, X., Hu, X., Wei, M., et al. (2026) · Acta Pharmaceutica Sinica B · doi:10.1016/j.apsb.2026.06.040
Self-citationXie, G., Li, M., Li, B., Guo, S., Wang, Y., Liu, J., Miao, R., Hou, W., & Wei, X. (2026) · Chemical Engineering Journal · doi:10.1016/j.cej.2026.179014
Hou, Z.-T., Jia-rui, C., Fang, G.-X., & Yang, G. (2026) · Biochemical Pharmacology · doi:10.1016/j.bcp.2026.118228
Epigenetic-targeted nanomedicine in cancer: from molecular mechanisms to therapeutic revolution
Wang, B., Han, Y., Zhang, X., Li, Y., Cai, Z., Duan, Z., Gong, Q. H., Jiang, Y., & Luo, K. (2026) · Progress in Materials Science · doi:10.1016/j.pmatsci.2026.101789
Yi, Y., Min, H., Huang, Y., Tao, L., Zhou, H., Zhang, W., Ren, X., Huang, C., Deng, Y., & Zhou, J. (2026) · Current Issues in Molecular Biology · doi:10.3390/cimb48080784
Beclin-1 and HIF-1α immunohistochemical expression in breast carcinoma: insights into tumor biology
Zaki, M. M., Abdelwahab, K., Emarah, Z. A., Magdy, A., & Farrag, M. S. (2026) · Egyptian Journal of Basic and Applied Sciences · doi:10.1080/2314808x.2026.2714584
Mukherjee, A., Janah, P., Tripathi, A., Gayen, P., & Roy, R. S. (2026) · ACS Omega · doi:10.1021/acsomega.5c10558
Drug resistance in cancer radiotherapy: From mechanisms to overcoming strategies
Chen, Y., Cai, C., Xu, X.-C., Yang, Z., Li, J., Pan, Q., Wang, L., Luo, W., Chen, Z., Zeng, L., et al. (2026) · Pharmacological Research · doi:10.1016/j.phrs.2026.108380
The regulatory role of non-coding RNAs in taxane resistance of breast cancer
Sun, C., Lv, L., Xu, Q., Wu, S., Khan, F. A., Pandupuspitasari, N. S., Zhang, Y., & Huang, C. (2026) · Biochemical Pharmacology · doi:10.1016/j.bcp.2026.118371
Cao, H., Tao, M., Qin, X., & Guo, H. (2026) · Frontiers in Immunology · doi:10.3389/fimmu.2026.1887760
Unraveling the epigenetic code in cancer cell–tumor microenvironment crosstalk
Park, J. H., & Kim, M. (2026) · Molecular Oncology · doi:10.1002/1878-0261.70321
HDAC2 restrains IGF2BP1-associated m6A dysregulation in cervical cancer immunotherapy resistance
Deng, Q., Wang, Z., Zhao, J., Li, N., 张玲花, He, W., & Zhang, Y. (2026) · PLoS ONE · doi:10.1371/journal.pone.0355606
Su, P., Zhang, Y., Yu, T., 王元宇, 牟一平, & Jin, W. (2026) · International Immunopharmacology · doi:10.1016/j.intimp.2026.117338
Physical Exercise in Immunotherapy
Johnston, C., Kim, S. J., Zhang, Y., Tsung, C., Kent, E., May, A., & Zhang, H. (2026) · Sports Medicine - Open · doi:10.1186/s40798-026-01101-1
Targeting the Epigenetic–Immune Axes in Hematologic Malignancies
Pandita, R., & Lind, E. F. (2026) · Cancers · doi:10.3390/cancers18182985
Ma, M., Tian, L., Hu, Z., Luo, H., Ning, M., & Wang, J. (2026) · International Journal of Pharmaceutics · doi:10.1016/j.ijpharm.2026.127403
Wang, Z., Li, M., Wang, Z., & Wang, Y. (2026) · Frontiers in Immunology · doi:10.3389/fimmu.2026.1927103
Immune‐Cell Dynamics in the Tumor Microenvironment: Implications for Cancer Therapy
Pin, G., Xie, Y., Song, R., Yang, M., Lin, Z., Guan, C., Wang, Z., Wen, J., & Chen, G. (2026) · MedComm · doi:10.1002/mco2.71040
Pan-cancer biomarkers of immune therapy resistance: mechanisms and clinical translation
Wang, C., & Yang, D. (2026) · Frontiers in Cell and Developmental Biology · doi:10.3389/fcell.2026.1895670
Turning cold tumors hot: Strategies to enhance antitumor immunity
Steffensen, V. G., Bratina, M., Tsiavou, C., Schmiegelow, K., & Zio, D. D. (2026) · The Journal of Experimental Medicine · doi:10.1084/jem.20260378
Li, X., Sun, R., Pi, H., Liu, X., Tan, D., Zhang, J., Nie, M., Chen, H., Hu, B., Wu, Z., et al. (2026) · Chemical Engineering Journal · doi:10.1016/j.cej.2026.183306
Al‐Khreisat, M. J., Narzikulov, R., Allela, O. Q. B., Tmkyn, A. F., Nayak, P. P., Rasulov, A., Baxtiyorovna, S. G., & Bainsal, N. (2026) · Gene · doi:10.1016/j.gene.2026.150463
Metadata
- Authors
- Ma, S., Zhao, Y., Lee, W. C., Ong, L.-T., Lee, P. L., Jiang, Z., Oguz, G., Niu, Z., Liu, M., Goh, J. Y., Wang, W., Bustos, M. A., Ehmsen, S., Ramasamy, A., Hoon, D. S. B., Ditzel, H. J., Tan, E. Y., Chen, Q., & Yu, Q.
- Affiliations
- Agency for Science, Technology and Research (SG)
- Sixth Affiliated Hospital of Sun Yat-sen University (CN)
- Odense University Hospital (DK)
- University of Southern Denmark (DK)
- Tan Tock Seng Hospital (SG)
- Corresponding author
- Chen, Qingfeng
- Yu, Qiang
- ORCID
- Venue
- Nature Communications
- Published
- 2022-07-15
- Volume
- 13
- Issue
- 1
- Pages
- 4118-4118
- ISSN
- 2041-1723 (ISSN-L)
- PMC
- PMC9287350
- OpenAlex
- W4285493755
- Semantic Scholar
- bfba158f1ad825fe9e5bcc696ce7e71fd8008221
- Cited by
- 200
- References
- 62
- Citations by year
- 2026: 56 · 2025: 64 · 2024: 43 · 2023: 32 · 2022: 5
- FWCI
- 15.07
- Type
- journal article
- Language
- en
- Open access
- gold
- doi.org
- Locations
- Nature Communications (publishedVersion, cc-by)
- PubMed Central (publishedVersion, cc-by)
- PubMed (publishedVersion)
- RePEc: Research Papers in Economics (submittedVersion)
- DOAJ (DOAJ: Directory of Open Access Journals) (submittedVersion, cc-by-sa)
- University of Southern Denmark Research Portal (University of Southern Denmark) (submittedVersion, cc-by)
- Funders
- National Research Foundation
- Agency for Science, Technology and Research (202D800029)
- National Research Foundation Singapore (NRF-NRFF2017-03)
- Medical Research Council
- National Medical Research Council (OFIRG20nov-0085)
- Topics
- Health Sciences › Medicine › Oncology › Cancer Immunotherapy and Biomarkers
- Life Sciences › Biochemistry, Genetics and Molecular Biology › Cancer Research › Cancer, Hypoxia, and Metabolism
- Life Sciences › Immunology and Microbiology › Immunology › Immune cells in cancer
- Keywords
- triple-negative breast cancer, tumor hypoxia, HIF-1α, HDAC1, polycomb repressive complex 2, epigenetic suppression, T cell exhaustion, natural killer cells, anti-PD-1 resistance, immunotherapy resistance, tumor microenvironment, immune evasion
- MeSH terms
- Animals, Hypoxia, Humans, Immunotherapy, Epigenesis, Genetic, Cell Line, Tumor, Mice, Tumor Microenvironment, Triple Negative Breast Neoplasms
About these checks
Registry, retraction, Cites and statistics results are computed, not judged, with one exception: a printed reference that no index lists is read once by a model before it counts as a citation error. Claims are extracted by a model and kept only when their quote appears verbatim in the text; each cited source is then checked, with a model’s help, for whether it says what the claim relies on. Those verdicts can be wrong — read the claim’s quote and the cited source before relying on one.
A language model drew the claims from the paper on 2026-10-10, under version 3 of the claim definition (model deepseek-v4.1-flash, prompt extract-v3).
A second model labelled each claim on 2026-10-10 (model jev-1.13-20260917, definition revision gold-guideline-v0.2).
Cited sources are checked with a language model’s help (gpt-6-sol).
Statistics and arithmetic are recomputed, not judged.
Confidence bands are shown only for fields calibrated on our annotated test set. None is calibrated yet, so no band is shown.
What counts as a claim ›How we measure confidence ›How we check this ›
Are you an author, or do you see a problem with this page? Request a review
