

The DOI matches its Crossref record; 85 of the 86 references it cites were found in a registry or an index; 38 of the 60 sources its claims cite were checked for support.
Discovery of senolytics using machine learning
Open accessAbstract
Cellular senescence is a stress response involved in ageing and diverse disease processes including cancer, type-2 diabetes, osteoarthritis and viral infection. Despite growing interest in targeted elimination of senescent cells, only few senolytics are known due to the lack of well-characterised molecular targets. Here, we report the discovery of three senolytics using cost-effective machine learning algorithms trained solely on published data. We computationally screened various chemical libraries and validated the senolytic action of ginkgetin, periplocin and oleandrin in human cell lines under various modalities of senescence. The compounds have potency comparable to known senolytics, and we show that oleandrin has improved potency over its target as compared to best-in-class alternatives. Our approach led to several hundred-fold reduction in drug screening costs and demonstrates that artificial intelligence can take maximum advantage of small and heterogeneous drug screening data, paving the way for new open science approaches to early-stage drug discovery.
Overview
AI snapshot
Written from the paper’s full text.
TL;DR
A machine-learning pipeline trained solely on published senolytic data screened 4,340 compounds and identified three senolytics—ginkgetin, periplocin, and oleandrin—validated in human cell models of oncogene- and therapy-induced senescence. Oleandrin showed improved potency over benchmark cardiac glycosides, while the approach reduced experimental screening by more than 200-fold.
Key findings
- The training set contained 2,523 compounds, including 58 positives (2.3%), featurized with 200 RDKit physicochemical descriptors reduced to 165 features; XGBoost gave the best performance, with average precision 0.7 ± 0.16 in 5-fold cross-validation and an average false discovery rate of 30%.
- Screening 4,340 compounds from the L2100 TargetMol Anticancer and L3800 Selleck FDA-approved & Passed Phase libraries yielded 21 compounds with P > 44% (0.4% of the library); experimental validation confirmed three senolytics—ginkgetin, oleandrin, and periplocin—for a hit confirmation rate of 14.28%.
- In oncogene-induced senescence (IMR90 ER:RAS), IC50 values were 85 nM control vs 14 nM senescent for oleandrin, 300 nM vs 24 nM for periplocin, and 26 μM vs 2.6 μM for ginkgetin; in therapy-induced senescence (A549), IC50 values were 19.5 nM vs 5.4 nM, 267 nM vs 72.2 nM, and 10.4 μM vs 5.7 μM, respectively.
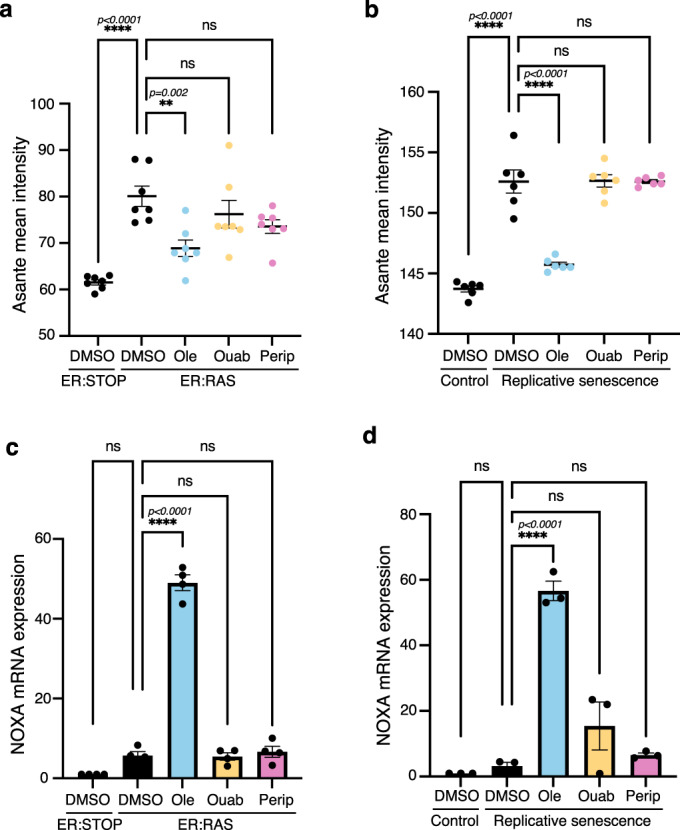
- At 10 nM, oleandrin significantly reduced senescent cell content, inhibited the Na+/K+ ATPase target, and induced NOXA mRNA, showing improved senolytic performance over ouabain; the method reduced the number of compounds for experimental screening by more than 200-fold.
Methods
- Positives were mined from published senolytic reports and a commercial patent; negatives came from LOPAC-1280 and Prestwick FDA-approved-1280. Compounds were represented by 200 RDKit physicochemical descriptors, reduced to 165 features, and classified with SVM, random forest, XGBoost, and other models using 5-fold cross-validation.
- The selected XGBoost model, trained on a 70:30 stratified split, was used to computationally screen 4,340 compounds; the top 21 with prediction scores P > 44% were selected for experimental validation.
- Validation used IMR90 ER:RAS cells with 4-OHT (100 nM) for oncogene-induced senescence and A549 cells with etoposide (100 μM) for therapy-induced senescence, with nuclei counts, dose-response IC50 fitting, crystal violet survival, caspase-3/7 activity, intracellular K+ measurement, and RT-qPCR for NOXA, p16, p21, and cytokines.
Limitations
- The paper states that feature selection and model/hyperparameter selection used the full dataset, so the 30% held-out performance metrics are over-optimistic; applying those steps only to the 70% training split would have reduced positives to 41 and made model selection less reliable.
- The paper states that negatives were assumed to lack senolytic action because negative screening results are rarely published, risking mislabeled compounds; the data are severely imbalanced, heterogeneous, and the models generally showed poor common classification metrics with many false positives and false negatives.
- The paper states that oleandrin and related cardiac glycosides have toxicity concerns, a narrow therapeutic range, and cardiotoxicity, so systemic use should be considered cautiously; further animal-model validation is needed. Evident from the text: validation was in vitro in two cell lines, with no in vivo efficacy or safety data reported.
Model-written summary. Check it against the paper before relying on it.
Integrity signals
Registry
Cites
Statistics
Figures
Verification
Claims the paper makes
53 Own result · 27 Own interpretation · 22 Own method · 14 No basis given · 8 Not checked yet · 6 Partly supported · 3 Supported · 3 Sources not found · 2 Supported so far · 2 Couldn’t confirm · 2 No full text of the sources · accuracy not yet measured
Every source the paper cites for this claim was checked and supports it.
In the paper
“Senolytic cardiac glycosides activate a transcriptional programme resulting in the induction of several pro-apoptotic Bcl-2 family proteins13.”
§ Discovery of senolytics using machine learning > Results > AI-identified compound oleandrin displays improved senolytic performance over benchmark senolytic cardiac glycosides
What the sources say
- Supportedcites [13] Guerrero, A. et al. Cardiac glycosides are broad-spectrum senolytics. Nat. Metab. 1, 1074–1088 (2019). source
In the Results section, the authors report transcriptome analysis of senescent cells treated with cardiac glycosides and find that ouabain and digoxin induce a subset of pro-apoptotic Bcl2 family proteins. The Discussion likewise reports elevated levels of several such proteins after treatment. (LLM, conf=0.91)
plaindirect- Asserted: passes — The authors put it forward as true.
- Checkable: passes — It can be checked against evidence.
- Load-bearing: passes — The paper’s conclusions depend on it.
- Based: passes — The paper gives a reason why it holds.
- Supported
The cited sources support only part of this claim — read each source’s verdict below.
In the paper
“only two compounds have shown efficacy in clinical trials (dasatinib and quercetin in combination therapy29).”
§ Discovery of senolytics using machine learning > Introduction
What the sources say
- Partly supportedcites [29] Hickson, L. J. et al. Senolytics decrease senescent cells in humans: Preliminary report from a clinical trial of Dasatinib plus Quercetin in individuals with diabetic kidney disease. EBioMedicine 47, 446–456 (2019). sourceExperimental — accuracy not yet measured
The Introduction reports improved physical function in a clinical trial of dasatinib plus quercetin, and the Abstract’s Interpretation reports a significant decrease in senescent-cell burden with that combination. The Discussion calls the findings preliminary and says trials of other senolytic drugs are underway; it does not establish that these are the only two compounds to have shown clinical efficacy. Page numbers are unavailable in our copy. (LLM, conf=0.86)
plain- Asserted: passes — The authors put it forward as true.
- Checkable: passes — It can be checked against evidence.
- Load-bearing: passes — The paper’s conclusions depend on it.
- Based: passes — The paper gives a reason why it holds.
- Partly supported
The cited sources support only part of this claim — read each source’s verdict below.
In the paper
“certain senolytics that work well for one cell-type are highly toxic against other non-senescent cell-types19,24.”
§ Discovery of senolytics using machine learning > Introduction
What the sources say
- Partly supportedcites [19] Zhu, Y. et al. New agents that target senescent cells: the flavone, fisetin, and the BCL-X inhibitors, A1331852 and A1155463. Aging 9, 955–963 (2017). sourceExperimental — accuracy not yet measured
The Results report that fisetin is senolytic in HUVECs but not in the other cell types tested, supporting cell-type-specific effectiveness. The Discussion says nonsenescent cells may be affected at higher concentrations, with apoptosis only at still higher concentrations. It does not show that a senolytic is highly toxic to another nonsenescent cell type at a concentration where it works as a senolytic. (LLM, conf=0.88)
- Supportedcites [24] Li, W., He, Y., Zhang, R., Zheng, G. & Zhou, D. The curcumin analog EF24 is a novel senolytic agent. Aging 11, 771–782 (2019). source
The Results section reports that ABT263 is a potent senolytic and reduces the viability of senescent WI-38 cells. The Discussion identifies toxicity to platelets, a different non-senescent cell type, as a dose-limiting effect of ABT263. Together, these passages support the cited example of a senolytic that works against senescent cells but harms other cells. (LLM, conf=0.85)
plaincorrelational- Asserted: passes — The authors put it forward as true.
- Checkable: passes — It can be checked against evidence.
- Load-bearing: passes — The paper’s conclusions depend on it.
- Based: passes — The paper gives a reason why it holds.
- Partly supported
The cited sources support only part of this claim — read each source’s verdict below.
In the paper
“removal of senescent cells has also been linked to some adverse effects due to blockage of their beneficial roles in processes such as wound healing and liver function21,22.”
§ Discovery of senolytics using machine learning > Introduction
What the sources say
- Partly supportedcites [21] Demaria, M. et al. An essential role for senescent cells in optimal wound healing through secretion of PDGF-AA. Dev. Cell 31, 722–733 (2014). sourceExperimental — accuracy not yet measured
The Results section (‘Elimination of Senescent Cells Delays Cutaneous Wound Healing’; page unavailable) reports that removing senescent cells delayed wound closure in mice. The paper also discusses senescent cells limiting fibrosis after liver injury, but it does not report an effect of their removal on liver function. (LLM, conf=0.88)
- Supportedcites [22] Grosse, L. et al. Defined p16 senescent cell types are indispensable for mouse healthspan. Cell Metab. 32, 87–99.e6 (2020). source
The Discussion (page not provided) says senescent cells are important for skin wound healing and that their removal could have negative effects. It also reports that removing senescent liver endothelial cells disrupts their compensatory clearance function, with detrimental consequences for the liver. (LLM, conf=0.90)
hedgedcorrelational- Asserted: passes — The authors put it forward as true.
- Checkable: passes — It can be checked against evidence.
- Load-bearing: unclear — It is unclear whether the paper’s conclusions depend on it.
- Based: passes — The paper gives a reason why it holds.
- Partly supported
The sources with a verdict support this claim; the rest weren’t checked yet, have no full text we could read, or their verdicts aren’t rated yet.
In the paper
“Despite encouraging results, to date there are few known compounds with proven senolytic action11–19,23–28”
§ Discovery of senolytics using machine learning > Introduction
What the sources say
- Supportedcites [11] Fuhrmann-Stroissnigg, H. et al. Identification of HSP90 inhibitors as a novel class of senolytics. Nat. Commun. 8, 422 (2017). source
The Introduction identifies a short list of compounds with demonstrated senolytic activity, including dasatinib plus quercetin, navitoclax, fisetin and piperlongumine, while qualifying that some act only in certain cell types. The Results describe dasatinib plus quercetin and navitoclax as established senolytics. Together, these passages support the broad statement that few compounds had proven senolytic action. (LLM, conf=0.86)
- Supportedcites [12] Guerrero, A. et al. Galactose-modified duocarmycin prodrugs as senolytics. Aging Cell. 19, e13133 (2020). source
The Introduction lists several identified senolytics, then says additional drugs with senolytic properties are needed. This supports the broad claim that the known range of compounds with demonstrated senolytic action was limited; the copy provides no page number for the passage. (LLM, conf=0.85)
- Supportedcites [13] Guerrero, A. et al. Cardiac glycosides are broad-spectrum senolytics. Nat. Metab. 1, 1074–1088 (2019). source
The Introduction lists several identified senolytic compounds and says there is a need to identify further ones. This supports the citing sentence’s broad point that the known set of compounds with demonstrated senolytic action was limited. (LLM, conf=0.88)
- Not matchedcites [14] Senolytic compounds. Patent no. 20200121620, (2018).
Couldn’t be matched to a paper in Crossref, so it can’t be checked.
- Supportedcites [15] Triana-Martínez, F. et al. Identification and characterization of Cardiac Glycosides as senolytic compounds. Nat. Commun. 10, 4731 (2019). source
The Introduction (page not provided) says that several compounds had recently been identified with selective cytotoxic activity on senescent cells and describes a search for additional senolytics. This supports the broad statement that few compounds with demonstrated senolytic action were known. (LLM, conf=0.86)
- Supportedcites [16] Yosef, R. et al. Directed elimination of senescent cells by inhibition of BCL-W and BCL-XL. Nat. Commun. 7, 11190 (2016). source
The Discussion describes ABT-737 treatment as “one of the first demonstrations” of targeted pharmacological removal of senescent cells from living tissue. That supports the broad statement that few compounds had demonstrated senolytic action; the Abstract also reports ABT-737’s activity in vitro and in mice. (LLM, conf=0.86)
- Supportedcites [17] Yousefzadeh, M. J. et al. Fisetin is a senotherapeutic that extends health and lifespan. EBioMedicine 36, 18–28 (2018). source
The Introduction describes a short list of identified senolytic treatments—dasatinib plus quercetin, navitoclax, and A1331852—and says new and improved drugs are needed. This supports the broad statement that few compounds with demonstrated senolytic action were known. (LLM, conf=0.84)
- Supportedcites [18] Zhu, Y. et al. The Achilles’ heel of senescent cells: from transcriptome to senolytic drugs. Aging Cell. 14, 644–658 (2015). source
In Results > Candidate senolytic drugs in vitro (page unavailable), the paper reports that of 46 agents tested, dasatinib and quercetin showed particular promise. The Discussion (page unavailable) treats additional senolytic agents as candidates needing further testing. This supports the broad claim that few compounds had demonstrated senolytic action; the evidence here is preclinical, not proof of clinical efficacy. (LLM, conf=0.85)
- Supportedcites [19] Zhu, Y. et al. New agents that target senescent cells: the flavone, fisetin, and the BCL-X inhibitors, A1331852 and A1155463. Aging 9, 955–963 (2017). source
The Introduction names dasatinib and quercetin as previously identified senolytics, while the Discussion describes fisetin, A1331852, and A1155463 as new additions to a growing number of agents. The Discussion also predicts that many more will be discovered, supporting the claim that relatively few were known at the time. The paper establishes the new agents' activity in vitro, not clinical efficacy. (LLM, conf=0.87)
- Not checked yetcites [23] Lafontaine, J. et al. Senolytic targeting of Bcl-2 anti-apoptotic family increases cell death in irradiated sarcoma cells. Cancers https://doi.org/10.3390/cancers13030386 (2021). source
Checked before — its earlier verdict is held back until a new check runs.
plain- Asserted: passes — The authors put it forward as true.
- Checkable: passes — It can be checked against evidence.
- Load-bearing: passes — The paper’s conclusions depend on it.
- Based: passes — The paper gives a reason why it holds.
- Supported
The cited sources support only part of this claim — read each source’s verdict below.
In the paper
“Senolytics have shown substantial promise in ameliorating symptoms of many conditions in mice11–20”
§ Discovery of senolytics using machine learning > Introduction
What the sources say
- Supportedcites [11] Fuhrmann-Stroissnigg, H. et al. Identification of HSP90 inhibitors as a novel class of senolytics. Nat. Commun. 8, 422 (2017). source
The Introduction reports benefits of senolytics across several mouse models, including improved cardiovascular function, reduced frailty and bone loss, and improved lung function. The Discussion also reports that 17-DMAG delayed multiple age-related symptoms in progeroid mice. Together, these passages support the broad statement that senolytics show promise for multiple conditions in mice. (LLM, conf=0.92)
- Supportedcites [12] Guerrero, A. et al. Galactose-modified duocarmycin prodrugs as senolytics. Aging Cell. 19, e13133 (2020). source
The Introduction reports that eliminating senescent cells benefits outcomes across a wide range of diseases in genetic models and that senolytic drugs can reproduce effects seen in transgenic mice. The Discussion explicitly describes senolytics as promising for treating age-related disease. Together, these passages support the citing sentence's broad statement of promise in mice, though they do not list specific symptoms. (LLM, conf=0.85)
- Supportedcites [13] Guerrero, A. et al. Cardiac glycosides are broad-spectrum senolytics. Nat. Metab. 1, 1074–1088 (2019). source
The Introduction (page unavailable) reports that clearing senescent cells in mouse models benefits an array of pathologies, including atherosclerosis, osteoarthritis and neurodegenerative diseases. The Discussion (page unavailable) also describes mouse studies in which cardiac glycosides, identified by this paper as senolytics, reduced atherosclerosis and ameliorated pulmonary fibrosis. The paper cautions that those latter benefits may have explanations beyond senolysis, consistent with the claim’s framing as promise rather than proof. (LLM, conf=0.86)
- Not matchedcites [14] Senolytic compounds. Patent no. 20200121620, (2018).
Couldn’t be matched to a paper in Crossref, so it can’t be checked.
- Supportedcites [15] Triana-Martínez, F. et al. Identification and characterization of Cardiac Glycosides as senolytic compounds. Nat. Commun. 10, 4731 (2019). source
The Discussion (page unavailable) reports that senolytic digoxin reduced tumor growth and lung fibrosis in mouse models. It also describes senolytics as promising treatments for age-related diseases, supporting the citing sentence’s broad, hedged characterization. (LLM, conf=0.88)
- Partly supportedcites [16] Yosef, R. et al. Directed elimination of senescent cells by inhibition of BCL-W and BCL-XL. Nat. Commun. 7, 11190 (2016). sourceExperimental — accuracy not yet measured
The Results report that ABT-737 eliminated senescent cells in two mouse models and increased hair-follicle stem-cell proliferation in one. The Discussion calls senolytic treatment promising, but says prominent hair regrowth was not observed. This paper therefore supports promise in mice, not amelioration of symptoms across many conditions. (LLM, conf=0.88)
- Supportedcites [17] Yousefzadeh, M. J. et al. Fisetin is a senotherapeutic that extends health and lifespan. EBioMedicine 36, 18–28 (2018). source
The Introduction reports improvements in multiple mouse conditions after senolytic treatment, including pulmonary fibrosis, liver steatosis, osteoporosis, and vascular dysfunction. It concludes that senolytic compounds can have significant effects on chronic degenerative diseases and age-related pathology. (LLM, conf=0.94)
- Supportedcites [18] Zhu, Y. et al. The Achilles’ heel of senescent cells: from transcriptome to senolytic drugs. Aging Cell. 14, 644–658 (2015). source
The Discussion reports that senolytics alleviated multiple types of dysfunction in mice, including cardiac and vascular impairment, irradiation-related dysfunction, and skeletal and neurological phenotypes. The Results also report reduced frailty and delayed symptoms in progeroid mice. These findings support the claim of promise across multiple conditions in mice. (LLM, conf=0.91)
- Supportedcites [19] Zhu, Y. et al. New agents that target senescent cells: the flavone, fisetin, and the BCL-X inhibitors, A1331852 and A1155463. Aging 9, 955–963 (2017). source
The Introduction (page unavailable in our copy) reports that dasatinib plus quercetin alleviated cardiovascular, frailty-related, osteoporotic, neurological, radiation-induced, and other conditions in several mouse models. This supports the claim about senolytics showing promise across many conditions in mice. (LLM, conf=0.94)
- Partly supportedcites [20] Chang, J. et al. Clearance of senescent cells by ABT263 rejuvenates aged hematopoietic stem cells in mice. Nat. Med. 22, 78–83 (2016). sourceExperimental — accuracy not yet measured
The Abstract reports that the senolytic ABT263 mitigated radiation-induced premature aging of the hematopoietic system and rejuvenated stem cells in aged mice. It does not show senolytics ameliorating symptoms across many conditions; its mention of several age-associated disorders concerns a transgenic approach to clearing senescent cells, not senolytic drugs. (LLM, conf=0.84)
plaindirect- Asserted: passes — The authors put it forward as true.
- Checkable: passes — It can be checked against evidence.
- Load-bearing: passes — The paper’s conclusions depend on it.
- Based: passes — The paper gives a reason why it holds.
- Supported
Every source the paper cites for this claim was checked and supports it.
In the paper
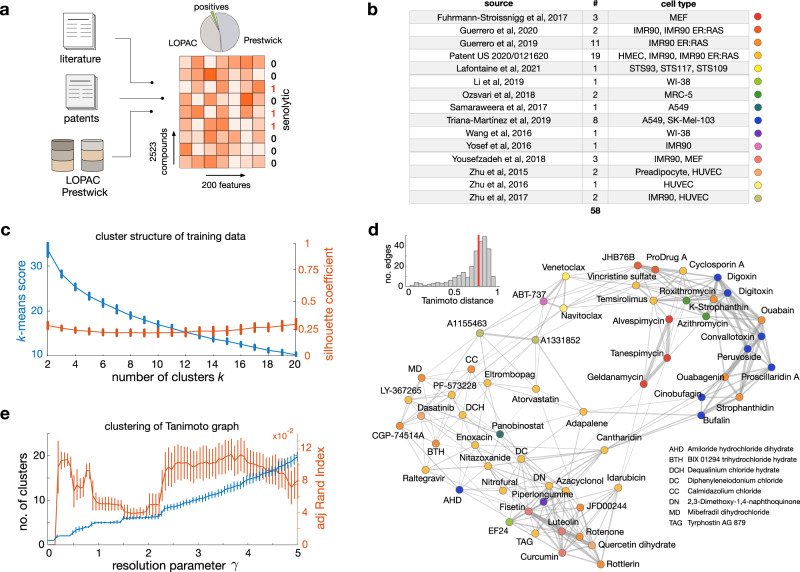
“We found low ARI scores (Fig. 1e) across all cluster resolutions described by the γ parameter; moreover, the ARI scores showed pronounced troughs at the plateaus detected with the Louvain method (mean ARI < 0.05 for 100 runs of the clustering method), which we regarded as sufficient evidence that compounds do not cluster according to the source from which they were obtained.”
§ Discovery of senolytics using machine learning > Results > Data assembly and quality control
What the sources say
- Supportedcites [61] Gates, A. J. & Ahn, Y.-Y. The impact of random models on clustering similarity. bioRxiv https://doi.org/10.1101/196840 (2017). source
Section 6.4 describes adjusted Rand scores as measures of clustering similarity relative to a random baseline, supporting their use to interpret low agreement. The mean ARI below 0.05 and the conclusion about compounds are explicitly the citing authors’ own results, not findings attributed to this source. (LLM, conf=0.86)
plain- Asserted: passes — The authors put it forward as true.
- Checkable: passes — It can be checked against evidence.
- Load-bearing: passes — The paper’s conclusions depend on it.
- Based: passes — The paper gives a reason why it holds.
- Supported
The cited sources that could be checked couldn’t confirm or dispute this claim.
In the paper
“We also benchmarked the XGBoost model against a deep learning model based on message-passing neural networks that have shown excellent performance across a range of molecular property prediction tasks39, but these were substantially outperformed by the XGBoost model (Supplementary Fig. 2).”
§ Discovery of senolytics using machine learning > Results > Predicting senolytic compounds by computational screen with machine learning
What the sources say
- Could not verifycites [39] Stokes, J. M. et al. A deep learning approach to antibiotic discovery. Cell 181, 475–483 (2020). sourceExperimental — accuracy not yet measured
The available copy is a correction notice (p. 475) that describes the paper’s machine-learning approach but does not compare XGBoost with message-passing neural networks. Searches for that comparison and for performance across molecular-property prediction tasks found no relevant passage. The citing sentence presents the XGBoost benchmark as the citing authors’ own result, not as a result attributed to this source. (LLM, conf=0.72)
plaindirect- Asserted: passes — The authors put it forward as true.
- Checkable: passes — It can be checked against evidence.
- Load-bearing: unclear — It is unclear whether the paper’s conclusions depend on it.
- Based: passes — The paper gives a reason why it holds.
- Could not verify
The sources with a verdict support this claim; the rest weren’t checked yet, have no full text we could read, or their verdicts aren’t rated yet.
In the paper
“We assembled a list of 58 previously identified senolytics mined from 15 sources11–19,23–28 (Fig. 1b).”
§ Discovery of senolytics using machine learning > Methods > A Data assembly, featurisation and quality control
What the sources say
- Supportedcites [11] Fuhrmann-Stroissnigg, H. et al. Identification of HSP90 inhibitors as a novel class of senolytics. Nat. Commun. 8, 422 (2017). source
The Results section ('HSP90 inhibitors are senolytic in different cell types and species'; page unavailable) reports senolytic activity for several HSP90 inhibitors. This supports citing the paper as one source of previously identified senolytics; the 58 compounds and 15 sources describe the citing authors’ own assembled list. (LLM, conf=0.90)
- Supportedcites [12] Guerrero, A. et al. Galactose-modified duocarmycin prodrugs as senolytics. Aging Cell. 19, e13133 (2020). source
The Results section, “A galactose-modified duocarmycin prodrug with senolytic properties,” reports preferential elimination of senescent cells and identifies the prodrugs as senolytics. This supports citing the paper as one source of previously identified senolytics; the counts of 58 compounds and 15 sources describe the citing authors’ own compilation, not a finding attributed to this paper. (LLM, conf=0.87)
- Supportedcites [13] Guerrero, A. et al. Cardiac glycosides are broad-spectrum senolytics. Nat. Metab. 1, 1074–1088 (2019). source
The Results section (‘Cardiac glycosides induce apoptosis of senescent cells’; page unavailable) reports that ouabain, digoxin and digitoxin behaved as senolytics. This supports citing the paper as one source of previously identified senolytics. The 58 compounds and 15 sources describe the citing authors’ compilation, not a count attributed to this individual paper. (LLM, conf=0.88)
- Not matchedcites [14] Senolytic compounds. Patent no. 20200121620, (2018).
Couldn’t be matched to a paper in Crossref, so it can’t be checked.
- Supportedcites [15] Triana-Martínez, F. et al. Identification and characterization of Cardiac Glycosides as senolytic compounds. Nat. Commun. 10, 4731 (2019). source
The Results section (“High-throughput compound screening for senolytic activity”; page not supplied) reports identifying senolytic activity in cardiac glycosides, including Proscillaridin A, Ouabain, and Digoxin. This supports citing the paper as a source of previously identified senolytics. The totals of 58 compounds and 15 sources describe the citing authors’ assembled list, not a finding attributed to this individual paper. (LLM, conf=0.90)
- Supportedcites [16] Yosef, R. et al. Directed elimination of senescent cells by inhibition of BCL-W and BCL-XL. Nat. Commun. 7, 11190 (2016). source
The Discussion identifies ABT-737 as a senolytic drug and reports its activity in two in vivo models. The citation supports this paper as one source of a previously identified senolytic; the total of 58 compounds from 15 sources describes the citing authors’ own compilation. (LLM, conf=0.90)
- Supportedcites [17] Yousefzadeh, M. J. et al. Fisetin is a senotherapeutic that extends health and lifespan. EBioMedicine 36, 18–28 (2018). source
The Results (Fig. 1; page not supplied) identify fisetin as a putative senolytic and report that it reduced the fraction of senescent cells. This supports citing the paper as one source for a previously identified senolytic. The totals of 58 senolytics and 15 sources describe the citing authors’ compilation, not a count attributed to this individual paper. (LLM, conf=0.87)
- Supportedcites [18] Zhu, Y. et al. The Achilles’ heel of senescent cells: from transcriptome to senolytic drugs. Aging Cell. 14, 644–658 (2015). source
The Results section ('Candidate senolytic drugs in vitro'; page unavailable) identifies dasatinib and quercetin as agents that selectively kill senescent cells. That supports citing this paper as one source of previously identified senolytics. The 58-drug list and count of 15 sources describe the citing authors’ compilation, not a finding attributed to this individual paper. (LLM, conf=0.88)
- Supportedcites [19] Zhu, Y. et al. New agents that target senescent cells: the flavone, fisetin, and the BCL-X inhibitors, A1331852 and A1155463. Aging 9, 955–963 (2017). source
The Discussion reports that this paper showed fisetin, A1331852, and A1155463 to be senolytic in vitro. It therefore qualifies as one of the sources for previously identified senolytics. The totals of 58 compounds and 15 sources describe the citing authors’ assembled list, not a finding attributed to this individual paper. (LLM, conf=0.91)
- Not checked yetcites [23] Lafontaine, J. et al. Senolytic targeting of Bcl-2 anti-apoptotic family increases cell death in irradiated sarcoma cells. Cancers https://doi.org/10.3390/cancers13030386 (2021). source
Checked before — its earlier verdict is held back until a new check runs.
plain- Asserted: passes — The authors put it forward as true.
- Checkable: passes — It can be checked against evidence.
- Load-bearing: passes — The paper’s conclusions depend on it.
- Based: passes — The paper gives a reason why it holds.
- Supported
A result the paper reports from its own data — it cites no other source for it, so there is none to check. The quote shows it is in the paper.
In the paper
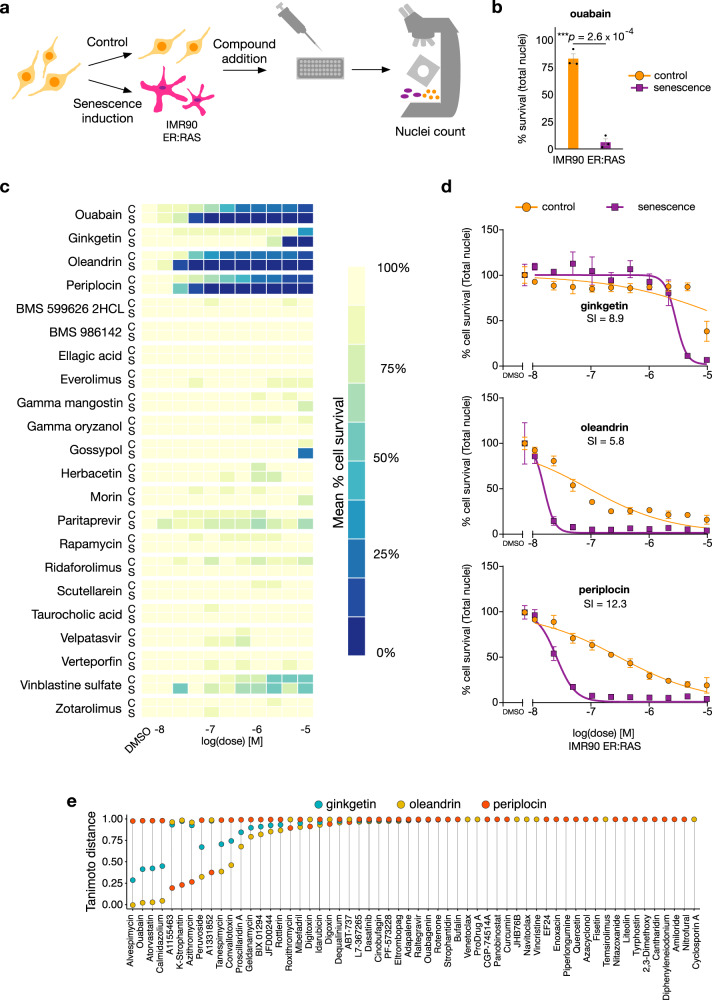
“We then tested the 21 candidate compounds and found three with clear senolytic action: periplocin and oleandrin, two cardiac glycosides which have not been previously identified as senolytics, and ginkgetin, a natural non-toxic biflavone; this amounts to a hit confirmation rate of 14.28% (Fig. 3c, d and Supplementary Fig. 4c).”
§ Discovery of senolytics using machine learning > Results > Identification of senolytics by experimental screening of top predicted compounds
plain- Asserted: passes — The authors put it forward as true.
- Checkable: passes — It can be checked against evidence.
- Load-bearing: passes — The paper’s conclusions depend on it.
- Based: passes — The paper gives a reason why it holds.
- It may state two separate claims as one. 44
- Probably not a substantial claim. 32
- The quote only partly states this claim. 1
The cited sources support only part of this claim — read each source’s verdict below.
In the paper
“The drop in cell number compared to untreated controls is indicated by the nuclei count and reflects cell death13,15.”
§ Discovery of senolytics using machine learning > Results > Identification of senolytics by experimental screening of top predicted compounds
What the sources say
- Partly supportedcites [13] Guerrero, A. et al. Cardiac glycosides are broad-spectrum senolytics. Nat. Metab. 1, 1074–1088 (2019). sourceExperimental — accuracy not yet measured
The Methods (High Content Analysis; no page available) describe using DAPI-stained nuclei to identify cells, and the Methods (IncuCyte analysis; no page available) describe a separate apoptosis readout. The paper therefore supports nuclei-based cell identification and measurement of cell death, but does not establish that a lower nuclei count than untreated controls, by itself, reflects cell death. (LLM, conf=0.78)
- Partly supportedcites [15] Triana-Martínez, F. et al. Identification and characterization of Cardiac Glycosides as senolytic compounds. Nat. Commun. 10, 4731 (2019). sourceExperimental — accuracy not yet measured
The Results section on high-throughput screening describes counting treated cells and using untreated wells as controls. The Results section on apoptosis separately shows that digoxin induces cell death in senescent cells. The paper does not say that a nuclei count itself establishes that a drop in cell number reflects cell death; its cell-death conclusion relies on apoptosis assays. (LLM, conf=0.83)
hedgeddirect- Asserted: passes — The authors put it forward as true.
- Checkable: passes — It can be checked against evidence.
- Load-bearing: passes — The paper’s conclusions depend on it.
- Based: passes — The paper gives a reason why it holds.
It may state two separate claims as one.
- Partly supported
The cited sources support only part of this claim — read each source’s verdict below.
In the paper
“Some of these compounds, e.g. ouabain13, have wide-spectrum senolytic action, whereas others such as BIX-01294, limit their effect to specific conditions13.”
§ Discovery of senolytics using machine learning > Results > Data assembly and quality control
What the sources say
- Partly supportedcites [13] Guerrero, A. et al. Cardiac glycosides are broad-spectrum senolytics. Nat. Metab. 1, 1074–1088 (2019). sourceExperimental — accuracy not yet measured
The Results section identifies ouabain as a broad-spectrum senolytic and reports that some screened compounds acted only against one type of senescent cell. BIX-01294 appears in the Methods drug list, but the text of our copy does not identify it as one of those condition-specific compounds. (LLM, conf=0.86)
plaindirect- Asserted: passes — The authors put it forward as true.
- Checkable: passes — It can be checked against evidence.
- Load-bearing: fails — The paper’s conclusions may not depend on it.
- Based: passes — The paper gives a reason why it holds.
Probably not a substantial claim. The paper’s conclusions may not depend on it. It may state two separate claims as one.
- Partly supported
Every source the paper cites for this claim was checked and supports it.
In the paper
“IMR90 ER:RAS is a derivative of IMR90 cells expressing a switchable version of oncogenic H-Ras84.”
§ Discovery of senolytics using machine learning > Methods > C Validation assays
What the sources say
- Supportedcites [84] Hari, P. et al. The innate immune sensor Toll-like receptor 2 controls the senescence-associated secretory phenotype. Sci. Adv. 5, eaaw0254 (2019). source
The Results section (‘The innate immune receptor TLR2 is induced during cellular senescence’) identifies IMR90 ER:RAS as IMR90 cells transduced with an estrogen receptor–H-RASG12V fusion protein. It says the protein’s oncogenic activity is induced by adding 4-hydroxytamoxifen, supporting the description of switchable oncogenic H-Ras. (LLM, conf=0.95)
plain- Asserted: passes — The authors put it forward as true.
- Checkable: passes — It can be checked against evidence.
- Load-bearing: passes — The paper’s conclusions depend on it.
- Based: passes — The paper gives a reason why it holds.
Probably not a substantial claim.
- Supported
The cited sources that could be checked couldn’t confirm or dispute this claim.
In the paper
“Our approach led to a significant reduction in experimental screening costs, largely because all models were trained solely on published data and, unlike other recent successes in the field39, there was no need to screen compounds purposely for model training.”
§ Discovery of senolytics using machine learning > Discussion
What the sources say
- Could not verifycites [39] Stokes, J. M. et al. A deep learning approach to antibiotic discovery. Cell 181, 475–483 (2020). sourceExperimental — accuracy not yet measured
The citation is attached to the comparison with other work that screened compounds specifically for model training, not to the citing authors’ claim about their own costs. The available copy is a correction notice (no section or page given); it mentions a training-data file but does not say whether compounds were screened to create it. Searches for model-training screens and screening costs did not resolve the point. (LLM, conf=0.70)
plaindirect- Asserted: passes — The authors put it forward as true.
- Checkable: passes — It can be checked against evidence.
- Load-bearing: passes — The paper’s conclusions depend on it.
- Based: passes — The paper gives a reason why it holds.
It may state two separate claims as one.
- Could not verify
A result the paper reports from its own data — it cites no other source for it, so there is none to check. The quote shows it is in the paper.
In the paper
“Here, we report the development and validation of a machine learning pipeline for the discovery of senolytics.”
§ Discovery of senolytics using machine learning > Introduction
plainn = 2- Asserted: passes — The authors put it forward as true.
- Checkable: passes — It can be checked against evidence.
- Load-bearing: passes — The paper’s conclusions depend on it.
- Based: passes — The paper gives a reason why it holds.
It may state two separate claims as one.
A result the paper reports from its own data — it cites no other source for it, so there is none to check. The quote shows it is in the paper.
In the paper
“In both models, oleandrin was the only compound showing a significant reduction in cellular content in senescent cultures at a concentration of 10 nM, while keeping the cellular density unchanged in non-senescent control cell cultures.”
§ Discovery of senolytics using machine learning > Results > AI-identified compound oleandrin displays improved senolytic performance over benchmark senolytic cardiac glycosides
plaindirect- Asserted: passes — The authors put it forward as true.
- Checkable: passes — It can be checked against evidence.
- Load-bearing: passes — The paper’s conclusions depend on it.
- Based: passes — The paper gives a reason why it holds.
It may state two separate claims as one.
The paper states this without a source or data behind it here, so there is nothing to check it against. The quote shows it is in the paper.
In the paper
“Both oleandrin and periplocin are steroid saponins, similar to ouabain, yet ginkgetin is a structurally distinct biflavone natural product.”
§ Discovery of senolytics using machine learning > Results > Identification of senolytics by experimental screening of top predicted compounds
plain- Asserted: passes — The authors put it forward as true.
- Checkable: passes — It can be checked against evidence.
- Load-bearing: passes — The paper’s conclusions depend on it.
- Based: passes — The paper gives a reason why it holds.
It may state two separate claims as one.
A result the paper reports from its own data — it cites no other source for it, so there is none to check. The quote shows it is in the paper.
In the paper
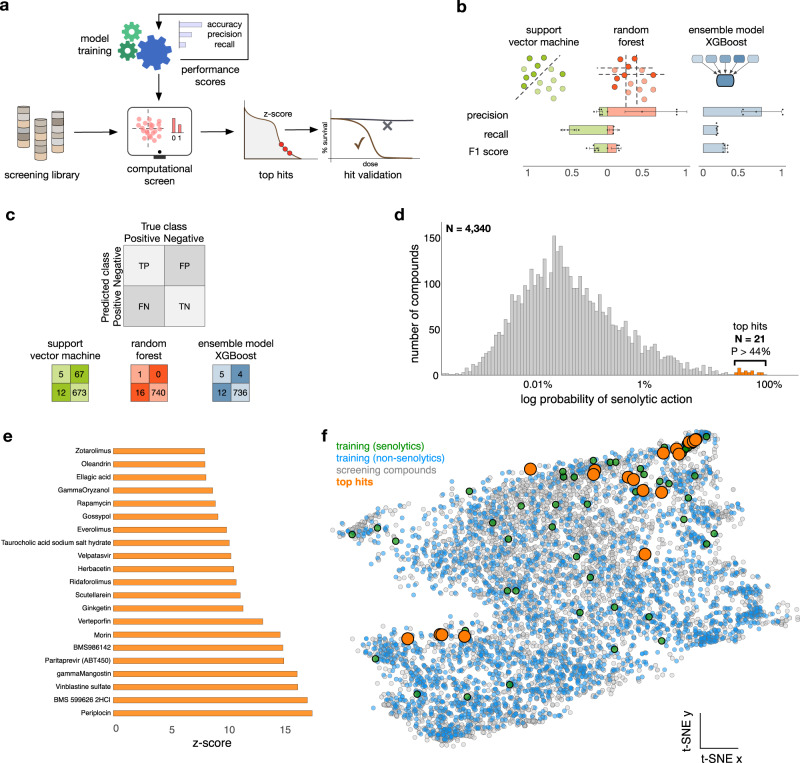
“The XGBoost model improved precision, recall, and F1 scores, and overall returned the best performance among all considered models (Fig. 2b).”
§ Discovery of senolytics using machine learning > Results > Predicting senolytic compounds by computational screen with machine learning
plaindirect- Asserted: passes — The authors put it forward as true.
- Checkable: passes — It can be checked against evidence.
- Load-bearing: passes — The paper’s conclusions depend on it.
- Based: passes — The paper gives a reason why it holds.
It may state two separate claims as one.
A result the paper reports from its own data — it cites no other source for it, so there is none to check. The quote shows it is in the paper.
In the paper
“At the far end of the tail, the score distribution revealed a small group of 21 compounds (0.4% of the full library) with a comparatively higher probability of being senolytic (P > 44%, Fig. 2d, orange), which we selected for further experimental validation.”
§ Discovery of senolytics using machine learning > Results > Predicting senolytic compounds by computational screen with machine learning
plaincorrelational- Asserted: passes — The authors put it forward as true.
- Checkable: passes — It can be checked against evidence.
- Load-bearing: passes — The paper’s conclusions depend on it.
- Based: passes — The paper gives a reason why it holds.
It may state two separate claims as one.
A result the paper reports from its own data — it cites no other source for it, so there is none to check. The quote shows it is in the paper.
In the paper
“We observed an average precision score of 0.7 ± 0.16 in 5-fold cross-validation on the whole dataset analysis of this model, which amounts to an average false discovery rate of 30% that we regarded as acceptable given the heterogeneity of the data employed for training.”
§ Discovery of senolytics using machine learning > Results > Predicting senolytic compounds by computational screen with machine learning
plain- Asserted: passes — The authors put it forward as true.
- Checkable: passes — It can be checked against evidence.
- Load-bearing: passes — The paper’s conclusions depend on it.
- Based: passes — The paper gives a reason why it holds.
It may state two separate claims as one.
A result the paper reports from its own data — it cites no other source for it, so there is none to check. The quote shows it is in the paper.
In the paper
“The three compounds showed enhanced toxicity when compared with proliferating, non-senescent A549 controls with an effect comparable to the positive control.”
§ Discovery of senolytics using machine learning > Results > Identification of senolytics by experimental screening of top predicted compounds
plaindirect- Asserted: passes — The authors put it forward as true.
- Checkable: passes — It can be checked against evidence.
- Load-bearing: passes — The paper’s conclusions depend on it.
- Based: passes — The paper gives a reason why it holds.
It may state two separate claims as one.
A result the paper reports from its own data — it cites no other source for it, so there is none to check. The quote shows it is in the paper.
In the paper
“In particular, periplocin (the top hit predicted by our model, Fig. 2d) showed a senolytic effect with a striking resemblance to the positive control ouabain (Fig. 3b, d).”
§ Discovery of senolytics using machine learning > Results > Identification of senolytics by experimental screening of top predicted compounds
boosteddirect- Asserted: passes — The authors put it forward as true.
- Checkable: passes — It can be checked against evidence.
- Load-bearing: passes — The paper’s conclusions depend on it.
- Based: passes — The paper gives a reason why it holds.
It may state two separate claims as one.
The paper states this without a source or data behind it here, so there is nothing to check it against. The quote shows it is in the paper.
In the paper
“Oleandrin and periplocin are related steroid saponins, similar to ouabain.”
§ Discovery of senolytics using machine learning > Results > Identification of senolytics by experimental screening of top predicted compounds
plaincorrelational- Asserted: passes — The authors put it forward as true.
- Checkable: passes — It can be checked against evidence.
- Load-bearing: fails — The paper’s conclusions may not depend on it.
- Based: fails — The paper may give no reason why it holds.
Probably not a substantial claim. The paper’s conclusions may not depend on it. The paper may give no reason why it holds. It may state two separate claims as one.
A result the paper reports from its own data — it cites no other source for it, so there is none to check. The quote shows it is in the paper.
In the paper
“The full dataset for model training contains 2523 compounds, including 58 positives (2.3%).”
§ Discovery of senolytics using machine learning > Results > Data assembly and quality control
plain- Asserted: passes — The authors put it forward as true.
- Checkable: passes — It can be checked against evidence.
- Load-bearing: passes — The paper’s conclusions depend on it.
- Based: passes — The paper gives a reason why it holds.
It may state two separate claims as one.
A result the paper reports from its own data — it cites no other source for it, so there is none to check. The quote shows it is in the paper.
In the paper
“The structure of the resulting distance graph corroborates the finding that most senolytics are far apart in the descriptor space (median Tanimoto distance = 0.77; Fig. 1d inset)”
§ Discovery of senolytics using machine learning > Results > Data assembly and quality control
plain- Asserted: passes — The authors put it forward as true.
- Checkable: passes — It can be checked against evidence.
- Load-bearing: unclear — It is unclear whether the paper’s conclusions depend on it.
- Based: passes — The paper gives a reason why it holds.
It may state two separate claims as one.
A result the paper reports from its own data — it cites no other source for it, so there is none to check. The quote shows it is in the paper.
In the paper
“we show that oleandrin has improved potency over its target as compared to best-in-class alternatives.”
- Also stated in: § Introduction · plain
“We further show that oleandrin has greater potency and activity over its target (Na+/K+ ATPase) and its senolytic effector NOXA, as compared to known cardiac glycosides with senolytic action.”
§ Discovery of senolytics using machine learning > Abstract
plaindirectn = 2- Asserted: passes — The authors put it forward as true.
- Checkable: passes — It can be checked against evidence.
- Load-bearing: passes — The paper’s conclusions depend on it.
- Based: passes — The paper gives a reason why it holds.
It may state two separate claims as one.
- Also stated in: § Introduction · plain
A result the paper reports from its own data — it cites no other source for it, so there is none to check. The quote shows it is in the paper.
In the paper
“The performance metrics (Fig. 2b) suggest that the RF model tends to return few false positives (high precision) and a high number of false negatives (low recall), whereas the SVM returns opposite results.”
§ Discovery of senolytics using machine learning > Results > Predicting senolytic compounds by computational screen with machine learning
hedgedcorrelational- Asserted: passes — The authors put it forward as true.
- Checkable: passes — It can be checked against evidence.
- Load-bearing: unclear — It is unclear whether the paper’s conclusions depend on it.
- Based: passes — The paper gives a reason why it holds.
It may state two separate claims as one.
A result the paper reports from its own data — it cites no other source for it, so there is none to check. The quote shows it is in the paper.
In the paper
“Three compounds out of the 21 displayed senolytic activity: ginkgetin, oleandrin and periplocin”
- Also stated in: § Abstract · plain
“validated the senolytic action of ginkgetin, periplocin and oleandrin in human cell lines under various modalities of senescence.”
§ Discovery of senolytics using machine learning > Results > Identification of senolytics by experimental screening of top predicted compounds
plaindirectn = 2- Asserted: passes — The authors put it forward as true.
- Checkable: passes — It can be checked against evidence.
- Load-bearing: passes — The paper’s conclusions depend on it.
- Based: passes — The paper gives a reason why it holds.
The quote only partly states this claim.
- Also stated in: § Abstract · plain
A result the paper reports from its own data — it cites no other source for it, so there is none to check. The quote shows it is in the paper.
In the paper
“Addition of 1 μM navitoclax to A549 cells killed most of the cultured senescent cells, but resulted in no reduction in numbers of non-senescent control cells, confirming its optimal senolytic activity (Supplementary Fig. 6b).”
§ Discovery of senolytics using machine learning > Results > Identification of senolytics by experimental screening of top predicted compounds
boosteddirect- Asserted: passes — The authors put it forward as true.
- Checkable: passes — It can be checked against evidence.
- Load-bearing: passes — The paper’s conclusions depend on it.
- Based: passes — The paper gives a reason why it holds.
It may state two separate claims as one.
A result the paper reports from its own data — it cites no other source for it, so there is none to check. The quote shows it is in the paper.
In the paper
“These concentrations have a marginal effect on the nuclei counts in normal cells, but a marked decrease in nuclei counts in senescent cells (Fig. 3c, d and Supplementary Fig. 5a).”
§ Discovery of senolytics using machine learning > Results > Identification of senolytics by experimental screening of top predicted compounds
plaindirect- Asserted: passes — The authors put it forward as true.
- Checkable: passes — It can be checked against evidence.
- Load-bearing: passes — The paper’s conclusions depend on it.
- Based: passes — The paper gives a reason why it holds.
It may state two separate claims as one.
A result the paper reports from its own data — it cites no other source for it, so there is none to check. The quote shows it is in the paper.
In the paper
“This concentration killed most of the cultured senescent cells, but resulted in marginal reduction of the number of non-senescent control cells (Fig. 3b).”
§ Discovery of senolytics using machine learning > Results > Identification of senolytics by experimental screening of top predicted compounds
plaindirect- Asserted: passes — The authors put it forward as true.
- Checkable: passes — It can be checked against evidence.
- Load-bearing: passes — The paper’s conclusions depend on it.
- Based: passes — The paper gives a reason why it holds.
It may state two separate claims as one.
A result the paper reports from its own data — it cites no other source for it, so there is none to check. The quote shows it is in the paper.
In the paper
“Treatment of IMR90 ER:RAS cells with 4-OHT showed a decrease in proliferation, increased senescence-associated β-galactosidase activity, induction of cell cycle inhibitor expression, and activation of the SASP when compared with control and 4-OHT untreated cells, indicating that the cells underwent OIS (Supplementary Fig. 3).”
§ Discovery of senolytics using machine learning > Results > Identification of senolytics by experimental screening of top predicted compounds
hedgeddirect- Asserted: passes — The authors put it forward as true.
- Checkable: passes — It can be checked against evidence.
- Load-bearing: passes — The paper’s conclusions depend on it.
- Based: passes — The paper gives a reason why it holds.
It may state two separate claims as one.
The paper states this without a source or data behind it here, so there is nothing to check it against. The quote shows it is in the paper.
In the paper
“Ginkgetin is a structurally distinct biflavone”
§ Discovery of senolytics using machine learning > Results > Identification of senolytics by experimental screening of top predicted compounds
plain- Asserted: passes — The authors put it forward as true.
- Checkable: passes — It can be checked against evidence.
- Load-bearing: fails — The paper’s conclusions may not depend on it.
- Based: passes — The paper gives a reason why it holds.
Probably not a substantial claim. The paper’s conclusions may not depend on it.
A result the paper reports from its own data — it cites no other source for it, so there is none to check. The quote shows it is in the paper.
In the paper
“The XGBoost model proved to be exceptionally selective and produced a long-tailed distribution of prediction scores (Fig. 2d); most compounds were assigned extremely low prediction scores, and thus deemed to have a low probability of being senolytic.”
§ Discovery of senolytics using machine learning > Results > Predicting senolytic compounds by computational screen with machine learning
plain- Asserted: passes — The authors put it forward as true.
- Checkable: passes — It can be checked against evidence.
- Load-bearing: passes — The paper’s conclusions depend on it.
- Based: passes — The paper gives a reason why it holds.
It may state two separate claims as one.
A result the paper reports from its own data — it cites no other source for it, so there is none to check. The quote shows it is in the paper.
In the paper
“The majority of the selected compounds are structurally diverse natural products, but with some common features including steroid saponins, flavone derivatives, and macrocycles.”
§ Discovery of senolytics using machine learning > Results > Predicting senolytic compounds by computational screen with machine learning
plain- Asserted: passes — The authors put it forward as true.
- Checkable: passes — It can be checked against evidence.
- Load-bearing: unclear — It is unclear whether the paper’s conclusions depend on it.
- Based: passes — The paper gives a reason why it holds.
It may state two separate claims as one.
A result the paper reports from its own data — it cites no other source for it, so there is none to check. The quote shows it is in the paper.
In the paper
“We assembled compounds from the L2100 TargetMol Anticancer and L3800 Selleck FDA-approved & Passed Phase libraries into a single dataset with 4340 structures featurised with the physicochemical descriptors from RDKit; none of the compounds in the screening library were present in the training library.”
§ Discovery of senolytics using machine learning > Results > Predicting senolytic compounds by computational screen with machine learning
plain- Asserted: passes — The authors put it forward as true.
- Checkable: passes — It can be checked against evidence.
- Load-bearing: passes — The paper’s conclusions depend on it.
- Based: passes — The paper gives a reason why it holds.
It may state two separate claims as one.
The paper states this without a source or data behind it here, so there is nothing to check it against. The quote shows it is in the paper.
In the paper
“We mitigated the impact of class imbalance by prioritising models with a lower number of false positives, and thus reduce the downstream costs for experimental validation.”
§ Discovery of senolytics using machine learning > Discussion
plaindirect- Asserted: passes — The authors put it forward as true.
- Checkable: passes — It can be checked against evidence.
- Load-bearing: passes — The paper’s conclusions depend on it.
- Based: passes — The paper gives a reason why it holds.
It may state two separate claims as one.
The paper states this without a source or data behind it here, so there is nothing to check it against. The quote shows it is in the paper.
In the paper
“Although all compounds from these two library sources were assumed to be negative, it is plausible that some of these molecules were incorrectly labelled.”
§ Discovery of senolytics using machine learning > Methods > A Data assembly, featurisation and quality control
hedged- Asserted: passes — The authors put it forward as true.
- Checkable: passes — It can be checked against evidence.
- Load-bearing: fails — The paper’s conclusions may not depend on it.
- Based: passes — The paper gives a reason why it holds.
Probably not a substantial claim. The paper’s conclusions may not depend on it.
- The authors state this as an assumption: All compounds from the LOPAC-1280 and Prestwick FDA-approved-1280 libraries lack senolytic action.
A result the paper reports from its own data — it cites no other source for it, so there is none to check. The quote shows it is in the paper.
In the paper
“Dimensionality reduction of this data proved to be challenging, as more than 50% of the 200 RDKit features were needed to explain 99% of the variance.”
§ Discovery of senolytics using machine learning > Methods > B Model training and computational screen
plain- Asserted: passes — The authors put it forward as true.
- Checkable: passes — It can be checked against evidence.
- Load-bearing: fails — The paper’s conclusions may not depend on it.
- Based: passes — The paper gives a reason why it holds.
Probably not a substantial claim. The paper’s conclusions may not depend on it.
A result the paper reports from its own data — it cites no other source for it, so there is none to check. The quote shows it is in the paper.
In the paper
“In the case of SVM, the setting of ‘class weight’ to ‘balanced’ was the best option, whereas for the RF the best setting was the default one.”
§ Discovery of senolytics using machine learning > Methods > B Model training and computational screen
plaindirect- Asserted: passes — The authors put it forward as true.
- Checkable: passes — It can be checked against evidence.
- Load-bearing: unclear — It is unclear whether the paper’s conclusions depend on it.
- Based: passes — The paper gives a reason why it holds.
It may state two separate claims as one.
The paper states this without a source or data behind it here, so there is nothing to check it against. The quote shows it is in the paper.
In the paper
“This led to an exceptionally selective distribution of prediction scores (Fig. 2d), which allowed us to select a cutoff for experimental validation with a reasonable number of hits and prediction scores far away from the bulk of the screening compounds.”
§ Discovery of senolytics using machine learning > Discussion
plaindirect- Asserted: passes — The authors put it forward as true.
- Checkable: passes — It can be checked against evidence.
- Load-bearing: passes — The paper’s conclusions depend on it.
- Based: passes — The paper gives a reason why it holds.
It may state two separate claims as one.
A result the paper reports from its own data — it cites no other source for it, so there is none to check. The quote shows it is in the paper.
In the paper
“We performed experimental validation of the compounds with z-score > 8 (Fig. 2e). These correspond to 21 compounds out of a total of 4340 compounds in our screening libraries.”
§ Discovery of senolytics using machine learning > Methods > C Validation assays
plain- Asserted: passes — The authors put it forward as true.
- Checkable: passes — It can be checked against evidence.
- Load-bearing: fails — The paper’s conclusions may not depend on it.
- Based: passes — The paper gives a reason why it holds.
Probably not a substantial claim. The paper’s conclusions may not depend on it.
A result the paper reports from its own data — it cites no other source for it, so there is none to check. The quote shows it is in the paper.
In the paper
“We attempted to resolve the severe class imbalance problem inherent to our data by utilising the pre-processing technique SMOTE on several classification algorithms, without significant improvement; SMOTE was applied to the training set only.”
§ Discovery of senolytics using machine learning > Methods > B Model training and computational screen
plain- Asserted: passes — The authors put it forward as true.
- Checkable: passes — It can be checked against evidence.
- Load-bearing: unclear — It is unclear whether the paper’s conclusions depend on it.
- Based: passes — The paper gives a reason why it holds.
It may state two separate claims as one.
A result the paper reports from its own data — it cites no other source for it, so there is none to check. The quote shows it is in the paper.
In the paper
“We observed limited benefits in the use of deep learning for compound featurisation, possibly because of the small size of our training data.”
§ Discovery of senolytics using machine learning > Discussion
hedgedconditional- Asserted: passes — The authors put it forward as true.
- Checkable: passes — It can be checked against evidence.
- Load-bearing: unclear — It is unclear whether the paper’s conclusions depend on it.
- Based: passes — The paper gives a reason why it holds.
It may state two separate claims as one.
What the paper did — it cites no source for this, so there is none to check. The quote shows it is in the paper.
In the paper
“Wherever possible, we cross-validated different studies, e.g. for widely reported senolytics such as navitoclax, digoxin, ouabain, ABT-737 and fisetin.”
§ Discovery of senolytics using machine learning > Results > Data assembly and quality control
hedged- Asserted: passes — The authors put it forward as true.
- Checkable: passes — It can be checked against evidence.
- Load-bearing: fails — The paper’s conclusions may not depend on it.
- Based: passes — The paper gives a reason why it holds.
Probably not a substantial claim. The paper’s conclusions may not depend on it.
None of the sources cited for this claim have been checked yet.
In the paper
“most known senolytics target pathways that are mutated in cancer, which limits their applicability as therapeutic agents32”
§ Discovery of senolytics using machine learning > Introduction
What the sources say
- Not checked yetcites [32] Paez-Ribes, M., González-Gualda, E., Doherty, G. J. & Muñoz-Espín, D. Targeting senescent cells in translational medicine. EMBO Mol. Med. 11, e10234 (2019). source
Checked before — its earlier verdict is held back until a new check runs.
plaindirect- Asserted: passes — The authors put it forward as true.
- Checkable: passes — It can be checked against evidence.
- Load-bearing: passes — The paper’s conclusions depend on it.
- Based: passes — The paper gives a reason why it holds.
It may state two separate claims as one.
- Not checked yet
None of the sources cited for this claim have been checked yet.
In the paper
“Several studies have shown that flavonoids are promising candidates in senescence-related research, hence the importance of finding new and more efficacious compounds of this kind67–69.”
§ Discovery of senolytics using machine learning > Results > Identification of senolytics by experimental screening of top predicted compounds
What the sources say
- Not checked yetcites [67] Mbara, K. C., Devnarain, N. & Owira, P. M. O. Potential role of polyphenolic flavonoids as senotherapeutic agents in degenerative diseases and geroprotection. Pharmaceut. Med. https://doi.org/10.1007/s40290-022-00444-w (2022). source
Checked before — its earlier verdict is held back until a new check runs.
- Not checked — no full text of the sourcecites [68] Lim, H., Park, H. & Kim, H. P. Effects of flavonoids on senescence-associated secretory phenotype formation from bleomycin-induced senescence in BJ fibroblasts. Biochem. Pharmacol. 96, 337–348 (2015). source
- Not checked — no full text of the sourcecites [69] Lagoumtzi, S. M. & Chondrogianni, N. Senolytics and senomorphics: natural and synthetic therapeutics in the treatment of aging and chronic diseases. Free Radic. Biol. Med. 171, 169–190 (2021). source
plaincorrelational- Asserted: passes — The authors put it forward as true.
- Checkable: passes — It can be checked against evidence.
- Load-bearing: fails — The paper’s conclusions may not depend on it.
- Based: passes — The paper gives a reason why it holds.
Probably not a substantial claim. The paper’s conclusions may not depend on it.
- Not checked yet
What the paper did — it cites no source for this, so there is none to check. The quote shows it is in the paper.
In the paper
“The hyperparameters of the SVM and RF models were determined using 5-fold cross-validation (Supplementary Tables 3–4).”
§ Discovery of senolytics using machine learning > Results > Predicting senolytic compounds by computational screen with machine learning
plaindirect- Asserted: passes — The authors put it forward as true.
- Checkable: passes — It can be checked against evidence.
- Load-bearing: fails — The paper’s conclusions may not depend on it.
- Based: passes — The paper gives a reason why it holds.
Probably not a substantial claim. The paper’s conclusions may not depend on it.
In the paper
“We employed dimensionality reduction to visualise the training and screening compounds in the RDKit feature space65, which revealed a strong overlap between the two sets and thus a strong evidence that the computational screen was performed in the high-confidence domain of the machine learning model (Fig. 2f).”
§ Discovery of senolytics using machine learning > Results > Predicting senolytic compounds by computational screen with machine learning
What the sources say
- Not matchedcites [65] van der Maaten, L. & Hinton, G. Visualizing data using t-SNE. J. Mach. Learn Res. 9, 2579–2605 (2008).
Couldn’t be matched to a paper in Crossref, so it can’t be checked.
boostedcorrelational- Asserted: passes — The authors put it forward as true.
- Checkable: passes — It can be checked against evidence.
- Load-bearing: passes — The paper’s conclusions depend on it.
- Based: passes — The paper gives a reason why it holds.
It may state two separate claims as one.
- Not matched
In the paper
“The senolytic effect of cardiac glycosides has been previously linked to its canonical target, the Na+/K+ ATPase pump13.”
§ Discovery of senolytics using machine learning > Results > AI-identified compound oleandrin displays improved senolytic performance over benchmark senolytic cardiac glycosides
What the sources say
- Not checked yetcites [13] Guerrero, A. et al. Cardiac glycosides are broad-spectrum senolytics. Nat. Metab. 1, 1074–1088 (2019). source
plaincorrelational- Asserted: passes — The authors put it forward as true.
- Checkable: passes — It can be checked against evidence.
- Load-bearing: passes — The paper’s conclusions depend on it.
- Based: passes — The paper gives a reason why it holds.
Probably not a substantial claim.
What the paper did — it cites no source for this, so there is none to check. The quote shows it is in the paper.
In the paper
“These compounds were selected on the basis that they can maintain a minimum of 60% viability in normal cells and eliminate senescent cells for at least one cell line, one concentration, and one strategy for induction of senescence.”
§ Discovery of senolytics using machine learning > Results > Data assembly and quality control
plaindirect- Asserted: passes — The authors put it forward as true.
- Checkable: passes — It can be checked against evidence.
- Load-bearing: passes — The paper’s conclusions depend on it.
- Based: passes — The paper gives a reason why it holds.
Probably not a substantial claim.
What the paper did — it cites no source for this, so there is none to check. The quote shows it is in the paper.
In the paper
“The hyperparameters of the XGBoost model were determined via 5-fold cross-validation (Supplementary Table 5).”
§ Discovery of senolytics using machine learning > Results > Predicting senolytic compounds by computational screen with machine learning
plain- Asserted: passes — The authors put it forward as true.
- Checkable: passes — It can be checked against evidence.
- Load-bearing: fails — The paper’s conclusions may not depend on it.
- Based: passes — The paper gives a reason why it holds.
Probably not a substantial claim. The paper’s conclusions may not depend on it.
A conclusion the paper draws from its own results — it cites no other source for it, so there is none to check. The quote shows it is in the paper.
In the paper
“The lack of a clear “elbow” in the k-means score suggests poor data clustering and hence provides a qualitative indication of diversity in the training data.”
§ Discovery of senolytics using machine learning > Results > Data assembly and quality control
hedgedcorrelational- Asserted: passes — The authors put it forward as true.
- Checkable: passes — It can be checked against evidence.
- Load-bearing: passes — The paper’s conclusions depend on it.
- Based: passes — The paper gives a reason why it holds.
It may state two separate claims as one.
What the paper did — it cites no source for this, so there is none to check. The quote shows it is in the paper.
In the paper
“This drug screen was done once with three experimental replicates.”
§ Discovery of senolytics using machine learning > Results > Identification of senolytics by experimental screening of top predicted compounds
plainn = 3- Asserted: passes — The authors put it forward as true.
- Checkable: passes — It can be checked against evidence.
- Load-bearing: fails — The paper’s conclusions may not depend on it.
- Based: passes — The paper gives a reason why it holds.
Probably not a substantial claim. The paper’s conclusions may not depend on it.
What the paper did — it cites no source for this, so there is none to check. The quote shows it is in the paper.
In the paper
“This was done with 5-fold cross-validation to check for overfitting.”
§ Discovery of senolytics using machine learning > Methods > B Model training and computational screen
plain- Asserted: passes — The authors put it forward as true.
- Checkable: passes — It can be checked against evidence.
- Load-bearing: fails — The paper’s conclusions may not depend on it.
- Based: passes — The paper gives a reason why it holds.
Probably not a substantial claim. The paper’s conclusions may not depend on it.
What the paper did — it cites no source for this, so there is none to check. The quote shows it is in the paper.
In the paper
“hyperparameter optimisation settings were applied only to the training set in each of the five folds.”
§ Discovery of senolytics using machine learning > Methods > B Model training and computational screen
plain- Asserted: passes — The authors put it forward as true.
- Checkable: passes — It can be checked against evidence.
- Load-bearing: fails — The paper’s conclusions may not depend on it.
- Based: passes — The paper gives a reason why it holds.
Probably not a substantial claim. The paper’s conclusions may not depend on it.
What the paper did — it cites no source for this, so there is none to check. The quote shows it is in the paper.
In the paper
“Cells were tested for mycoplasma on a regular basis.”
§ Discovery of senolytics using machine learning > Methods > C Validation assays
plain- Asserted: passes — The authors put it forward as true.
- Checkable: passes — It can be checked against evidence.
- Load-bearing: fails — The paper’s conclusions may not depend on it.
- Based: passes — The paper gives a reason why it holds.
Probably not a substantial claim. The paper’s conclusions may not depend on it.
In the paper
“Specifically, ouabain induces the expression of the BH3-only pro-apoptotic protein NOXA, which mediates its senolytic effect.”
§ Discovery of senolytics using machine learning > Results > AI-identified compound oleandrin displays improved senolytic performance over benchmark senolytic cardiac glycosides
What the sources say
- Not checked yetcites [13] Guerrero, A. et al. Cardiac glycosides are broad-spectrum senolytics. Nat. Metab. 1, 1074–1088 (2019). source
plaindirect- Asserted: passes — The authors put it forward as true.
- Checkable: passes — It can be checked against evidence.
- Load-bearing: passes — The paper’s conclusions depend on it.
- Based: passes — The paper gives a reason why it holds.
It may state two separate claims as one.
What the paper did — it cites no source for this, so there is none to check. The quote shows it is in the paper.
In the paper
“In all cases, exposure time, sensor gain, and digital manipulation were the same for control and experimental samples.”
§ Discovery of senolytics using machine learning > Methods > C Validation assays
plain- Asserted: passes — The authors put it forward as true.
- Checkable: passes — It can be checked against evidence.
- Load-bearing: passes — The paper’s conclusions depend on it.
- Based: passes — The paper gives a reason why it holds.
Probably not a substantial claim.
None of the sources cited for this claim have been checked yet.
In the paper
“we highlight that the three senolytics identified in this study are natural products found in traditional herbal medicines: Ginkgo biloba (ginkgetin)79 Nerium oleander (oleandrin)76 and Periploca sepium (periplocin)80.”
§ Discovery of senolytics using machine learning > Discussion
What the sources say
- Not checked — no full text of the sourcecites [79] Website. ginkgetin: a natural biflavone with versatile pharmacological activities. Food Chem. Toxicol. https://doi.org/10.1016/j.fct.2020.111642 (2020). source
- Not checked yetcites [76] Zhai, J., Dong, X., Yan, F., Guo, H. & Yang, J. Oleandrin: a systematic review of its natural sources, structural properties, detection methods, pharmacokinetics and toxicology. Front. Pharmacol. 13, 822726 (2022). source
Checked before — its earlier verdict is held back until a new check runs.
- Not checked yetcites [80] Huang, M., Shen, S., Luo, C. & Ren, Y. Genus Periploca (apocynaceae): a review of its classification, phytochemistry, biological activities and toxicology. Molecules. https://doi.org/10.3390/molecules24152749 (2019). source
Checked before — its earlier verdict is held back until a new check runs.
plain- Asserted: passes — The authors put it forward as true.
- Checkable: passes — It can be checked against evidence.
- Load-bearing: passes — The paper’s conclusions depend on it.
- Based: passes — The paper gives a reason why it holds.
It may state two separate claims as one.
What the paper did — it cites no source for this, so there is none to check. The quote shows it is in the paper.
In the paper
“The cell lines were confirmed to be mycoplasma negative (Lonza MycoAlert, cat #LT07-118).”
§ Discovery of senolytics using machine learning > Methods > C Validation assays
plain- Asserted: passes — The authors put it forward as true.
- Checkable: passes — It can be checked against evidence.
- Load-bearing: fails — The paper’s conclusions may not depend on it.
- Based: passes — The paper gives a reason why it holds.
Probably not a substantial claim. The paper’s conclusions may not depend on it.
What the paper did — it cites no source for this, so there is none to check. The quote shows it is in the paper.
In the paper
“Sample sizes were based in standard protocols in the field.”
§ Discovery of senolytics using machine learning > Methods > C Validation assays
plain- Asserted: passes — The authors put it forward as true.
- Checkable: passes — It can be checked against evidence.
- Load-bearing: fails — The paper’s conclusions may not depend on it.
- Based: fails — The paper may give no reason why it holds.
Probably not a substantial claim. The paper’s conclusions may not depend on it. The paper may give no reason why it holds.
The paper states this without a source or data behind it here, so there is nothing to check it against. The quote shows it is in the paper.
In the paper
“Oleandrin and periplocin belong to the group of cardenolide glycosides, which are highly potent cardioactive agents, while ginkgetin is a biflavone with a broad pharmacological spectrum.”
§ Discovery of senolytics using machine learning > Discussion
plain- Asserted: passes — The authors put it forward as true.
- Checkable: passes — It can be checked against evidence.
- Load-bearing: fails — The paper’s conclusions may not depend on it.
- Based: passes — The paper gives a reason why it holds.
Probably not a substantial claim. The paper’s conclusions may not depend on it. It may state two separate claims as one.
A conclusion the paper draws from its own results — it cites no other source for it, so there is none to check. The quote shows it is in the paper.
In the paper
“our results suggest that oleandrin is not an exception because of its narrow therapeutic range and cardiotoxicity”
§ Discovery of senolytics using machine learning > Discussion
hedged- Asserted: passes — The authors put it forward as true.
- Checkable: passes — It can be checked against evidence.
- Load-bearing: passes — The paper’s conclusions depend on it.
- Based: passes — The paper gives a reason why it holds.
It may state two separate claims as one.
A conclusion the paper draws from its own results — it cites no other source for it, so there is none to check. The quote shows it is in the paper.
In the paper
“the exceptional activity and potency of oleandrin, together with its relatively low molecular weight (576.7 g/mol) and favourable cLogP (2.4), make it a promising lead candidate as compared to periplocin and ginkgetin (Supplementary Fig. 11).”
§ Discovery of senolytics using machine learning > Discussion
plaindirect- Asserted: passes — The authors put it forward as true.
- Checkable: passes — It can be checked against evidence.
- Load-bearing: passes — The paper’s conclusions depend on it.
- Based: passes — The paper gives a reason why it holds.
It may state two separate claims as one.
What the paper did — it cites no source for this, so there is none to check. The quote shows it is in the paper.
In the paper
“We employed two cellular models of senescence: one of OIS and a second one of TIS.”
§ Discovery of senolytics using machine learning > Methods > C Validation assays
plain- Asserted: passes — The authors put it forward as true.
- Checkable: passes — It can be checked against evidence.
- Load-bearing: passes — The paper’s conclusions depend on it.
- Based: passes — The paper gives a reason why it holds.
Probably not a substantial claim.
What the paper did — it cites no source for this, so there is none to check. The quote shows it is in the paper.
In the paper
“All measurements were taken from distinct samples, as noted in figure legends, and no data were excluded.”
§ Discovery of senolytics using machine learning > Methods > C Validation assays
plain- Asserted: passes — The authors put it forward as true.
- Checkable: passes — It can be checked against evidence.
- Load-bearing: passes — The paper’s conclusions depend on it.
- Based: passes — The paper gives a reason why it holds.
Probably not a substantial claim. It may state two separate claims as one.
What the paper did — it cites no source for this, so there is none to check. The quote shows it is in the paper.
In the paper
“For in vitro biological experiments, cell culture plates were randomly assigned to treatments in each experiment.”
§ Discovery of senolytics using machine learning > Methods > C Validation assays
plain- Asserted: passes — The authors put it forward as true.
- Checkable: passes — It can be checked against evidence.
- Load-bearing: fails — The paper’s conclusions may not depend on it.
- Based: passes — The paper gives a reason why it holds.
Probably not a substantial claim. The paper’s conclusions may not depend on it.
A conclusion the paper draws from its own results — it cites no other source for it, so there is none to check. The quote shows it is in the paper.
In the paper
“Oleandrin has improved senolytic performance over ouabain, functioning at a low nanomolar range, inhibiting its canonical target and activating its senolytic pathway with higher efficacy.”
§ Discovery of senolytics using machine learning > Discussion
plaindirect- Asserted: passes — The authors put it forward as true.
- Checkable: passes — It can be checked against evidence.
- Load-bearing: passes — The paper’s conclusions depend on it.
- Based: passes — The paper gives a reason why it holds.
It may state two separate claims as one.
What the paper did — it cites no source for this, so there is none to check. The quote shows it is in the paper.
In the paper
“Unless otherwise stated, at least three biological independent replicates were performed for each experiment.”
§ Discovery of senolytics using machine learning > Methods > C Validation assays
plain- Asserted: passes — The authors put it forward as true.
- Checkable: passes — It can be checked against evidence.
- Load-bearing: fails — The paper’s conclusions may not depend on it.
- Based: passes — The paper gives a reason why it holds.
Probably not a substantial claim. The paper’s conclusions may not depend on it.
A conclusion the paper draws from its own results — it cites no other source for it, so there is none to check. The quote shows it is in the paper.
In the paper
“These findings provide evidence that oleandrin treatment reduced both senescence burden and proinflammatory SASP signalling.”
§ Discovery of senolytics using machine learning > Results > AI-identified compound oleandrin displays improved senolytic performance over benchmark senolytic cardiac glycosides
plaindirect- Asserted: passes — The authors put it forward as true.
- Checkable: passes — It can be checked against evidence.
- Load-bearing: passes — The paper’s conclusions depend on it.
- Based: passes — The paper gives a reason why it holds.
It may state two separate claims as one.
A conclusion the paper draws from its own results — it cites no other source for it, so there is none to check. The quote shows it is in the paper.
In the paper
“Altogether, these results demonstrate that our machine learning approach was able to discover an improved and more potent cardiac glycoside with senolytic action, facilitating the identification of chemical structure baits for further downstream chemical optimisation.”
§ Discovery of senolytics using machine learning > Results > AI-identified compound oleandrin displays improved senolytic performance over benchmark senolytic cardiac glycosides
boosteddirect- Asserted: passes — The authors put it forward as true.
- Checkable: passes — It can be checked against evidence.
- Load-bearing: passes — The paper’s conclusions depend on it.
- Based: passes — The paper gives a reason why it holds.
It may state two separate claims as one.
The paper states this without a source or data behind it here, so there is nothing to check it against. The quote shows it is in the paper.
In the paper
“Oleandrin shares key structural features with other cardiac glycosides, including the presence of a sugar attached to the steroid core (at the C3β-OH group), a 2-furanone ring at C17β and an OH group at the C14β position of the steroid ring. Unlike most cardiac glycosides, oleandrin has an acetyloxy group attached at position C16β.”
§ Discovery of senolytics using machine learning > Discussion
plain- Asserted: passes — The authors put it forward as true.
- Checkable: passes — It can be checked against evidence.
- Load-bearing: fails — The paper’s conclusions may not depend on it.
- Based: passes — The paper gives a reason why it holds.
Probably not a substantial claim. The paper’s conclusions may not depend on it. It may state two separate claims as one.
What the paper did — it cites no source for this, so there is none to check. The quote shows it is in the paper.
In the paper
“We subsequently re-trained the XGBoost, RF, and SVM models with a stratified random split of the data (70% for training, and 30% for testing) to produce the confusion matrices in Fig. 2c.”
§ Discovery of senolytics using machine learning > Methods > B Model training and computational screen
plaindirect- Asserted: passes — The authors put it forward as true.
- Checkable: passes — It can be checked against evidence.
- Load-bearing: passes — The paper’s conclusions depend on it.
- Based: passes — The paper gives a reason why it holds.
Probably not a substantial claim.
What the paper did — it cites no source for this, so there is none to check. The quote shows it is in the paper.
In the paper
“For all other experiments, data collection and analysis were blinded to the person collecting and analysing the data, and the samples were identified only at the end of each experimental analysis.”
§ Discovery of senolytics using machine learning > Methods > C Validation assays
plain- Asserted: passes — The authors put it forward as true.
- Checkable: passes — It can be checked against evidence.
- Load-bearing: fails — The paper’s conclusions may not depend on it.
- Based: passes — The paper gives a reason why it holds.
Probably not a substantial claim. The paper’s conclusions may not depend on it. It may state two separate claims as one.
A conclusion the paper draws from its own results — it cites no other source for it, so there is none to check. The quote shows it is in the paper.
In the paper
“Our work provides a concrete example of a simple yet effective machine learning pipeline that can be readily built from published screening data.”
§ Discovery of senolytics using machine learning > Discussion
plain- Asserted: passes — The authors put it forward as true.
- Checkable: passes — It can be checked against evidence.
- Load-bearing: passes — The paper’s conclusions depend on it.
- Based: passes — The paper gives a reason why it holds.
Probably not a substantial claim.
What the paper did — it cites no source for this, so there is none to check. The quote shows it is in the paper.
In the paper
“Most imaging data were acquired and analysed automatically by a high content microscopy platform and the imaging analysis software MetaXpress, and thus, data collection and analysis were blinded.”
§ Discovery of senolytics using machine learning > Methods > C Validation assays
plaindirect- Asserted: passes — The authors put it forward as true.
- Checkable: passes — It can be checked against evidence.
- Load-bearing: fails — The paper’s conclusions may not depend on it.
- Based: passes — The paper gives a reason why it holds.
Probably not a substantial claim. The paper’s conclusions may not depend on it. It may state two separate claims as one.
What the paper did — it cites no source for this, so there is none to check. The quote shows it is in the paper.
In the paper
“Every screened condition was carried out in triplicate.”
§ Discovery of senolytics using machine learning > Methods > C Validation assays
plain- Asserted: passes — The authors put it forward as true.
- Checkable: passes — It can be checked against evidence.
- Load-bearing: fails — The paper’s conclusions may not depend on it.
- Based: passes — The paper gives a reason why it holds.
Probably not a substantial claim. The paper’s conclusions may not depend on it.
A conclusion the paper draws from its own results — it cites no other source for it, so there is none to check. The quote shows it is in the paper.
In the paper
“oleandrin features a monosaccharide and a simple central steroid system, which makes it closer to a potentially non-cardiotoxic pharmacophore and, consequently, an attractive starting point for future senolytic medicinal chemistry campaigns.”
§ Discovery of senolytics using machine learning > Discussion
hedgedconditional- Asserted: passes — The authors put it forward as true.
- Checkable: passes — It can be checked against evidence.
- Load-bearing: passes — The paper’s conclusions depend on it.
- Based: passes — The paper gives a reason why it holds.
Probably not a substantial claim. It may state two separate claims as one.
The authors state this as an assumption.
The background compounds from LOPAC-1280 and Prestwick FDA-approved-1280 lack senolytic action.
“The full list of positives was then merged with a large background of compounds assumed to lack senolytic action.”
“This assumption was needed due to the lack of data on negative screening results in the literature.”
The paper relies on this without support.
Machine learning models can bias their predictions towards the training data they have been exposed to.
“Since machine learning models can bias their predictions towards the training data they have been exposed to, we chose the negatives from two diverse chemical libraries, LOPAC-1280 and Prestwick FDA-approved-1280, which contain a wide range of FDA-approved or clinical-stage compounds.”
The paper relies on this without support.
Current approaches to drug discovery suffer from high attrition rates in late-stage preclinical and clinical development.
“Current approaches to drug discovery suffer from notoriously high attrition rates in late-stage preclinical and clinical development.”
The paper relies on this without support.
The LOPAC-1280 and Prestwick FDA-approved-1280 libraries are sufficiently diverse for training machine learning models.
“We reasoned that these libraries are sufficiently diverse for training machine learning models.”
The authors state this as an assumption.
All compounds from the LOPAC-1280 and Prestwick FDA-approved-1280 libraries lack senolytic action.
“Although all compounds from these two library sources were assumed to be negative”
The paper relies on this without support.
Periplocin and oleandrin had not been previously identified as senolytics.
“periplocin and oleandrin, two cardiac glycosides which have not been previously identified as senolytics”
The paper relies on this without support.
Senolysis is a rare molecular property and the number of senolytics reported in the literature so far is limited.
“the small number of senolytics in the training data is a consequence of senolysis being a rare molecular property and the limited number of senolytics reported in the literature so far.”
The authors state this as an assumption.
The underlying assumptions for the statistical tests, including sample independence, variance equality, and normality, were assumed to be met although not explicitly examined.
“Underlying assumptions for these tests, including sample independence, variance equality, and normality were assumed to be met although not explicitly examined.”
Claims other papers make about this one
Each is checked against this paper’s own text: does it say what the citing paper says it does?
The source backs part of the claim, not all of it — or backs it for a different population, condition or comparison.
In the citing paper
“Machine learning pipelines, trained on extensive chemical compound datasets, have already identified novel small-molecule senolytics, such as Ginkgetin, Periplocin, and Oleandrin, and predicted synergistic drug combinations, substantially reducing the time and cost of discovery127,128.”
From Emerging strategies in senotherapeutics: from broad-spectrum senolysis to precision reprogramming (2026) · cites this paper as [128]
Experimental — accuracy not yet measuredThe cited source says what the claim attributes to it.
In the citing paper
“Machine learning pipelines, trained on extensive chemical compound datasets, have already identified novel small-molecule senolytics, such as Ginkgetin, Periplocin, and Oleandrin, and predicted synergistic drug combinations, substantially reducing the time and cost of discovery127,128.”
From Emerging strategies in senotherapeutics: from broad-spectrum senolysis to precision reprogramming (2026) · cites this paper as [128]
Self-check
Percentages, sums and reported differences re-computed from the paper’s own numbers.
Each contradiction between two passages listed here was confirmed by an independent check.
Rated minor: it would not touch a result — a value no result rests on, a p-value that stays on the same side of the significance level, or a conflict that is clerical, resolved elsewhere in the paper, or outside its own findings.
In the paper
§ Discovery of senolytics using machine learning > Results > AI-identified compound oleandrin displays improved senolytic performance over benchmark senolytic cardiac glycosides
“treated during 35 h with 10 nM oleandrin, ouabain and periplocin”
§ Discovery of senolytics using machine learning > Methods > C Validation assays
“Caspase 3/7 probe (C10423 Invitrogen) and senolytic drugs, oleandrin, ouabain and periplocin at 10 nM, were added to the media and cultured for 36 h.”
Rated minor: it would not touch a result — a value no result rests on, a p-value that stays on the same side of the significance level, or a conflict that is clerical, resolved elsewhere in the paper, or outside its own findings.
In the paper
“a small group of 21 compounds (0.4% of the full library)”
§ Discovery of senolytics using machine learning > Results > Predicting senolytic compounds by computational screen with machine learning
Reported 0.4 · recomputed 0.483871
Rated minor: it would not touch a result — a value no result rests on, a p-value that stays on the same side of the significance level, or a conflict that is clerical, resolved elsewhere in the paper, or outside its own findings.
In the paper
§ Discovery of senolytics using machine learning > Results > Identification of senolytics by experimental screening of top predicted compounds
“Senescence was induced by addition of 4-OHT at 100 nM during the duration of the experiment (8 days).”
§ Discovery of senolytics using machine learning > Methods > C Validation assays
“The 4-OHT treatment had a duration of six days.”
Rated minor: it would not touch a result — a value no result rests on, a p-value that stays on the same side of the significance level, or a conflict that is clerical, resolved elsewhere in the paper, or outside its own findings.
In the paper
§ Discovery of senolytics using machine learning > Methods > A Data assembly, featurisation and quality control
“This graph was then sparsified with the k-nearest neighbours graph (k = 7) intersected with the minimum spanning tree of the original graph.”
§ Discovery of senolytics using machine learning > Results > Data assembly and quality control
“Inset shows the distribution of Tanimoto distances across the 269 graph edges (median distance of 0.77).”
Citations
Cites
SMOTE synthetic minority over-sampling technique
Chawla, N. V., Bowyer, K. W., Hall, L. O., & Kegelmeyer, W. P. (2002) · Journal of Artificial Intelligence Research · doi:10.1613/jair.953 · Cited by 32,865
The Elements of Statistical Learning
Hastie, T., Friedman, J., & Tibshirani, R. (2001) · Springer Series in Statistics · doi:10.1007/978-0-387-21606-5 · Cited by 24,162
Kuhn, M., & Johnson, K. (2013) · doi:10.1007/978-1-4614-6849-3 · Cited by 6,788
Newman, M. (2010) · doi:10.1093/acprof:oso/9780199206650.001.0001 · Cited by 6,595
The senescence-associated secretory phenotype: the dark side of tumor suppression
Coppé, J.-P., Desprez, P.-Y., Krtolica, A., & Campisi, J. (2010) · Annual Review of Pathology: Mechanisms of Disease · doi:10.1146/annurev-pathol-121808-102144 · Cited by 5,206
Applications of machine learning in drug discovery and development
Vamathevan, J., Clark, D., Czodrowski, P., Dunham, I., Ferran, E., Lee, G., Li, B., Madabhushi, A., Shah, P., Spitzer, M., et al. (2019) · Nature Reviews Drug Discovery · doi:10.1038/s41573-019-0024-5 · Cited by 3,228
Cellular Senescence: Defining a Path Forward
Gorgoulis, V., Adams, P. D., Alimonti, A., Bennett, D. C., Bischof, O., Bishop, C., Campisi, J., Collado, M., Evangelou, K., Ferbeyre, G., et al. (2019) · Cell · doi:10.1016/j.cell.2019.10.005 · Cited by 3,225
MoleculeNet: a benchmark for molecular machine learning
Wu, Z., Ramsundar, B., Feinberg, E. N., Gomes, J., Geniesse, C., Pappu, A. S., Leswing, K., & Pande, V. (2018) · Chemical Science · doi:10.1039/c7sc02664a · Cited by 3,107
The Achilles' heel of senescent cells: from transcriptome to senolytic drugs
Zhu, Y., Tchkonia, T., Pirtskhalava, T., Gower, A. C., Ding, H., Giorgadze, N., Palmer, A. K., Ikeno, Y., Hubbard, G. B., Lenburg, M., et al. (2015) · Aging Cell · doi:10.1111/acel.12344 · Cited by 2,584
Molecular Docking: Shifting Paradigms in Drug Discovery
Pinzi, L., & Rastelli, G. (2019) · International Journal of Molecular Sciences · doi:10.3390/ijms20184331 · Cited by 2,537
Research works printed but not linked: 2
- van der Maaten, L. & Hinton, G. Visualizing data using t-SNE. J. Mach. Learn Res. 9, 2579–2605 (2008).
- Louppe, G., Wehenkel, L., Sutera, A. & Geurts, P. Understanding variable importances in forests of randomized trees. Adv. Neural Inf. Process. Syst. 26 Available at: https://proceedings.neurips.cc/paper/2013/hash/e3796ae838835da0b6f6ea37bcf8bcb7-Abstract.html (2013).
Cited by
Sorted by citations
Artificial intelligence in drug development
Zhang, K., Yang, X., Wang, Y., Yu, Y., Huang, N., Li, G. L., Li, X., Wu, J. C., & Yang, S. (2025) · Nature Medicine · doi:10.1038/s41591-024-03434-4 · Cited by 585
Senescence as a therapeutic target in cancer and age-related diseases
McHugh, D., Durán, I., & Gil, J. (2025) · Nature Reviews Drug Discovery · doi:10.1038/s41573-024-01074-4 · Cited by 197
AI-Driven Drug Discovery: A Comprehensive Review
Ferreira, F. J. N., & Carneiro, A. S. (2025) · ACS Omega · doi:10.1021/acsomega.5c00549 · Cited by 202
Lelarge, V., Capelle, R., Oger, F., Mathieu, T., & Le Calvé, B. (2024) · npj Aging · doi:10.1038/s41514-024-00138-4 · Cited by 140
Colucci, M., Sarill, M., Maddalena, M., Valdata, A., Troiani, M., Massarotti, M., Bolis, M., Bressan, S., Kohl, A., Robesti, D., et al. (2025) · Cancer Cell · doi:10.1016/j.ccell.2025.05.015 · Cited by 143
Emerging insights in senescence: pathways from preclinical models to therapeutic innovations
Mansfield, L., Ramponi, V., Gupta, K., Stevenson, T., Mathew, A. B., Barinda, A. J., Herbstein, F., & Morsli, S. (2024) · npj Aging · doi:10.1038/s41514-024-00181-1 · Cited by 88
Jang, D., Shin, J., Shim, E., Ohtani, N., & Jeon, O. H. (2024) · Aging Cell · doi:10.1111/acel.14315 · Cited by 84
Current senolytics: Mode of action, efficacy and limitations, and their future
Rad, A. N., & Grillari, J. (2023) · Mechanisms of Ageing and Development · doi:10.1016/j.mad.2023.111888 · Cited by 87
Therapeutic targeting of senescent cells in the CNS
Riessland, M., Ximerakis, M., Jarjour, A. A., Zhang, B., & Orr, M. E. (2024) · Nature Reviews Drug Discovery · doi:10.1038/s41573-024-01033-z · Cited by 77
Senescence as a molecular target in skin aging and disease
Thau, H., Gerjol, B. P., Hahn, K., Gudenberg, R. W. V., Knoedler, L., Stallcup, K., Emmert, M. Y., Buhl, T., Wyles, S. P., Tchkonia, T., et al. (2025) · Ageing Research Reviews · doi:10.1016/j.arr.2025.102686 · Cited by 65
Ginkgetin Alleviates Inflammation and Senescence by Targeting STING
Liu, Y., Ye, J., Fan, Z., Wu, X., Zhang, Y., Yang, R., Jiang, B., Wang, Y., Wu, M., Zhou, J., et al. (2024) · Advanced Science · doi:10.1002/advs.202407222 · Cited by 58
Luo, J., Sun, T., Liu, Z., Liu, Y., Liu, J., Wang, S., Shi, X., & Zhou, H. (2025) · International Journal of Oral Science · doi:10.1038/s41368-025-00380-w · Cited by 61
Lyu, Y.-X., Fu, Q., Wilczok, D., Ying, K., King, A., Antebi, A., Vojta, A., Stolzing, A., Moskalev, A., Georgievskaya, A., et al. (2024) · Aging · doi:10.18632/aging.206135 · Cited by 48
Ye, H., Jiang, S. J., Yan, Y., Zhao, B., Grant, E. R., Kitts, D. D., Yada, R. Y., Singh, A. P., Baldelli, A., & Yang, T. (2024) · ACS Nano · doi:10.1021/acsnano.4c08316 · Cited by 43
Hasibi, R., Michoel, T., & Oyarzún, D. A. (2024) · npj Systems Biology and Applications · doi:10.1038/s41540-024-00348-2 · Cited by 42
Self-citationApplications of artificial intelligence and machine learning in dynamic pathway engineering
Merzbacher, C., & Oyarzún, D. A. (2023) · Biochemical Society Transactions · doi:10.1042/bst20221542 · Cited by 41
Self-citationCardiac Glycosides: From Natural Defense Molecules to Emerging Therapeutic Agents
Ponce, A., Flores-Maldonado, C., & Contreras, R. G. (2025) · Biomolecules · doi:10.3390/biom15060885 · Cited by 35
The leading global health challenges in the artificial intelligence era
Zaidan, A. M. (2023) · Frontiers in Public Health · doi:10.3389/fpubh.2023.1328918 · Cited by 31
Anti-senescence therapies: a new concept to address cardiovascular disease
Stojanović, S. D., Thum, T., & Bauersachs, J. K. (2025) · Cardiovascular Research · doi:10.1093/cvr/cvaf030 · Cited by 32
Revolutionizing Diabetic Foot Ulcer Care: The Senotherapeutic Approach
Zhang, G., Samarawickrama, P. N., Gui, L., Ma, Y., Cao, M., Zhu, H., Li, W., Yang, H., Li, K., Yang, Y., et al. (2024) · Aging and Disease · doi:10.14336/ad.2024.0065 · Cited by 28
A Critical Appraisal of the Utility of Targeting Therapy-Induced Senescence for Cancer Treatment
Saleh, T., Greenberg, E. F., Faber, A. C., Harada, H., & Gewirtz, D. A. (2025) · Cancer Research · doi:10.1158/0008-5472.can-24-2219 · Cited by 28
Targeting Dermal Fibroblast Senescence: From Cellular Plasticity to Anti-Aging Therapies
Jipu, R., Șerban, I. L., Goriuc, A., Jipu, A. G., Luchian, I. A., Amititeloaie, C., Tărniceriu, C. C., Hurjui, I., Butnaru, O., & Hurjui, L. L. (2025) · Biomedicines · doi:10.3390/biomedicines13081927 · Cited by 25
Li, X., Sun, Y., Zhou, Z., Li, J., Liu, S., Chen, L., Shi, Y., Wang, M., Zhu, Z., Wang, G., et al. (2024) · Advanced Science · doi:10.1002/advs.202308970 · Cited by 23
Tian, R.-C., Zhang, R., & Ma, C. (2025) · Biomolecules · doi:10.3390/biom15020276 · Cited by 23
Learning Binding Affinities via Fine-Tuning of Protein and Ligand Language Models
Gorantla, R., Gema, A. P., Yang, I. X., Serrano‐Morrás, Á., Suutari, B. S., Juárez‐Jiménez, J., & Mey, A. S. J. S. (2025) · Journal of Chemical Information and Modeling · doi:10.1021/acs.jcim.5c02063 · Cited by 22
Therapy-induced senescence is finally escapable, what is next?
Saleh, T. (2024) · Cell Cycle · doi:10.1080/15384101.2024.2364579 · Cited by 21
Chen, W., Mao, X., Wang, X., Liao, Y.-C., Yin, X.-Y., Wu, H., Chen, T.-Y., Liu, M.-Q., Wang, T., & Yu, R. (2025) · Chemical Science · doi:10.1039/d5sc03648h · Cited by 21
Galkin, F., Naumov, V., Pushkov, S., Sidorenko, D., Urban, A. S., Zagirova, D., Alawi, K. M., Aliper, A., Gumerov, R., Kalashnikov, A., et al. (2024) · bioRxiv (Cold Spring Harbor Laboratory) · doi:10.1101/2024.07.25.605062 · Cited by 21
Drug innovation via integration of traditional Chinese and Western medicine
Li, Z., Yang, L., Kong, L., Sun, H. J., Sun, Y., Chen, X., Yin, F., Yan, G., & Wang, X. (2025) · Science of Traditional Chinese Medicine · doi:10.1097/st9.0000000000000070 · Cited by 22
Huang, Z., Xu, P., Hess, D. C., & Zhang, Q. (2024) · Translational Neurodegeneration · doi:10.1186/s40035-024-00457-2 · Cited by 20
Wu, H., Zhang, Q., Zhu, J., Wu, L., Xiao, Y., & Yang, X. (2025) · Bioactive Materials · doi:10.1016/j.bioactmat.2025.09.002 · Cited by 18
Neri, F., Takajjart, S. N., Lerner, C. A., Desprez, P.-Y., Schilling, B., Campisi, J., & Gerencser, A. A. (2024) · GeroScience · doi:10.1007/s11357-024-01167-3 · Cited by 17
The immunosenescence clock: A new method for evaluating biological age and predicting mortality risk
Li, S., Wang, K., Wu, J., & Zhu, Y. (2024) · Ageing Research Reviews · doi:10.1016/j.arr.2024.102653 · Cited by 18
Immunosenescence and the Geriatric Giants: Molecular Insights into Aging and Healthspan
Fetarayani, D., Kahdina, M., Waitupu, A., Pratiwi, L., Ningtyas, M. C., Adytia, G. J., & Sutanto, H. (2025) · Medical Sciences · doi:10.3390/medsci13030100 · Cited by 17
Chen, S., Shen, C., Li, W., Fan, Y., Yang, D., Wang, Y., Feng, R., Li, G., & Zhong, Z. (2024) · TrAC Trends in Analytical Chemistry · doi:10.1016/j.trac.2024.118042 · Cited by 13
Circadian rhythm, hypoxia, and cellular senescence: From molecular mechanisms to targeted strategies
Nie, T., Nepovimová, E., & Wu, Q. (2025) · European Journal of Pharmacology · doi:10.1016/j.ejphar.2025.177290 · Cited by 13
Gan, X., Li, J., Jiang, Y., Wang, X., Zeng, Y., Chen, X., Huang, H., Min, J., Li, G., Nie, M., et al. (2025) · Phytomedicine · doi:10.1016/j.phymed.2025.156697 · Cited by 13
Ha, D. P., Shin, W.-J., Liu, Z., Doche, M. E., Lau, R., Leli, N. M., Conn, C. S., Russo, M., Lorenzato, A., Koumenis, C., et al. (2024) · Cell & Bioscience · doi:10.1186/s13578-024-01297-3 · Cited by 12
Shi, H., Xiao, M., Li, Y., Liu, X., Na, J., Liang, C., Hua, J., Meng, Q., Wei, M., Wang, W., et al. (2025) · Theranostics · doi:10.7150/thno.112633 · Cited by 12
Ginkgetin from Ginkgo biloba: mechanistic insights into anticancer efficacy
Xiong, B., Lu, J., Guo, H., Huang, M., & Li, T. (2025) · Natural Products and Bioprospecting · doi:10.1007/s13659-025-00535-6 · Cited by 12
Current aspects of targeting cellular senescence for the therapy of neurodegenerative diseases
Jaganathan, R., Iyaswamy, A., Krishnamoorthi, S., Thakur, A., Durairajan, S. S. K., Yang, C., & Wankhar, D. (2025) · Frontiers in Aging Neuroscience · doi:10.3389/fnagi.2025.1627921 · Cited by 12
Hydrogen Peroxide-Releasing Hydrogel-Mediated Cellular Senescence Model for Aging Research
Wei, S., Thi, P. L., Zhang, Y., Park, M.-Y., Do, K.-H., Thi, T. T. H., Morgan, N., Dao, T., Heo, J., Jo, Y., et al. (2025) · Biomaterials Research · doi:10.34133/bmr.0161 · Cited by 11
Wu, J., Zhang, L., Zhao, Z., Liu, Y., Li, Z., Feng, X., Zhang, L., Yao, X., Du, J., Chen, L., et al. (2025) · Ageing Research Reviews · doi:10.1016/j.arr.2025.102783 · Cited by 10
Dai, X.-H., Zhu, J.-M., Wang, G., Ren, Y., Liu, H., & Wang, Y. (2025) · Nature Communications · doi:10.1038/s41467-025-62990-6 · Cited by 11
Prediction of heavy-section ductile iron fracture toughness based on machine learning
Song, L., Zhang, H., Zhang, J., & Guo, H. Y. (2024) · Scientific Reports · doi:10.1038/s41598-024-55089-3 · Cited by 10
Improving the generalization of protein expression models with mechanistic sequence information
Shen, Y., Kudla, G., & Oyarzún, D. A. (2025) · Nucleic Acids Research · doi:10.1093/nar/gkaf020 · Cited by 10
Self-citationNetwork Pharmacology and Machine Learning Identify Flavonoids as Potential Senotherapeutics
Santiago-de-la-Cruz, J. A., Rivero-Segura, N. A., Álvarez-Sánchez, M. E., & Gómez-Verján, J. C. (2025) · Pharmaceuticals · doi:10.3390/ph18081176 · Cited by 10
Insights into the therapeutic strategies for aging and aging-associated diseases
Dong, R., Wu, Q., Kan, J., Fu, C., Sorrentino, V., Chow, A., Lei, Y., Wu, D., Xu, Z., Du, J., et al. (2026) · Signal Transduction and Targeted Therapy · doi:10.1038/s41392-026-02662-z · Cited by 12
Hu, T., Li, K., Ma, C., Zhou, N., Chen, Q., & Qi, C. (2024) · Chemosphere · doi:10.1016/j.chemosphere.2024.142697 · Cited by 10
Immune therapeutic strategies for the senescent tumor microenvironment
Yasuda, T., & Wang, Y. (2024) · British Journal of Cancer · doi:10.1038/s41416-024-02865-7 · Cited by 10
Hernández-Hernández, S., Guo, Q., & Ballester, P. J. (2025) · Pattern Recognition · doi:10.1016/j.patcog.2025.112501 · Cited by 8
Microvascular Health as a Key Determinant of Organismal Aging
Cenciarini, M., Uccelli, A., Mangili, F., Grunewald, M., & Bersini, S. (2025) · Advanced Science · doi:10.1002/advs.202508659 · Cited by 8
In vitro senescence and senolytic functional assays
Ryan, P., & Lee, J. (2025) · Biomaterials Science · doi:10.1039/d4bm01684j · Cited by 7
Selective (α)- l -Rhamnosylation and Neuroprotective Activity Exploration of Cardiotonic Steroids
Rutkoski, R., Debarba, L. K., Stilgenbauer, L., Rosenthal, T., Sadagurski, M., & Nagorny, P. (2024) · ACS Medicinal Chemistry Letters · doi:10.1021/acsmedchemlett.3c00517 · Cited by 7
The promise of machine learning approaches to capture cellular senescence heterogeneity
Durán, I., Bishop, C. L., Gil, J., & Wallis, R. (2024) · Nature Aging · doi:10.1038/s43587-024-00703-2 · Cited by 7
Emerging strategies in senotherapeutics: from broad-spectrum senolysis to precision reprogramming
Zhang, W., Song, S., Zhang, Y., Pan, Y., Hu, D., & Wang, Y. (2026) · npj Aging · doi:10.1038/s41514-026-00355-z · Cited by 6
Advancements in the Application of the Intersection of Medicine and Engineering in Cancer Research
Chen, H., Zhang, G.-M., Qian, Y., Yang, P., Li, X., Wang, J., Wang, J., Hu, Y.-X., Xiao, H., Zhong, Q., et al. (2025) · Cancer Nexus · doi:10.1002/cnx2.70003 · Cited by 6
Senolytic Interventions for Type 2 Diabetes: Current Evidence and Future Directions
Sodini, S., & Suárez‐Ortegón, M. F. (2025) · Diabetology · doi:10.3390/diabetology6060048 · Cited by 6
Aging and tumors: a dynamic interaction
Zhang, Y., Zhu, S., Liu, Z., Hu, Y., Zhang, Y., Shang, L., & Li, L. (2025) · Discover Oncology · doi:10.1007/s12672-025-01808-9 · Cited by 5
Inhibition of miMOMP-induced SASP to combat age-related disease
Liao, X., Guo, Z., He, M., & Zhang, Y. (2025) · Frontiers in Aging · doi:10.3389/fragi.2025.1505063 · Cited by 5
Toker, D., Chiang, J. N., Vespa, P. M., Schnakers, C., & Monti, M. M. (2025) · Neurocritical Care · doi:10.1007/s12028-025-02217-0 · Cited by 6
Next-gen senotherapeutics: AI/ML-driven strategies for aging and age-related disorders
Javali, P. S., Kumar, A., Sarkar, S., Varshini, R. S., Mathew, D. J., & Thirumurugan, K. (2025) · Advances in pharmacology · doi:10.1016/bs.apha.2025.01.017 · Cited by 4
Li, J., Zhao, K., Yang, G., Lv, H., Zhang, R., Li, S., Chen, Z., Xu, M., Yang, N., & Dai, S. (2025) · Molecules · doi:10.3390/molecules30122653 · Cited by 4
Empowering scientific discovery with explainable small domain-specific and large language models
Yu, H., Wang, Y., Cheng, T., Yan, Y., Dawson, K. A., Li, S. F. Y., Zheng, Y., & Jin, Y. (2025) · Artificial Intelligence Review · doi:10.1007/s10462-025-11365-w · Cited by 4
CAR‐T Cells: Current Status, Challenges, and Future Prospects
Adly, A. S., Cartron, G., Adly, A. S., Egea, J., Dutilleul, P. C., Adly, M. S., & Villalba, M. (2026) · MedComm · doi:10.1002/mco2.70606 · Cited by 4
Research Progress of Senolytic Drugs in the Treatment of Orthopedic Diseases
Zhang, M., Lou, P., Shou, D., Tong, P., & Zhang, Y. (2025) · Gerontology · doi:10.1159/000543386 · Cited by 4
Natural Product-Derived Senotherapeutics: Extraction and Biological Evaluation Techniques
Pratsinis, H., Mavrogonatou, E., Zervou, S., Triantis, T. M., Hiskia, A. E., & Kletsas, D. (2025) · Methods in molecular biology · doi:10.1007/978-1-0716-4426-3_19 · Cited by 4
Hughes, B. K., Davis, A. E. M., Milligan, D., Wallis, R., Philpott, M. P., Wainwright, L., Gunn, D. A., & Bishop, C. L. (2023) · bioRxiv (Cold Spring Harbor Laboratory) · doi:10.1101/2023.10.23.563515 · Cited by 4
Navigating New Realities in Aging Care as Artificial Intelligence Enters Clinical Practice
Vahia, I. V. (2024) · American Journal of Geriatric Psychiatry · doi:10.1016/j.jagp.2024.01.011 · Cited by 4
Shi, P., Huang, X., Ke, Q., Kou, X., & Zhang, D. (2026) · Digital Discovery · doi:10.1039/d5dd00173k · Cited by 3
High-throughput screening for ageing and age-related disease drug discovery: Advances and challenges
Ji, X., Pan, Y., Lei, J., Liang, L., Wang, C., Zeng, X., Yu, D., Chen, F., Lu, J., Zhu, J.-K., et al. (2026) · Ageing Research Reviews · doi:10.1016/j.arr.2026.103124 · Cited by 3
Fizikova, A., Prokhorova, A., Churikova, D., Konstantinov, Z. S., Ivanov, R. A., Karabelsky, A. V., & Александрович, Р. С. (2025) · International Journal of Molecular Sciences · doi:10.3390/ijms26146794 · Cited by 3
Preliminary investigation of the safe dose of oleandrin when administered orally to Beagles
Fossum, T. W., Newman, R. A., & Matos, J. R. (2024) · Journal of the American Veterinary Medical Association · doi:10.2460/javma.23.11.0651 · Cited by 3
Perry, N., Eid, S., Schmitt‐Ulms, G., & Nagorny, P. (2025) · Chemistry - A European Journal · doi:10.1002/chem.202501552 · Cited by 3
In-silico evaluation of aging-related interventions using omics data and predictive modeling
Fuellen, G., Palmer, D. H., Fruijtier-Pölloth, C., & Avelar, R. A. (2025) · Ageing Research Reviews · doi:10.1016/j.arr.2025.102777 · Cited by 2
Predicting p53 Status in IDH ‐Mutant Gliomas Using MRI ‐Based Radiomic Model
Li, J., Lan, Z., Zhang, X., Liang, X., Chen, H., & Yu, X. (2025) · Cancer Medicine · doi:10.1002/cam4.71063 · Cited by 2
Liang, X., Cui, Y., Tan, Y., Zhou, Y., Cao, X., Wu, Z., Feng, C., Wen, X., Xing, X., & Yang, H. Q. (2025) · Analytical Chemistry · doi:10.1021/acs.analchem.5c04126 · Cited by 2
Chen, T., Chen, X., Chen, X., Zhang, W., Li, B., Chu, C., Lv, G., & Chen, S. (2026) · Journal of Ethnopharmacology · doi:10.1016/j.jep.2026.121233 · Cited by 2
Παπανικολάου, Κ., Yadav, A., Mankowski, R. T., Alexander, M. S., Gamboa, J. L., Thalacker‐Mercer, A. E., Dungan, C. M., & Englund, D. A. (2026) · American Journal of Physiology-Cell Physiology · doi:10.1152/ajpcell.00876.2025 · Cited by 2
Olinger, B., & Basisty, N. (2026) · Ageing Research Reviews · doi:10.1016/j.arr.2026.103254 · Cited by 2
Santiago-de-la-Cruz, J. A., Rivero-Segura, N. A., & Gómez-Verján, J. C. (2025) · Journal of Cheminformatics · doi:10.1186/s13321-025-01058-5 · Cited by 2
Stolbov, L. A., Rudik, A. V., Lagunin, A. A., Druzhilovskiy, D. S., Filimonov, D. A., & Poroikov, V. (2025) · International Journal of Molecular Sciences · doi:10.3390/ijms26188858 · Cited by 2
Bishop, C. L., Hughes, B. K., Davis, A. E. M., Milligan, D., Wallis, R., Philpott, M. P., Wainwright, L., & Gunn, D. A. (2023) · Research Square · doi:10.21203/rs.3.rs-3572777/v1 · Cited by 2
Nwankwo, N., & Okafor, I. (2023) · Aging Medicine · doi:10.1002/agm2.12274 · Cited by 1
Kumarachari, R. K., Bukke, S. P. N., Kammara, L., Chandrakala, A. N., Himasaila, M., & Kamati, M. (2025) · IGI Global eBooks · doi:10.4018/979-8-3693-9730-5.ch004 · Cited by 1
From Lasers to Longevity: Exploring Energy-Based Devices as Senotherapeutic Tools in Dermatology
Hrițcu, O. M. C., Costan, V. V., Toader, Ș. V., Branisteanu, D. E., & Toader, M. P. (2025) · Cosmetics · doi:10.3390/cosmetics12050201 · Cited by 1
Liu, X., Lu, Y., Chen, Q., Yang, M., Li, S., Sun, H., Liu, X., Yan, J., Liangning, L., Xiang, N., et al. (2025) · Acta Pharmaceutica Sinica B · doi:10.1016/j.apsb.2025.10.005 · Cited by 1
Feature-enhanced graph neural network with multiple attention for molecular property prediction
Qin, B., Zhu, X., Fan, C.-Y., Xue, X., Wang, M., & Tang, H. (2025) · Neurocomputing · doi:10.1016/j.neucom.2025.132426 · Cited by 1
Translational Geroscience Strategies for Delaying Multimorbidity
Khanal, P., Chand, J., Patil, V. S., Singh, L., & Bhattacharya, K. (2026) · ACS Pharmacology & Translational Science · doi:10.1021/acsptsci.6c00026 · Cited by 1
Huang, W., Chen, J., Ali, N., Tian, J. H., & Zhang, W. (2026) · Nature Communications · doi:10.1038/s41467-026-71549-y · Cited by 1
Truby, J., & Kantiana, I. D. (2026) · The Journal of Law Medicine & Ethics · doi:10.1017/jme.2026.10262 · Cited by 1
Large‐Scale Machine Learning to Screen for Small‐Molecule Senolytics
Dougha, A., Gil, J., & Ballester, P. J. (2026) · Advanced Intelligent Discovery · doi:10.1002/aidi.202600013 · Cited by 1
Wang, Q., Wang, F., Wang, J., Zhuo, Y., Tang, J., Wei, X., Guan, X., & Xu, Y. (2026) · Interdisciplinary Sciences Computational Life Sciences · doi:10.1007/s12539-026-00838-3 · Cited by 1
Xu, Z., Guo, J., Liu, Z., Yu, J., Yuan, R., Min, Y., Wei, Z., & Peng, X. (2026) · Ageing Research Reviews · doi:10.1016/j.arr.2026.103270 · Cited by 1
Editorial: Immunosenescence in organ transplantation
Iske, J., & Zhou, H. (2024) · Frontiers in Transplantation · doi:10.3389/frtra.2024.1422358 · Cited by 1
Biometric aging clock for practical utility in clinical settingsPreprint
Nayak, D., Galkin, F., & Ghosh, S. K. (2025) · bioRxiv (Cold Spring Harbor Laboratory) · doi:10.1101/2025.04.14.648594 · Cited by 1
Discovery of TDP-43 aggregation inhibitors via a hybrid machine learning frameworkPreprint
Kapsiani, S., Vora, S., Fernández‐Villegas, A., Kaminski, C. F., Läubli, N. F., & Schierle, G. S. K. (2026) · bioRxiv (Cold Spring Harbor Laboratory) · doi:10.64898/2026.02.12.705375 · Cited by 1
Ye, Y., Su, T., Gao, J., & Ming, D. (2025) · International Journal of Molecular Sciences · doi:10.3390/ijms26189004
Bennett, G. (2024) · SpringerBriefs in modern perspectives on disability research. · doi:10.1007/978-981-97-3637-9_1
Metadata
- Authors
- Smer-Barreto, V., Quintanilla, A., Elliott, R. J. R., Dawson, J. C., Sun, J., Campa, V. M., Lorente-Macías, Á., Unciti-Broceta, A., Carragher, N. O., Acosta, J. C., & Oyarzún, D. A.
- Affiliations
- Edinburgh Cancer Research (GB)
- Universidad de Cantabria (ES)
- University of Edinburgh (GB)
- The Alan Turing Institute (GB)
- Corresponding author
- Smer-Barreto, Vanessa
- Acosta, Juan Carlos
- Oyarzún, Diego A.
- ORCID
- Venue
- Nature Communications
- Published
- 2023-06-10
- Volume
- 14
- Issue
- 1
- Pages
- 3445-3445
- ISSN
- 2041-1723 (ISSN-L)
- PMC
- PMC10257182
- OpenAlex
- W4380152694
- Semantic Scholar
- d9a31a94f6f0a105f67c80f4b055dce4b6563858
- Cited by
- 139
- References
- 86
- Citations by year
- 2026: 42 · 2025: 57 · 2024: 33 · 2023: 7
- FWCI
- 12.31
- Type
- journal article
- Language
- en
- Open access
- gold
- doi.org
- Locations
- Nature Communications (publishedVersion, cc-by)
- bioRxiv (Cold Spring Harbor Laboratory) (acceptedVersion, cc-by-nc-nd)
- PubMed Central (publishedVersion, cc-by)
- PubMed (publishedVersion)
- DIGITAL.CSIC (Spanish National Research Council (CSIC)) (submittedVersion, cc-by)
- UCrea (University of Cantabria) (submittedVersion, cc-by)
- RePEc: Research Papers in Economics (submittedVersion)
- DIGITAL.CSIC (Spanish National Research Council (CSIC)) (submittedVersion, cc-by-nc-nd)
- DOAJ (DOAJ: Directory of Open Access Journals) (submittedVersion, cc-by-sa)
- Edinburgh Research Explorer (University of Edinburgh) (submittedVersion, cc-by)
- Funders
- Cancer Research UK (16243, C47559/A16243)
- University of Edinburgh (MC_UU_00009/2)
- Ministerio de Ciencia e Innovación (10.13039, 501100011033, PID2020, PID2020-117860GB-I00, MCIN /AEI /10.13039)
- Medical Research Council (MC_UU_00009/2)
- Consejo Superior de Investigaciones Científicas
- Agencia Estatal de Investigación (501100011033, 10.13039/501100011033, 13039, 10.13039)
- Topics
- Life Sciences › Pharmacology, Toxicology and Pharmaceutics › Drug Discovery › Computational Drug Discovery Methods
- Life Sciences › Biochemistry, Genetics and Molecular Biology › Cell Biology › Telomeres, Telomerase, and Senescence
- Physical Sciences › Materials Science › Materials Chemistry › Machine Learning in Materials Science
- Keywords
- senolytics, cellular senescence, machine learning, drug discovery, ginkgetin, oleandrin, periplocin, chemical library screening, senescence-associated secretory phenotype, lung fibroblasts, lung adenocarcinoma cells
- MeSH terms
- Machine Learning, Senotherapeutics, Aging, Artificial Intelligence, Humans, Cellular Senescence
About these checks
Registry, retraction, Cites and statistics results are computed, not judged, with one exception: a printed reference that no index lists is read once by a model before it counts as a citation error. Claims are extracted by a model and kept only when their quote appears verbatim in the text; each cited source is then checked, with a model’s help, for whether it says what the claim relies on. Those verdicts can be wrong — read the claim’s quote and the cited source before relying on one.
A language model drew the claims from the paper on 2026-11-10, under version 3 of the claim definition (model deepseek-v4.1-flash, prompt extract-v3).
A second model labelled each claim on 2026-11-10 (model jev-1.13-20260917, definition revision gold-guideline-v0.2).
Cited sources are checked with a language model’s help (gpt-6-sol).
Statistics and arithmetic are recomputed, not judged.
Confidence bands are shown only for fields calibrated on our annotated test set. None is calibrated yet, so no band is shown.
What counts as a claim ›How we measure confidence ›How we check this ›
Are you an author, or do you see a problem with this page? Request a review
