

The DOI matches its Crossref record; 59 of the 61 references it cites were found in a registry or an index.
Biologically informed deep neural network for prostate cancer discovery
Open accessPublished version of a preprint
Abstract
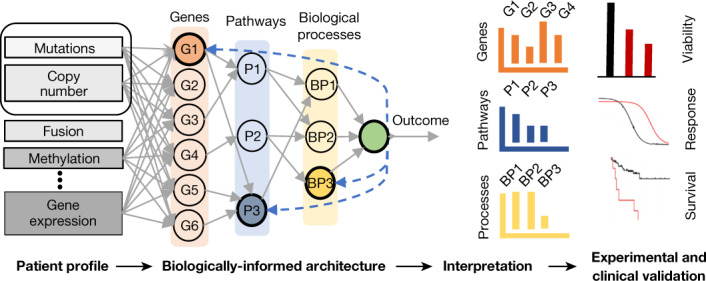
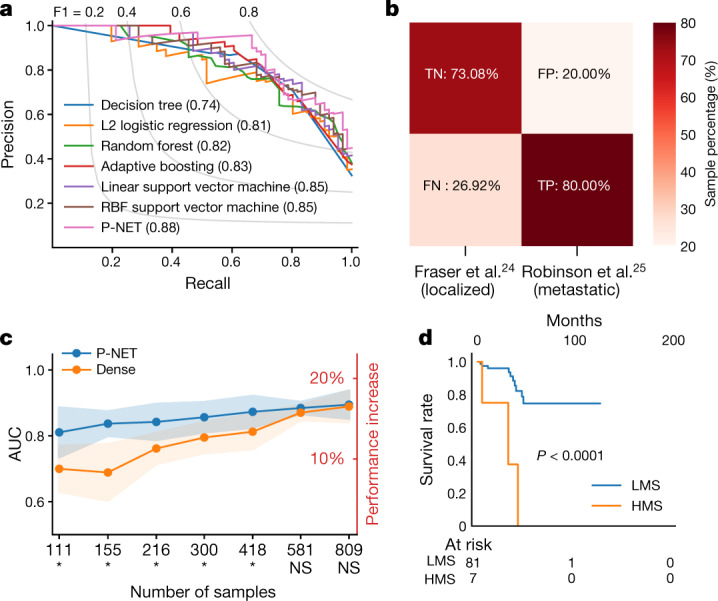
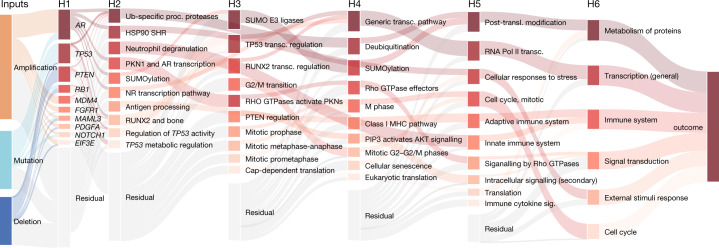
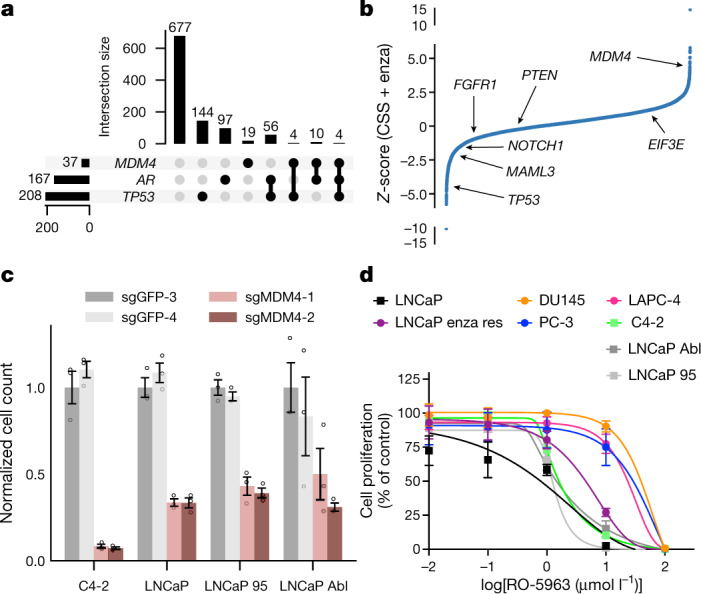
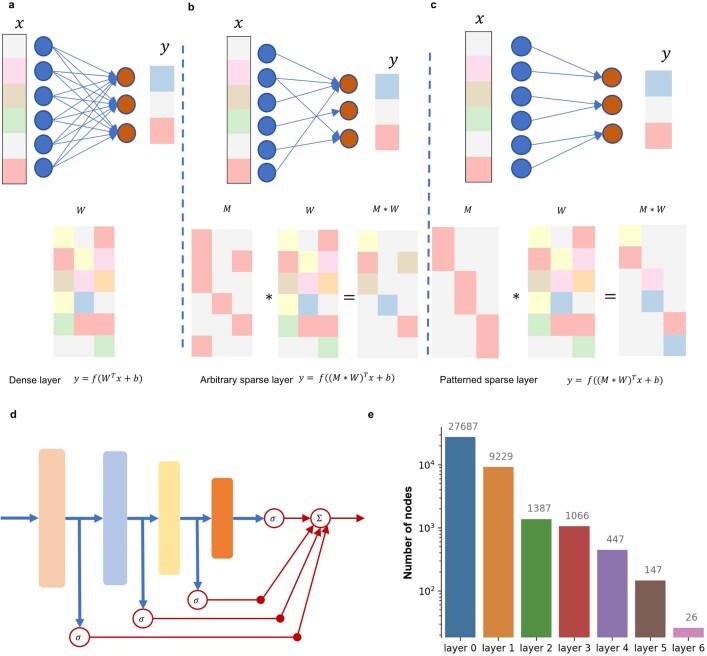
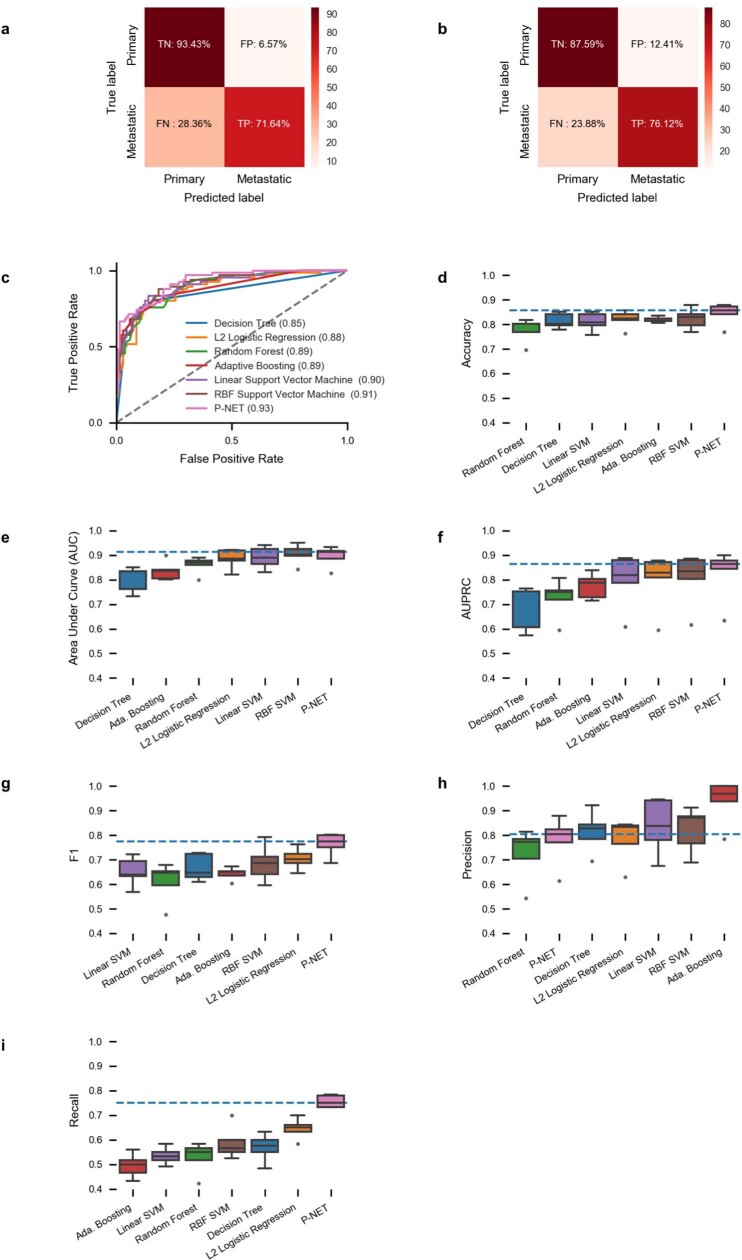
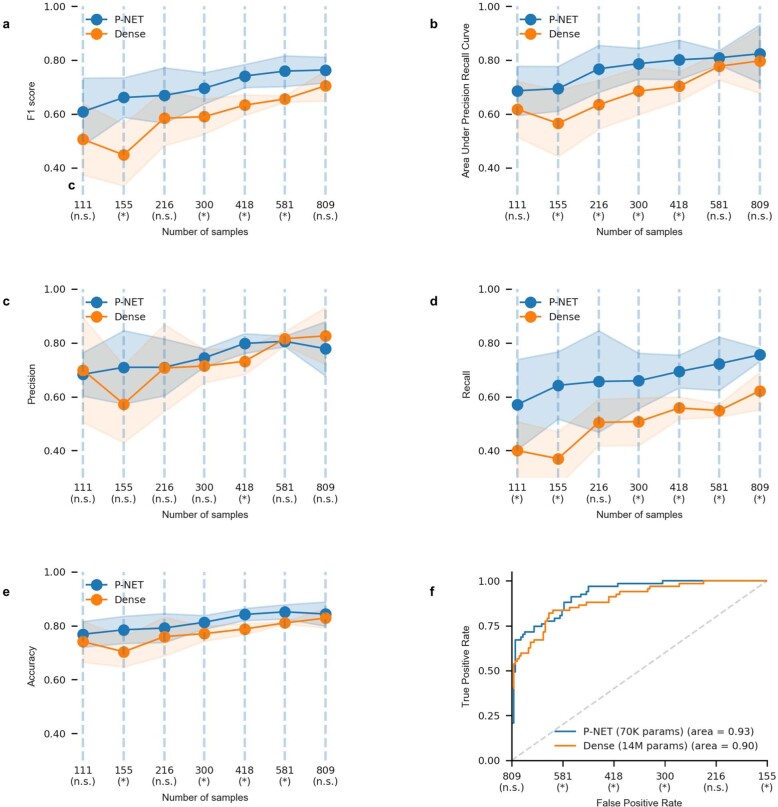
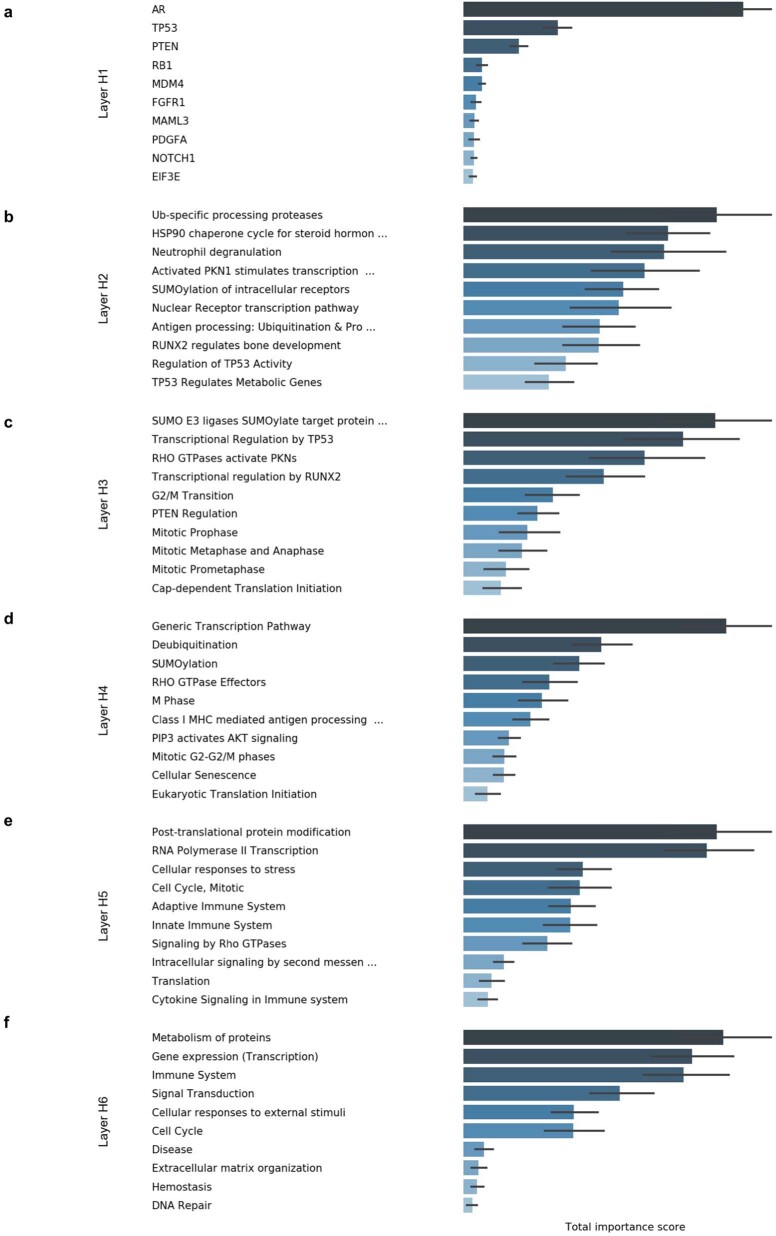
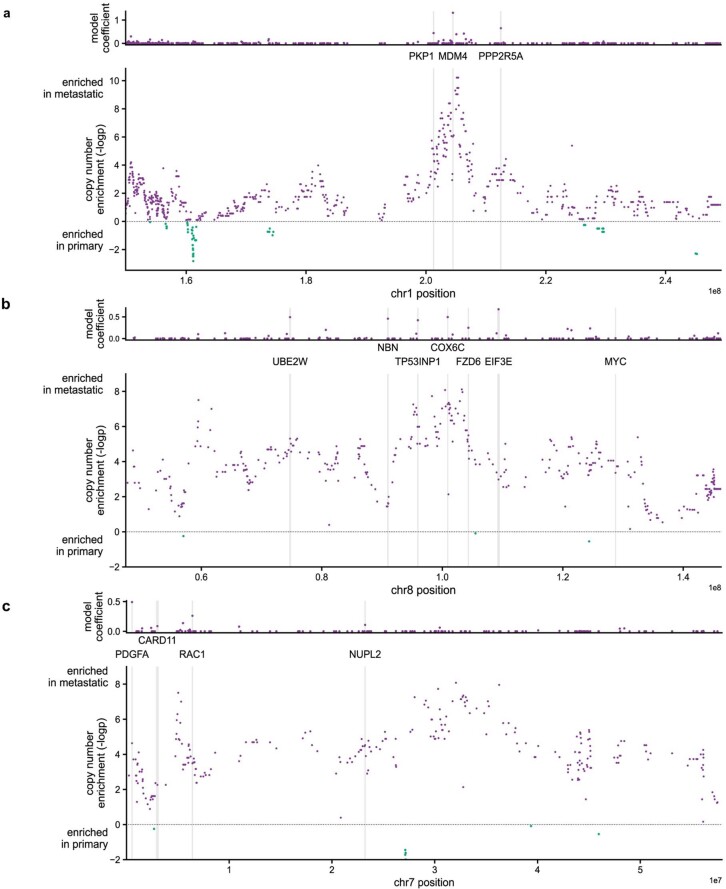
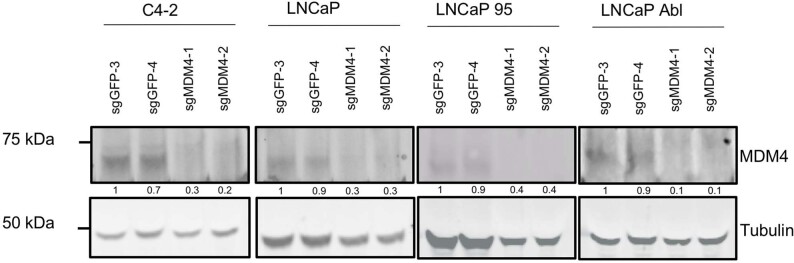
Abstract The determination of molecular features that mediate clinically aggressive phenotypes in prostate cancer remains a major biological and clinical challenge 1,2 . Recent advances in interpretability of machine learning models as applied to biomedical problems may enable discovery and prediction in clinical cancer genomics 3–5 . Here we developed P-NET—a biologically informed deep learning model—to stratify patients with prostate cancer by treatment-resistance state and evaluate molecular drivers of treatment resistance for therapeutic targeting through complete model interpretability. We demonstrate that P-NET can predict cancer state using molecular data with a performance that is superior to other modelling approaches. Moreover, the biological interpretability within P-NET revealed established and novel molecularly altered candidates, such as MDM4 and FGFR1 , which were implicated in predicting advanced disease and validated in vitro. Broadly, biologically informed fully interpretable neural networks enable preclinical discovery and clinical prediction in prostate cancer and may have general applicability across cancer types.
Overview
The claims and statistics of this paper haven’t been checked yet.
Run the check — free, no account needed. It reads the open-access text and checks the sources it cites.
Integrity signals
Registry
Cites
Statistics
Figures
Verification
Claims the paper makes
The claims and statistics of this paper haven’t been checked yet.
Run the check — free, no account needed. It reads the open-access text and checks the sources it cites.
Claims other papers make about this one
Each is checked against this paper’s own text: does it say what the citing paper says it does?
The source backs part of the claim, not all of it — or backs it for a different population, condition or comparison.
In the citing paper
“P-NET applied the hierarchical pathway information to construct a sparse deep neural network for inferring the disease status-specific molecular alterations, which aids in disease diagnosis and drug design for prostate cancer [116].”
From Challenges in AI-driven Biomedical Multimodal Data Fusion and Analysis (2025) · cites this paper as [116]
Experimental — accuracy not yet measuredThe source backs part of the claim, not all of it — or backs it for a different population, condition or comparison.
In the citing paper
“While multiple deep learning methods have been developed to integrate biological pathway information with neural network architectures [116,166], these methods are still limited by the predefined pathway annotations.”
From Challenges in AI-driven Biomedical Multimodal Data Fusion and Analysis (2025) · cites this paper as [116]
Experimental — accuracy not yet measuredThe cited source says what the claim attributes to it.
In the citing paper
“The common approach for biological model design is to construct a neural network architecture that is restrained by biological pathways, specifically connecting target gene nodes with pathway nodes, including models of P-NET [116], pmVAE [163], VEGA [164], and LDVAE [165].”
From Challenges in AI-driven Biomedical Multimodal Data Fusion and Analysis (2025) · cites this paper as [116]
In the citing paper
“P-NET (112) is a sparse deep learning model that processes molecular profiling data in a biologically informed, pathway-driven fashion to predict prostate disease states such as metastases, where the resulting prediction scores were shown to independently correlate with prognosis.”
From Artificial Intelligence in Oncology: Current Landscape, Challenges, and Future Directions (2024) · cites this paper as [112]
Self-check
Percentages, sums and reported differences re-computed from the paper’s own numbers.
The self-check needs the paper’s full text.
Citations
Cites
Adam: A Method for Stochastic Optimization
Kingma, D. P., & Ba, J. (2014) · arXiv · doi:10.48550/arxiv.1412.6980 · Cited by 98,946
STAR: ultrafast universal RNA-seq aligner
Dobin, A., Davis, C. A., Schlesinger, F., Drenkow, J., Zaleski, C., Jha, S., Batut, P., Chaisson, M., & Gingeras, T. R. (2013) · Bioinformatics · doi:10.1093/bioinformatics/bts635 · Cited by 51,709
Cutadapt removes adapter sequences from high-throughput sequencing reads
Martin, M. (2011) · EMBnet.journal · doi:10.14806/ej.17.1.200 · Cited by 33,889
DeLong, E. R., DeLong, D. M., & Clarke-Pearson, D. L. (1988) · Biometrics · doi:10.2307/2531595 · Cited by 22,649
"Why Should I Trust You?": Explaining the Predictions of Any Classifier
Ribeiro, M. T., Singh, S., & Guestrin, C. (2016) · Proceedings of the 22nd ACM SIGKDD International Conference on Knowledge Discovery and Data Mining · doi:10.1145/2939672.2939778 · Cited by 17,555
The Reactome pathway Knowledgebase
Fabregat, A., Sidiropoulos, K., Garapati, P., Gillespie, M., Hausmann, K., Haw, R., Jassal, B., Jupe, S., Korninger, F., McKay, S., et al. (2016) · Nucleic Acids Research · doi:10.1093/nar/gkv1351 · Cited by 5,605
Integrative Clinical Genomics of Advanced Prostate Cancer
Robinson, D., Van Allen, E. M., Wu, Y.-M., Schultz, N., Lonigro, R. J., Mosquera, J.-M., Montgomery, B., Taplin, M.-E., Pritchard, C. C., Attard, G., et al. (2015) · Cell · doi:10.1016/j.cell.2015.05.001 · Cited by 3,645
Mermel, C. H., Schumacher, S. E., Hill, B., Meyerson, M. M., Beroukhim, R., & Getz, G. A. (2011) · Genome biology · doi:10.1186/gb-2011-12-4-r41 · Cited by 3,520
Discovery and saturation analysis of cancer genes across 21 tumour types
Lawrence, M. S., Stojanov, P., Mermel, C. H., Robinson, J. T., Garraway, L. A., Golub, T. R., Meyerson, M., Gabriel, S. B., Lander, E. S., & Getz, G. (2014) · Nature · doi:10.1038/nature12912 · Cited by 3,096
Pruning Filters for Efficient ConvNets
Li, H., Kadav, A., Durdanovic, I., Samet, H., & Graf, H. P. (2016) · arXiv · doi:10.48550/arxiv.1608.08710 · Cited by 2,928
Research works printed but not linked: 2
- Han S., Pool J., Tran J., Dally W. in Advances in Neural Information Processing Systems (eds Cortes C. et al.) 1135–1143 (Curran Associates, 2015).
- Lundberg S. M., Lee S.-I. in Advances in Neural Information Processing Systems 30 (eds Guyon I. et al.) 4765–4774 (Curran Associates, 2017).
Cited by
Sorted by citations
Items 201–300 of 462
Algorithms on the rise: a machine learning–driven survey of prostate cancer literature
Gu, S., Chen, J., Fan, C., Huang, X., Li, L., & Zhang, H. (2025) · Frontiers in Oncology · doi:10.3389/fonc.2025.1675459 · Cited by 6
Rizi, F. R., Jamadi, M. S., Rahimi, S., Bighamian, M., Paidar, P., Taki, M. J., & Bahmaie, N. (2026) · Frontiers in Oncology · doi:10.3389/fonc.2026.1763359 · Cited by 7
Bazarkin, A., Morozov, A., Androsov, A., Fajković, H., Rivas, J. G., Singla, N., Koroleva, S. V., Teoh, J. Y., Zvyagin, A. V., Shariat, S. F., et al. (2023) · Current Urology Reports · doi:10.1007/s11934-023-01193-2 · Cited by 7
The endocrine and epigenetic impact of persistent cow milk consumption on prostate carcinogenesis
Melnik, B. C., John, S. M., Weiskirchen, R., & Schmitz, G. (2022) · Journal of Translational Genetics and Genomics · doi:10.20517/jtgg.2021.37 · Cited by 6
Multiple-model machine learning identifies potential functional genes in dilated cardiomyopathy
Zhang, L., Lin, Y., Wang, K., Han, L., Zhang, X., Gao, X., Li, Z., Zhang, H., Zhou, J., Yu, H., et al. (2023) · Frontiers in Cardiovascular Medicine · doi:10.3389/fcvm.2022.1044443 · Cited by 6
Zhao, R., Hu, Z., Wang, X., Tao, P., Wang, Y., Liu, T., Wei, Y., Xu, H., & He, X. (2023) · Applied Optics · doi:10.1364/ao.485006 · Cited by 6
Gundogdu, P., Álamo-Álvarez, I., Nepomuceno-Chamorro, I. A., Dopazo, J., & Loucera, C. (2023) · Biology · doi:10.3390/biology12040579 · Cited by 6
Advancements in the Application of the Intersection of Medicine and Engineering in Cancer Research
Chen, H., Zhang, G.-M., Qian, Y., Yang, P., Li, X., Wang, J., Wang, J., Hu, Y.-X., Xiao, H., Zhong, Q., et al. (2025) · Cancer Nexus · doi:10.1002/cnx2.70003 · Cited by 6
Ma, W., Zheng, W., Qin, S., Wang, C., Lei, B., & Liu, Y. (2025) · GigaScience · doi:10.1093/gigascience/giaf083 · Cited by 6
Cell Decoder: decoding cell identity with multi-scale explainable deep learning
Zhu, J., Zhang, Z., Xiang, Y., Xie, B., Dong, X., Xie, L., Zhou, P., Yao, R., Yang, L., Li, Y., et al. (2025) · Genome biology · doi:10.1186/s13059-025-03832-y · Cited by 8
Artificial-Intelligence-Driven Precision Medicine in Cancer Treatment
Hassane, M. (2024) · Premier journal of science. · doi:10.70389/pjs.100041 · Cited by 7
Lama, R., Fose, J. M., Martín, D., Muñoz, I. G., Wang, E. S., Sung, P. J., Chemler, S. R., & Wang, X. (2025) · Molecules · doi:10.3390/molecules30010186 · Cited by 5
Modeling microbiome-trait associations with taxonomy-adaptive neural networks
Jiang, Y., Aton, M., Zhu, Q., & Lu, Y. Y. (2025) · Microbiome · doi:10.1186/s40168-025-02080-3 · Cited by 9
MTM: a multi-task learning framework to predict individualized tissue gene expression profiles
He, G., Chen, M., Bian, Y., & Yang, E. (2023) · Bioinformatics · doi:10.1093/bioinformatics/btad363 · Cited by 5
PT-Finder: A multi-modal neural network approach to target identification
Nada, H., Kim, S.-D., & Lee, K. (2024) · Computers in Biology and Medicine · doi:10.1016/j.compbiomed.2024.108444 · Cited by 5
Optimal fusion of genotype and drug embeddings in predicting cancer drug response
Nguyen, T., Campbell, A., Kumar, A., Amponsah, E., Fiterau, M., & Shahriyari, L. (2024) · Briefings in Bioinformatics · doi:10.1093/bib/bbae227 · Cited by 5
SPIN: sex-specific and pathway-based interpretable neural network for sexual dimorphism analysis
Ko, E., Kim, Y. H., Shokoohi, F., Baye, T. M., & Kang, M. (2024) · Briefings in Bioinformatics · doi:10.1093/bib/bbae239 · Cited by 5
A selective Kalman filtering approach to online neural network updating under system drift
Hammond, J. E., Soderstrom, T. A., Korgel, B. A., & Bâldea, M. (2025) · Scientific Reports · doi:10.1038/s41598-025-24558-8 · Cited by 5
Interpreting protein abundance in Saccharomyces cerevisiae through relational learning
Brunnsåker, D., Kronström, F., Tiukova, I., & King, R. D. (2024) · Bioinformatics · doi:10.1093/bioinformatics/btae050 · Cited by 4
A roadmap for AI-aided digital twins in computational nuclear oncology: A position paper by the EANM
Cavinato, L., Kirienko, M., Papp, L., Shi, K., Visvikis, D., Chiti, A., & Sollini, M. (2025) · The EANM Journal · doi:10.1016/j.eanmj.2025.100007 · Cited by 4
Ge, H., Mo, H., Wei, Y., Wang, J., Qi, Y., Li, L., & Ma, F. (2025) · Nature Communications · doi:10.1038/s41467-025-66384-6 · Cited by 4
Representing and extracting knowledge from single-cell data
Mihai, I. S., Chafle, S., & Henriksson, J. (2023) · Biophysical Reviews · doi:10.1007/s12551-023-01091-4 · Cited by 5
A simple approach for local and global variable importance in nonlinear regression models
Winn-Nuñez, E. T., Griffin, M., & Crawford, L. A. (2024) · Computational Statistics & Data Analysis · doi:10.1016/j.csda.2023.107914 · Cited by 6
A Commentary on Multi-omics Data Integration in Systems Vaccinology
Shannon, C. P., Lee, A. H., Tebbutt, S. J., & Singh, A. (2024) · Journal of Molecular Biology · doi:10.1016/j.jmb.2024.168522 · Cited by 4
Tan, J., Xie, J., Huang, J., Deng, W., Chai, H., & Yang, Y. (2024) · Computational and Structural Biotechnology Journal · doi:10.1016/j.csbj.2024.07.019 · Cited by 5
Kennedy, L., Sandhu, J. K., Harper, M.-E., & Cuperlovic-Culf, M. (2025) · BMC Bioinformatics · doi:10.1186/s12859-025-06051-1 · Cited by 4
Jemimah, S., Abuhantash, F., & Shehhi, A. A. (2025) · PLoS ONE · doi:10.1371/journal.pone.0320360 · Cited by 4
Usefulness of Collaborative Work in the Evaluation of Prostate Cancer from MRI
Mata, C., WALKER, P. M., Oliver, A., Martı́, J., & Lalande, A. (2022) · Clinics and Practice · doi:10.3390/clinpract12030040 · Cited by 4
A3SOM, abstained explainable semi-supervised neural network based on self-organizing map
Creux, C., Zehraoui, F., Hanczar, B., & Tahi, F. (2023) · PLoS ONE · doi:10.1371/journal.pone.0286137 · Cited by 4
Puiu, A., Gómez-Tapia, C., Weiss, M. E. R., Singh, V., Kamen, A., & Siebert, M. (2024) · Scientific Reports · doi:10.1038/s41598-024-57057-3 · Cited by 4
FANS: A framework for automatic assessment of nutritional status based on free-text clinical notes
Hu, J., Wang, X., Yao, K., (49484), X. Z., Zhao, W., Fu, J., Lou, P., Chen, W., & Fang, A. (2025) · International Journal of Medical Informatics · doi:10.1016/j.ijmedinf.2025.106168 · Cited by 4
Yang, J., Li, Z., Wu, W. K. K., Shi, Y., Chu, Q., & Zhang, Q. (2022) · Research Square · doi:10.21203/rs.3.rs-1269212/v1 · Cited by 4
Beyond Low Earth Orbit: Biological Research, Artificial Intelligence, and Self-Driving LabsPreprint
Sanders, L. M., Yang, J. H., Scott, R. T., Qutub, A., Martín, H. G., Berrios, D., Hastings, J. J. A., Rask, J., Mackintosh, G., Hoarfrost, A. L., et al. (2021) · arXiv.org · doi:10.48550/arxiv.2112.12582 · Cited by 3
Principled feature attribution for unsupervised gene expression analysisPreprint
Janizek, J. D., Spiro, A. E., Çelik, S., Blue, B. W., Russell, J. C., Lee, T.-I., Kaeberlin, M., & Lee, S. (2022) · bioRxiv (Cold Spring Harbor Laboratory) · doi:10.1101/2022.05.03.490535 · Cited by 4
Explainable drug side effect prediction via biologically informed graph neural networkPreprint
Huang, T., Lin, K., Machado‐Vieira, R., Soares, J. C., Jiang, X., & Kim, Y. (2023) · medRxiv · doi:10.1101/2023.05.26.23290615 · Cited by 4
Convection-Diffusion Equation: A Theoretically Certified Framework for Neural Networks
Wang, T., Bao, C., & Shi, Z. (2025) · IEEE Transactions on Pattern Analysis and Machine Intelligence · doi:10.1109/tpami.2025.3540310 · Cited by 5
Liu, Z., Chen, Z.-X. C., Xue, K., & Chen, M. (2025) · Frontiers in Immunology · doi:10.3389/fimmu.2025.1562559 · Cited by 3
FR-BINN: Biologically Informed Neural Networks for Enhanced Biomarker Discovery and Pathway Analysis
Cao, Y., Yin, C., Zhou, X., & Zhao, Y. (2025) · International Journal of Molecular Sciences · doi:10.3390/ijms26146670 · Cited by 3
Biological Knowledge Graph-Enhanced Cancer State Prediction Network with Adjustable Connections
Liu, Y., Yi, S., Chen, X., Guo, W., & He, L. (2025) · Big Data Mining and Analytics · doi:10.26599/bdma.2025.9020006 · Cited by 3
Bazarkin, A., Taratkin, M. S., Vovdenko, S. V., Androsov, A., Balashova, M., Morozov, A., Itskevich, A., Laukhtina, E., Алексеевич, Б. Е., Singla, N., et al. (2026) · Urologic Oncology Seminars and Original Investigations · doi:10.1016/j.urolonc.2025.12.001 · Cited by 3
Raieli, S., Jeanray, N., Gérart, S., Vachenc, S., & Altahhan, A. (2026) · npj Artificial Intelligence · doi:10.1038/s44387-025-00056-0 · Cited by 7
Explainable Machine Learning Models for Robust Clinical Biomarker Identification
Arivazhagi, I., Shobha, K., Gupta, D., Muzaffar, C., Allaberganova, M. R., & Ashirova, A. I. (2025) · IEEE Global Conference on Wireless Computing and Networking (GCWCN) · doi:10.1109/gcwcn66157.2025.11448530 · Cited by 3
Benchmarking computational methods for multi-omics biomarker discovery in cancer
Li, A. Z., Du, Y., Liu, Y., Chen, L., & Liu, R. (2026) · Briefings in Bioinformatics · doi:10.1093/bib/bbag200 · Cited by 3
Spatial biomarker discovery via interpretable semantic learning in histopathology
Liang, J., Jiang, X., Reitsam, N. G., Lenz, T., Zhang, L., Gustav, M., Carrero, Z. I., Muti, H. S., Neidlinger, P., Clusmann, J., et al. (2026) · Cancer Cell · doi:10.1016/j.ccell.2026.05.014 · Cited by 3
A Review of Neuroproteomics in Neurological Disorders: The Use of Machine Learning and Deep Learning
Mahendran, G., & Kirupaharan, P. (2026) · Sci · doi:10.3390/sci8080207 · Cited by 3
How Artificial Intelligence Unravels the Complex Web of Cancer Drug Response
Elemento, O. (2024) · Cancer Research · doi:10.1158/0008-5472.can-24-1123 · Cited by 5
Yin, Q., Hu, Y., Dong, Z., Lu, J., & Wang, H. (2024) · Journal of Medicinal Chemistry · doi:10.1021/acs.jmedchem.4c00913 · Cited by 3
DeepBINN: A tailored biologically-informed neural network for robust biomarker identification
Meirer, J., Wittwer, L. D., Revol, V., & Heinemann, T. (2024) · IEEE Swiss Conference on Data Science (SDS) · doi:10.1109/sds60720.2024.00044 · Cited by 3
Raina, M., Cheng, H., Ferreira, R. M., Stansfield, T., Modak, C., Cheng, Y., Suryadevara, H. N. S. K., Xu, D. H., Eadon, M. T., Ma, Q., et al. (2025) · Bioinformatics · doi:10.1093/bioinformatics/btaf303 · Cited by 3
Developing a Novel Enzalutamide‐Resistant Prostate Cancer Model via AR F877L Mutation in LNCaP Cells
Wang, R., Ma, S., Xu, N., Gan, Y., Li, P., Zhang, J., Zhang, Z., Gu, Q., & Xiang, J. (2024) · Current Protocols · doi:10.1002/cpz1.1033 · Cited by 3
Kim, Y., Han, Y.-H., Hopper, C., Lee, J., Joo, J. I., Gong, J., Lee, C., Jang, S., Kang, J., Kim, T., et al. (2024) · Cell Reports Methods · doi:10.1016/j.crmeth.2024.100773 · Cited by 3
Oldenburg, J., Wagner, J., Troschke‐Meurer, S., Plietz, J., Kaderali, L., Völzke, H., Nauck, M. A., Homuth, G., Völker, U., & Simm, S. (2024) · Biomolecules · doi:10.3390/biom14121501 · Cited by 3
Anaya, J., Sidhom, J.-W., Mahmood, F., & Baras, A. S. (2020) · bioRxiv (Cold Spring Harbor Laboratory) · doi:10.1101/2020.08.05.237206 · Cited by 3
Liu, X., Tao, Y., Cai, Z., Bao, P., Ma, H., Li, K., Li, M., Zhu, Y., & Lu, Z. J. (2023) · bioRxiv (Cold Spring Harbor Laboratory) · doi:10.1101/2023.05.23.541554 · Cited by 3
Decoding cell identity with multi-scale explainable deep learningPreprint
Zhu, J., Zhang, Z., Xiang, Y., Xie, B., Dong, X., Xie, L., Zhou, P., Yao, R., Wang, X., Li, Y., et al. (2024) · bioRxiv (Cold Spring Harbor Laboratory) · doi:10.1101/2024.02.05.578922 · Cited by 3
Detecting Genetic Interactions with Visible Neural Networks
van Hilten, A., Melograna, F., Fan, B., Niessen, W., van Steen, K., & Roshchupkin, G. (2024) · doi:10.1101/2024.02.27.582086 · Cited by 3
End-to-end deep learning versus machine learning for biomarker discovery in cancer genomesPreprint
Unger, M., Loeffler, C. M. L., Vibert, J., Žigutytė, L., Sainath, S., Lenz, T., Möck, A., Fröhling, S., Graham, T. A., Carrero, Z. I., et al. (2025) · bioRxiv (Cold Spring Harbor Laboratory) · doi:10.1101/2025.01.06.631471 · Cited by 3
Statistical testing for uncertainty of P-NET by DeepLIFT
Goo, T., Lee, C., Shin, S., Kim, H., & Park, T. (2025) · Discover Applied Sciences · doi:10.1007/s42452-025-07156-1 · Cited by 2
Wang, X., Lama, R., Kelleher, A. D., Rizzo, E., Galster, S. L., Xue, C., Zhang, Y., Wang, J., Qu, J., & Chemler, S. R. (2025) · Molecules · doi:10.3390/molecules30132696 · Cited by 3
Biologically informed neural network models are robust to spurious interactions via self-pruning
Nordenstorm, O., Baghdassarian, H., Xu, X., Lauffenburger, D. A., & Nilsson, A. (2026) · Bioinformatics · doi:10.1093/bioinformatics/btag556 · Cited by 3
Geng, P., Feng, W., Shi, Z., Gao, R., Gao, Q., Jing, Q., Cai, W., & An, H. (2025) · Medicine · doi:10.1097/md.0000000000045319 · Cited by 2
Zeng, S., Adusumilli, T., Awan, S. Z., Immadi, M. S., Xu, D. H., & Joshi, T. (2025) · Biomolecules · doi:10.3390/biom15121673 · Cited by 2
Li, X., Pan, B., He, Y., Wang, Z., Tang, Y., Zhang, Y., Wang, L., & Han, J. (2025) · Genome Medicine · doi:10.1186/s13073-025-01584-9 · Cited by 3
Artificial intelligence in radiobiology: Bridging mechanisms and data analysis
Wang, Y., Li, W., Xu, N., Xie, D., Huang, X., & Zhou, P. (2025) · Radiation Medicine and Protection · doi:10.1016/j.radmp.2025.12.005 · Cited by 2
DSEM: Gene pathway and histology dual-stage enhanced fusion model for survival prediction
Wang, M., Wang, N., Han, S., Xue, Y., & Zhang, C. (2025) · Biomedical Signal Processing and Control · doi:10.1016/j.bspc.2025.109288 · Cited by 2
Miao, C., Sun, H., Yao, F., Hong, T., Ren, Z., Zhuang, Y., Lin, Q., Bian, S., Yang, Y., & Lin, Y. (2026) · Academic Radiology · doi:10.1016/j.acra.2025.12.050 · Cited by 2
Kuang, X., Yang, B. F., Ling, B. W., Teo, K. L., & Zhang, X. (2026) · Expert Systems with Applications · doi:10.1016/j.eswa.2026.131506 · Cited by 2
Wang, X., Shen, B., Yang, W., Wang, X., Li, C., & Wu, H. (2026) · Journal of Nanobiotechnology · doi:10.1186/s12951-026-04023-y · Cited by 2
AI-Driven Drug Discovery: Focus on Targets for Solid Tumors
Wu, J., He, J., Ni, Q., Li, Z., Lin, X., Zhao, Z., Qiu, L., WANG, H., Li, S., Shi, C., et al. (2026) · Pharmaceutics · doi:10.3390/pharmaceutics18030329 · Cited by 3
Bridging mechanism and data: Hybrid modeling approaches for cancer and aging research
Eriksson, L., Häggström, H., Lakatos, E., Polster, A. V., & Cvijović, M. (2026) · Current Opinion in Systems Biology · doi:10.1016/j.coisb.2026.100573 · Cited by 2
MR.DRP: A Parameter Adaptive Machine Learning Framework for Drug Response Prediction
Cai, Z., He, J., Yu, B., & Wei, L. (2022) · International Conference on Applied Machine Learning (ICAML) · doi:10.1109/icaml57167.2022.00019 · Cited by 2
Yin, P., Zhou, Z., Liu, J., Jiang, N., Zhang, J., Liu, S., Wang, F., & Wang, K. (2023) · Physics in Medicine and Biology · doi:10.1088/1361-6560/aced34 · Cited by 2
Cytogenetics and genomics in pediatric acute lymphoblastic leukaemia
Antić, Ž., Lentes, J., & Bergmann, A. K. (2023) · Best Practice & Research Clinical Haematology · doi:10.1016/j.beha.2023.101511 · Cited by 3
Deep learning-based ensemble model of X-ray image for rapid diagnosis of Covid-19
Chen, X., Chen, W., Luo, Y., & Liu, M. (2023) · International Conference on Algorithms, Data Mining, and Information Technology (ADMIT) · doi:10.1145/3625403.3625447 · Cited by 2
Yang, Z., Li, X., Sheng, L., Zhu, M., Lan, X., & Gu, F. (2024) · Bioinformatics · doi:10.1093/bioinformatics/btae013 · Cited by 2
Zhang, Y., Sun, X., Zhang, P., Zhou, X., Huang, X., Zhang, M., Qiao, G., Xu, J., Chen, M., & Shu, W. (2024) · Communications in computer and information science · doi:10.1007/978-981-97-0903-8_14 · Cited by 2
Zhou, X., Qian, Y., Ling, C., He, Z., Shi, P., Gao, Y., & Sui, X. (2024) · Journal of Translational Medicine · doi:10.1186/s12967-024-05127-5 · Cited by 2
Transparent sparse graph pathway network for analyzing the internal relationship of lung cancer
Jin, Z., Shi, Y., & Zhou, L. (2024) · Frontiers in Genetics · doi:10.3389/fgene.2024.1437174 · Cited by 2
Oral Voice Recognition System Based on Deep Neural Network Posteriori Probability Algorithm
Zhang, N. (2024) · Procedia Computer Science · doi:10.1016/j.procs.2024.09.028 · Cited by 2
Zhou, L., Li, J., & Tan, W. (2024) · IEEE Journal of Biomedical and Health Informatics · doi:10.1109/jbhi.2024.3493618 · Cited by 2
Han, F., Fan, X., Long, P., Zhang, W., Li, Q., Li, Y., Guo, X., Luo, Y., Wen, R., Wang, S., et al. (2025) · Asian journal of urology · doi:10.1016/j.ajur.2024.09.009 · Cited by 4
Artificial Intelligence for Early Breast Cancer Detection
Deendyal, V., Ghazaryan, L., Linden, E. A., Allen, L., & Thaker, N. G. (2025) · AI in Precision Oncology · doi:10.1089/aipo.2024.0051 · Cited by 4
Raya, D., Peta, V., Bomgni, A. B., Aryal, S., Do, T., Jawaharraj, K., Salem, D. R., Gadhamshetty, V., Dhiman, S. S., & Gnimpiéba, E. Z. (2025) · Computational and Structural Biotechnology Journal · doi:10.1016/j.csbj.2025.04.022 · Cited by 2
Li, R., Wang, Q., Gao, R., Shen, R., Wang, Q., Cui, X., Jiang, Z., Zhang, L., & Fang, J. (2025) · Clinical and Experimental Pharmacology and Physiology · doi:10.1111/1440-1681.70031 · Cited by 2
Xie, L., Jiang, P., & Chang, C. (2025) · Genomics Proteomics & Bioinformatics · doi:10.1093/gpbjnl/qzaf052 · Cited by 2
Hsieh, K., Zhang, K., Chu, Y., Yu, L., Li, X., Hu, N., Kawosa, I., Pilie, P. G., Bhattacharya, P. K., Zhi, D., et al. (2025) · Briefings in Bioinformatics · doi:10.1093/bib/bbaf296 · Cited by 3
Scherer, P. C., Trębacz, M., Simidjievski, N., Viñas, R., Shams, Z., Andrés-Terré, H., Jamnik, M., & Lió, P. (2021) · Bioinformatics · doi:10.1093/bioinformatics/btab830 · Cited by 2
Liu, Y., Zhang, Y., & Imoto, S. (2023) · PLoS ONE · doi:10.1371/journal.pone.0290307 · Cited by 2
Progress of bioinformatics studies for multi-omics and multi-modal data in complex diseases
Liu, X., & Lü, Z. (2024) · Chinese Science Bulletin (Chinese Version) · doi:10.1360/tb-2024-0416 · Cited by 2
AI inspired discovery of new biomarkers for clinical prognosis of liver cancerPreprint
Liang, J., Zhang, W., Yang, J., Wu, M., Dai, Q., Yin, H., Xiao, Y., & Kong, L. (2022) · bioRxiv (Cold Spring Harbor Laboratory) · doi:10.1101/2022.05.03.490448 · Cited by 2
Liu, L., Lin, W., Cao, S., Yang, L., Gao, S., Jiao, N., Zhu, L., Zhu, R., & Wu, D. (2023) · medRxiv · doi:10.1101/2023.01.31.23285308 · Cited by 2
Hartman, E., Scott, A. M., Malmström, L., & Malmström, J. A. (2023) · bioRxiv (Cold Spring Harbor Laboratory) · doi:10.1101/2023.02.16.528807 · Cited by 2
MIOSTONE: Modeling microbiome-trait associations with taxonomy-adaptive neural networksPreprint
Jiang, Y., Aton, M., Zhu, Q., & Lu, Y. Y. (2023) · bioRxiv (Cold Spring Harbor Laboratory) · doi:10.1101/2023.11.04.565596 · Cited by 2
Yang, J., Wu, W. K. K., Hui, R. Y. M., Wong, I. C. K., & Zhang, Q. (2024) · bioRxiv (Cold Spring Harbor Laboratory) · doi:10.1101/2024.01.29.576766 · Cited by 2
Supervised Deep Learning with Gene Annotation for Cell ClassificationPreprint
Lin, Z., Gao, Y., & Sun, W. (2024) · bioRxiv (Cold Spring Harbor Laboratory) · doi:10.1101/2024.07.15.603527 · Cited by 2
Functional gene embeddings improve rare variant polygenic risk scoresPreprint
Londhe, S., Lindner, J., Chen, Z., Holtkamp, E., Hölzlwimmer, F. R., Casale, F. P., Brechtmann, F., & Gagneur, J. (2024) · bioRxiv (Cold Spring Harbor Laboratory) · doi:10.1101/2024.07.22.604535 · Cited by 2
Modeling Sensorimotor Processing with Physics-Informed Neural NetworksPreprint
Rotondo, A. P., Vargas, A. M., Dimitriou, M. D., & Mathis, A. (2024) · bioRxiv (Cold Spring Harbor Laboratory) · doi:10.1101/2024.09.14.613030 · Cited by 2
MetDeeCINE: Deciphering Metabolic Regulation through Deep Learning and Multi-OmicsPreprint
Ito, T., Ohno, S., Wang, Y., Uematsu, S., Kuroda, S., & Shimizu, H. (2025) · bioRxiv (Cold Spring Harbor Laboratory) · doi:10.1101/2025.03.24.645125 · Cited by 2
Li, W., Lin, K. Y., Hou, Y., & Zhang, Q. (2022) · IEEE International Conference on Tools with Artificial Intelligence (ICTAI) · doi:10.1109/ictai56018.2022.00168 · Cited by 1
Metadata
- Authors
- Elmarakeby, H. A., Hwang, J., Arafeh, R., Crowdis, J., Gang, S., Liu, D., AlDubayan, S. H., Salari, K., Kregel, S., Richter, C., Arnoff, T. E., Park, J., Hahn, W. C., & Van Allen, E. M.
- Affiliations
- Broad Institute (US)
- University of Minnesota (US)
- Dana-Farber Cancer Institute (US)
- University of Illinois Chicago (US)
- ORCID
- Venue
- Nature
- Published
- 2021-09-22
- Volume
- 598
- Issue
- 7880
- Pages
- 348-352
- ISSN
- 0028-0836 (ISSN-L)
- 1476-4687
- PMC
- PMC8514339
- OpenAlex
- W3199772305
- Cited by
- 456
- References
- 61
- Citations by year
- 2026: 99 · 2025: 105 · 2024: 111 · 2023: 88 · 2022: 47 · 2021: 5
- FWCI
- 41.88
- Type
- journal article
- Language
- en
- Open access
- hybrid
- doi.org
- Locations
- Nature (publishedVersion, cc-by)
- bioRxiv (Cold Spring Harbor Laboratory) (acceptedVersion, cc-by-nc-nd)
- Europe PMC (PubMed Central) (publishedVersion, other-oa)
- PubMed Central (publishedVersion, cc-by)
- PubMed (publishedVersion)
- Digital Access to Scholarship at Harvard (DASH) (Harvard University) (acceptedVersion)
- RePEc: Research Papers in Economics (submittedVersion)
- Funders
- U.S. Department of Defense (U01 CA233100, PC200150)
- Movember Foundation
- National Institutes of Health
- National Cancer Institute (U01CA176058, U01CA233100)
- Topics
- Life Sciences › Biochemistry, Genetics and Molecular Biology › Cancer Research › Prostate Cancer Treatment and Research
- Health Sciences › Medicine › Radiology, Nuclear Medicine and Imaging › Radiomics and Machine Learning in Medical Imaging
- Life Sciences › Biochemistry, Genetics and Molecular Biology › Cancer Research › Breast Cancer Treatment Studies
- Keywords
- prostate cancer, treatment resistance, interpretable neural networks, MDM4, FGFR1, cancer genomics, patient stratification, therapeutic targeting
- MeSH terms
- Deep Learning, Humans, Male, Prostatic Neoplasms, Proto-Oncogene Proteins, Receptors, Androgen, Reproducibility of Results, Tumor Suppressor Protein p53, Cell Cycle Proteins, Drug Resistance, Neoplasm, Receptor, Fibroblast Growth Factor, Type 1
About these checks
Registry, retraction, Cites and statistics results are computed, not judged, with one exception: a printed reference that no index lists is read once by a model before it counts as a citation error. Claims are extracted by a model and kept only when their quote appears verbatim in the text; each cited source is then checked, with a model’s help, for whether it says what the claim relies on. Those verdicts can be wrong — read the claim’s quote and the cited source before relying on one.
Statistics and arithmetic are recomputed, not judged.
Confidence bands are shown only for fields calibrated on our annotated test set. None is calibrated yet, so no band is shown.
What counts as a claim ›How we measure confidence ›How we check this ›
Are you an author, or do you see a problem with this page? Request a review
