

The DOI matches its Crossref record; 65 of the 65 references it cites were found in a registry or an index; 2 of the 47 sources its claims cite were checked for support.
Spatial epigenome–transcriptome co-profiling of mammalian tissues
Open accessPublished version of a preprint
Abstract
Emerging spatial technologies, including spatial transcriptomics and spatial epigenomics, are becoming powerful tools for profiling of cellular states in the tissue context 1–5 . However, current methods capture only one layer of omics information at a time, precluding the possibility of examining the mechanistic relationship across the central dogma of molecular biology. Here, we present two technologies for spatially resolved, genome-wide, joint profiling of the epigenome and transcriptome by cosequencing chromatin accessibility and gene expression, or histone modifications (H3K27me3, H3K27ac or H3K4me3) and gene expression on the same tissue section at near-single-cell resolution. These were applied to embryonic and juvenile mouse brain, as well as adult human brain, to map how epigenetic mechanisms control transcriptional phenotype and cell dynamics in tissue. Although highly concordant tissue features were identified by either spatial epigenome or spatial transcriptome we also observed distinct patterns, suggesting their differential roles in defining cell states. Linking epigenome to transcriptome pixel by pixel allows the uncovering of new insights in spatial epigenetic priming, differentiation and gene regulation within the tissue architecture. These technologies are of great interest in life science and biomedical research.
Overview
AI snapshot
Written from the paper’s full text.
TL;DR
The paper presents spatial ATAC–RNA-seq and spatial CUT&Tag–RNA-seq for genome-wide joint profiling of chromatin accessibility or histone modifications and mRNA on the same tissue section at near-single-cell resolution. These methods were applied to embryonic and juvenile mouse brain and adult human hippocampus, revealing spatial epigenetic–transcriptional relationships including epigenetic priming and region-specific gene regulation.
Key findings
- In P22 mouse brain with 100 × 100 barcodes, spatial ATAC–RNA-seq yielded a median of 14,284 unique fragments per pixel, with 19% enriched at transcription start sites and 26% in peaks; RNA detected 22,914 genes, averaging 1,073 genes and 2,358 UMIs per pixel.
- Spatial CUT&Tag–RNA-seq on P22 mouse brain gave median unique fragments per pixel of 10,644 for H3K27me3, 10,002 for H3K27ac and 2,507 for H3K4me3; paired RNA averaged 2,011, 1,513 and 1,329 genes per pixel, respectively.
- Joint clustering of E13 mouse embryo ATAC and RNA identified a new neuronal cluster J10 not readily resolved by single modalities; in P22 mouse brain, 21,417 significant peak-to-gene linkages were detected by ATAC–RNA-seq and 19,468 from H3K27ac CUT&Tag–RNA-seq.
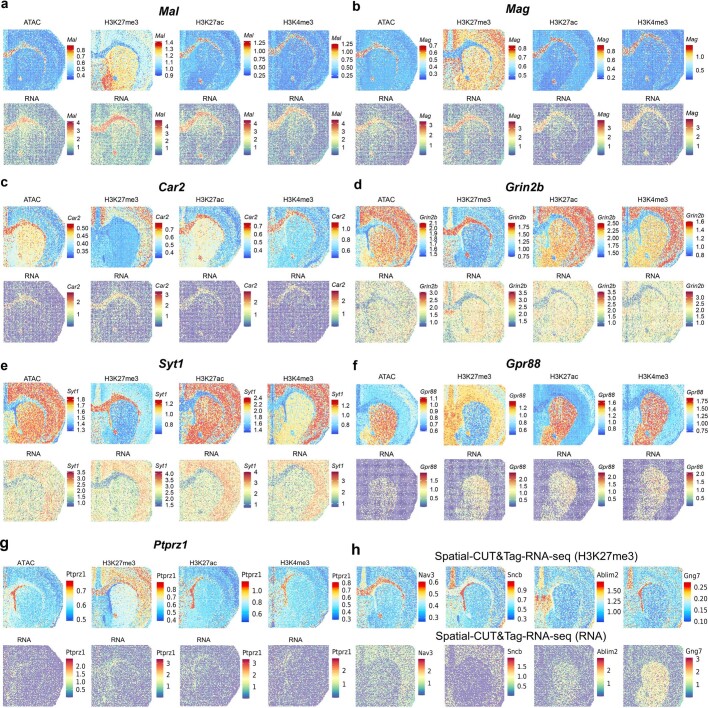
- Region-specific regulation was observed: H3K27me3 anticorrelated with RNA in corpus callosum (for example, Mal, Mag and Car2 low CSS/high RNA; Grin2b and Syt1 high CSS/low RNA), while H3K27ac and H3K4me3 correlated with RNA; potential bivalency/poising was noted for genes such as Ptprz1 and Fnbp1. In human hippocampus, PROX1 was highly expressed in the granule cell layer but showed modest chromatin accessibility.
Methods
- Frozen tissue sections were fixed, subjected to Tn5 transposition for ATAC or antibody-guided pA-Tn5 CUT&Tag, then in-tissue reverse transcription; sequential microfluidic barcode A and B ligation generated 50 × 50 or 100 × 100 pixel grids (2,500 or 10,000 pixels), with separate gDNA and cDNA libraries sequenced on Illumina NovaSeq 6000 (paired-end, 150 bp).
- Samples included E13 mouse embryo, P21/22 mouse brain and adult human hippocampus from a 31-year-old male; pixel sizes were 50 μm for embryo and human tissue and 20 μm for juvenile mouse brain. Analyses used Signac, Seurat and ArchR, with label transfer to scRNA-seq, scATAC-seq and scCUT&Tag atlases, gene activity score (GAS), chromatin silencing score (CSS), peak-to-gene links, pseudotime and GO enrichment.
- Reproducibility was high: Pearson correlations were r = 0.98 for ATAC and r = 0.98 for RNA in spatial ATAC–RNA-seq, and r = 0.96 for CUT&Tag (H3K27ac) and r = 0.89 for RNA in spatial CUT&Tag–RNA-seq.
Limitations
- The paper states that low RNA expression despite open chromatin may be due in part to sequencing depth and RNA detection sensitivity, and interprets some such cases as lineage priming.
- The method is near-single-cell, not single-cell: 50-μm pixels contained an average of 25 cells for E10 mouse embryo and 1–9 cells for human hippocampus, while 20-μm pixels contained 1–3 cells in juvenile mouse brain; when more than one cell type was present in a pixel, the major cell type was assigned.
- Evident from the text: the human analysis used one 31-year-old male hippocampus sample, limiting generalizability, and the epigenome–transcriptome relationships are largely correlative rather than causally tested.
Model-written summary. Check it against the paper before relying on it.
Integrity signals
Registry
Cites
Statistics
Figures
Verification
Claims the paper makes
70 Own result · 25 Not checked yet · 22 Own interpretation · 13 Own method · 4 No basis given · 1 Partly supported · accuracy not yet measured
The cited sources support only part of this claim — read each source’s verdict below.
In the paper
“which may indicate lineage priming10,27 of these genes in embryonic brain development.”
§ Spatial epigenome–transcriptome co-profiling of mammalian tissues > Spatial comapping of mouse embryo
What the sources say
- Partly supportedcites [10] Ma, S. et al. Chromatin potential identified by shared single-cell profiling of RNA and chromatin. Cell 183, 1103–1116 (2020). sourceExperimental — accuracy not yet measured
The Results section, “Lineage Priming at Enhancers Precedes Gene Expression in DORCs” (page unavailable), reports that chromatin accessibility can precede RNA expression and indicate lineage priming. Its examples concern hair follicle differentiation, not Pax6, Sox2, or Myt1l in embryonic brain development; it supports the proposed interpretation but not its application to those specific genes and setting. (LLM, conf=0.87)
- Partly supportedcites [27] Meijer, M. et al. Epigenomic priming of immune genes implicates oligodendroglia in multiple sclerosis susceptibility. Neuron 110, 1193–1210 (2022). sourceExperimental — accuracy not yet measured
The Discussion (page unavailable) describes chromatin priming as accessible immune-gene promoters with low or no expression, supporting the proposed interpretation of the accessibility–expression pattern. The paper studies immune genes in oligodendroglia, however, and does not establish lineage priming of Pax6, Sox2, or Myt1l during embryonic brain development. (LLM, conf=0.87)
hedgedconditional- Asserted: passes — The authors put it forward as true.
- Checkable: passes — It can be checked against evidence.
- Load-bearing: unclear — It is unclear whether the paper’s conclusions depend on it.
- Based: passes — The paper gives a reason why it holds.
- Partly supported
A result the paper reports from its own data — it cites no other source for it, so there is none to check. The quote shows it is in the paper.
In the paper
“Most 20-μm pixels contained one to three cells per pixel in juvenile mouse brain (Supplementary Fig. 1b).”
§ Spatial epigenome–transcriptome co-profiling of mammalian tissues > Technology workflow and data quality
plain- Asserted: passes — The authors put it forward as true.
- Checkable: passes — It can be checked against evidence.
- Load-bearing: unclear — It is unclear whether the paper’s conclusions depend on it.
- Based: passes — The paper gives a reason why it holds.
A result the paper reports from its own data — it cites no other source for it, so there is none to check. The quote shows it is in the paper.
In the paper
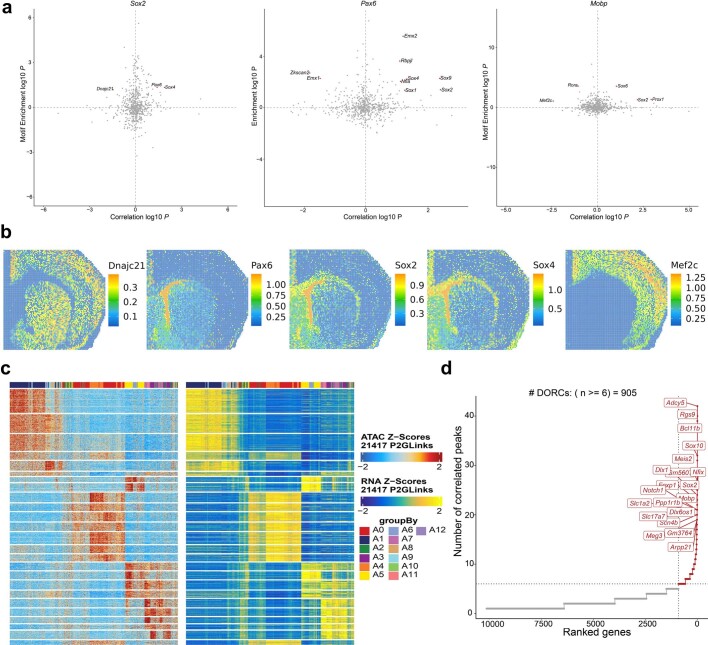
“We detected 21,417 significant peak-to-gene linkages between regulatory elements and target genes”
§ Spatial epigenome–transcriptome co-profiling of mammalian tissues > Spatial ATAC–RNA-seq of mouse brain
plaincorrelational- Asserted: passes — The authors put it forward as true.
- Checkable: passes — It can be checked against evidence.
- Load-bearing: passes — The paper’s conclusions depend on it.
- Based: passes — The paper gives a reason why it holds.
A result the paper reports from its own data — it cites no other source for it, so there is none to check. The quote shows it is in the paper.
In the paper
“The loss of chromatin accessibility at the Pax6 and radial glia marker Fabp7 loci preceded downregulation of the corresponding RNAs”
§ Spatial epigenome–transcriptome co-profiling of mammalian tissues > Spatial comapping of mouse embryo
plaincorrelational- Asserted: passes — The authors put it forward as true.
- Checkable: passes — It can be checked against evidence.
- Load-bearing: passes — The paper’s conclusions depend on it.
- Based: passes — The paper gives a reason why it holds.
In the paper
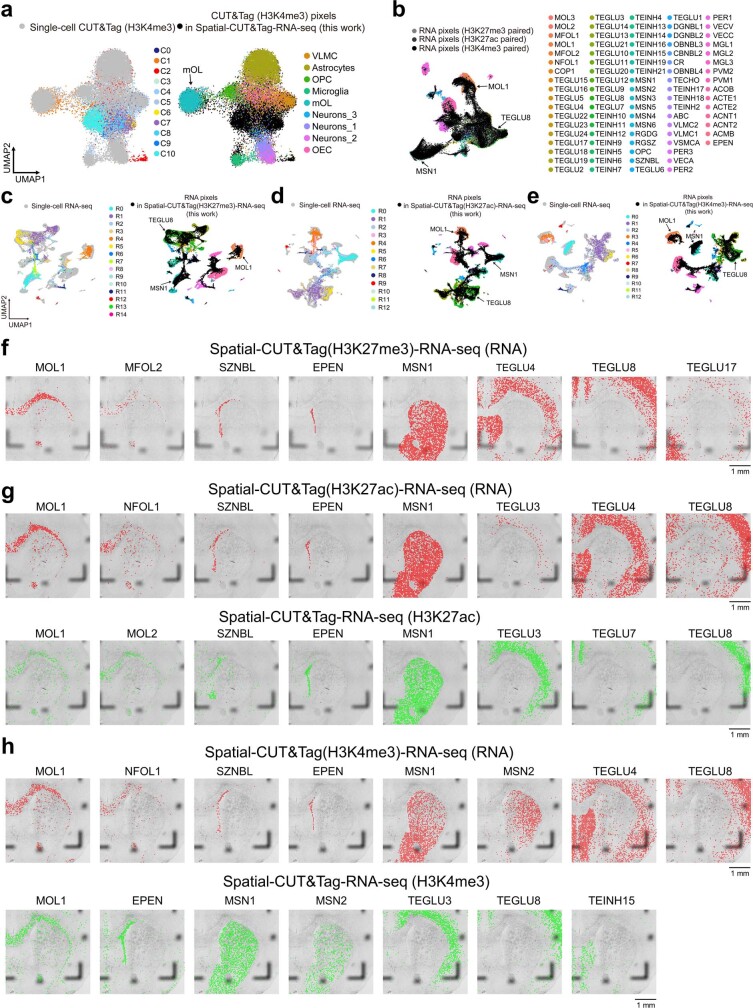
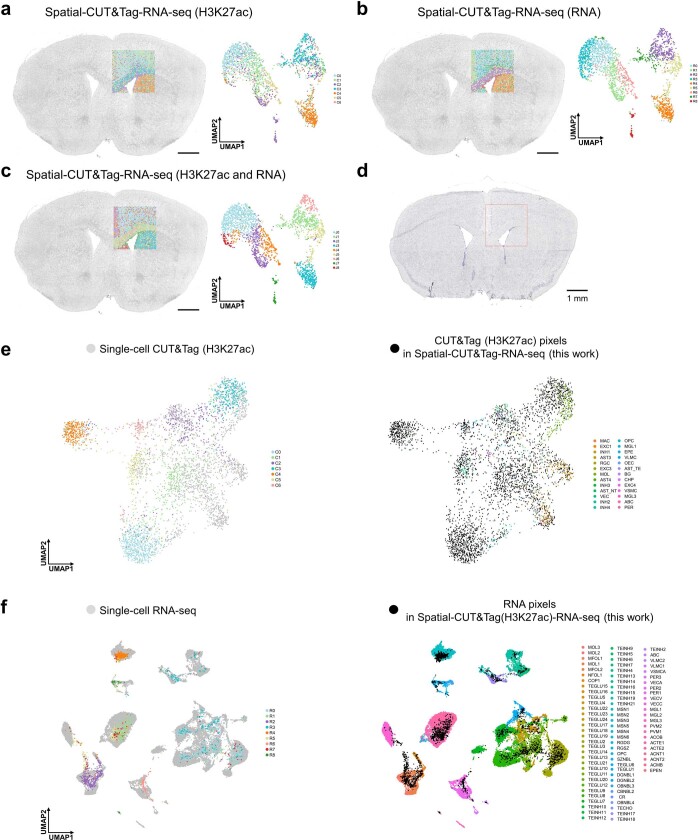
“These clusters agreed with the anatomical annotation by Nissl staining and showed good concordance between CUT&Tag and RNA in spatial patterns (Fig. 3a–c), which was further confirmed by Belayer34 analysis (Supplementary Fig. 7c).”
§ Spatial epigenome–transcriptome co-profiling of mammalian tissues > Spatial CUT&Tag–RNA-seq of mouse brain
What the sources say
- Not checked yetcites [34] Ma, C., Chitra, U., Zhang, S. & Raphael, B. J. Belayer: modeling discrete and continuous spatial variation in gene expression from spatially resolved transcriptomics. Cell Syst. 13, 786–797 (2022). source
plaincorrelationalSingle case- Asserted: passes — The authors put it forward as true.
- Checkable: passes — It can be checked against evidence.
- Load-bearing: passes — The paper’s conclusions depend on it.
- Based: passes — The paper gives a reason why it holds.
A result the paper reports from its own data — it cites no other source for it, so there is none to check. The quote shows it is in the paper.
In the paper
“These clusters agreed with the anatomical annotation by Nissl staining and showed good concordance between CUT&Tag and RNA in spatial patterns (Fig. 3a–c), which was further confirmed by Belayer34 analysis (Supplementary Fig. 7c).”
§ Spatial epigenome–transcriptome co-profiling of mammalian tissues > Spatial CUT&Tag–RNA-seq of mouse brain
plaincorrelationalSingle case- Asserted: passes — The authors put it forward as true.
- Checkable: passes — It can be checked against evidence.
- Load-bearing: passes — The paper’s conclusions depend on it.
- Based: passes — The paper gives a reason why it holds.
A result the paper reports from its own data — it cites no other source for it, so there is none to check. The quote shows it is in the paper.
In the paper
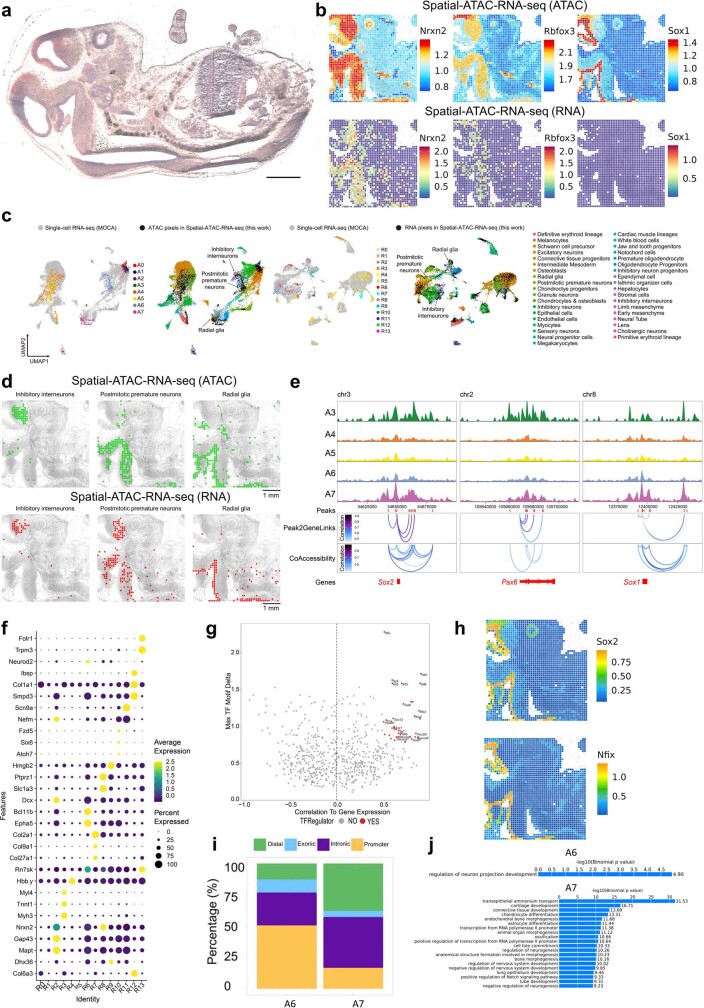
“Some marker genes (Pax6, Sox2 and Myt1l) were highly accessible in some regions of the embryonic brain but showed modest or low RNA expression”
§ Spatial epigenome–transcriptome co-profiling of mammalian tissues > Spatial comapping of mouse embryo
plaincorrelational- Asserted: passes — The authors put it forward as true.
- Checkable: passes — It can be checked against evidence.
- Load-bearing: passes — The paper’s conclusions depend on it.
- Based: passes — The paper gives a reason why it holds.
A result the paper reports from its own data — it cites no other source for it, so there is none to check. The quote shows it is in the paper.
In the paper
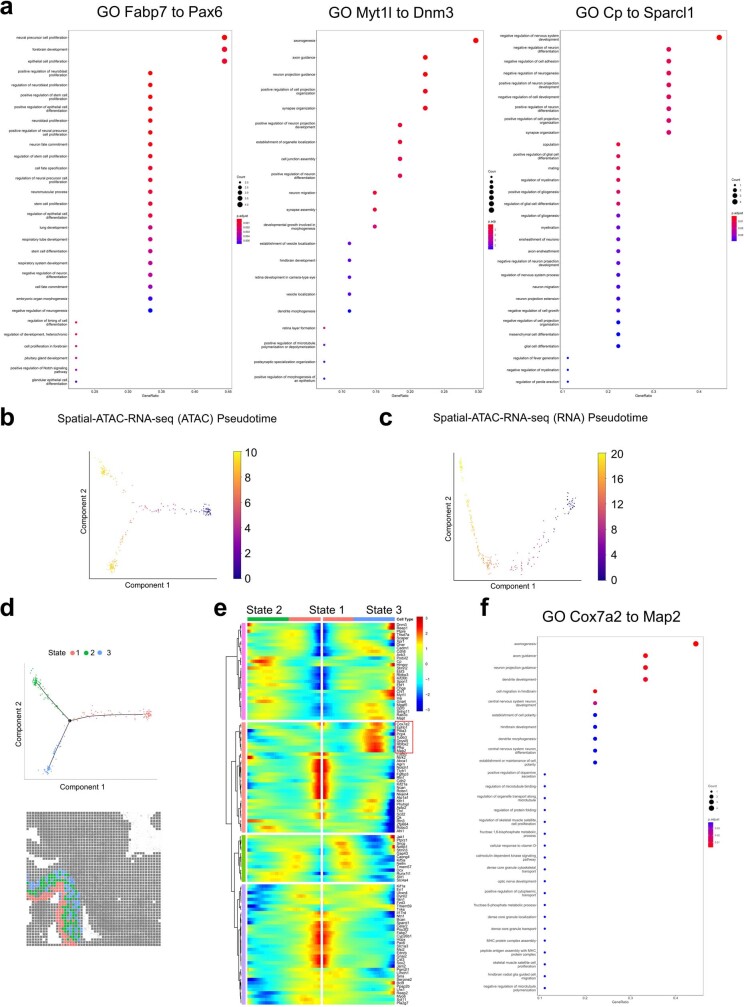
“Chromatin accessibility GAS and gene expression along this trajectory showed dynamic changes in selected marker genes”
§ Spatial epigenome–transcriptome co-profiling of mammalian tissues > Spatial comapping of mouse embryo
plaincorrelational- Asserted: passes — The authors put it forward as true.
- Checkable: passes — It can be checked against evidence.
- Load-bearing: passes — The paper’s conclusions depend on it.
- Based: passes — The paper gives a reason why it holds.
A result the paper reports from its own data — it cites no other source for it, so there is none to check. The quote shows it is in the paper.
In the paper
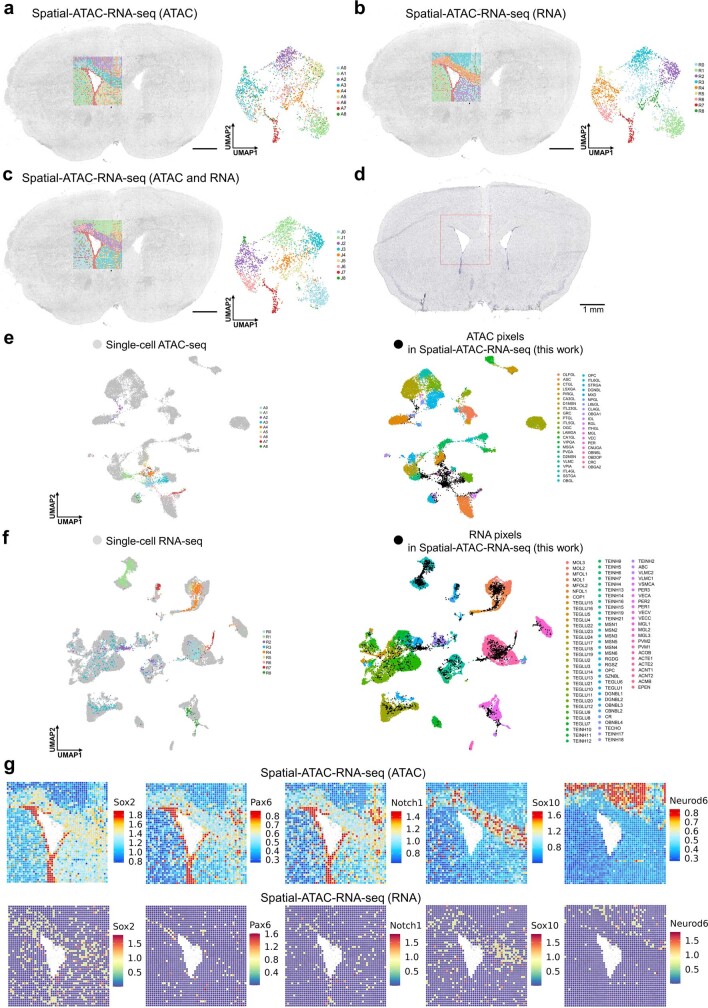
“we found a higher number of ATAC clusters (14) compared with RNA clusters (11)”
§ Spatial epigenome–transcriptome co-profiling of mammalian tissues > Spatial ATAC–RNA-seq of mouse brain
plaincorrelationalSingle case- Asserted: passes — The authors put it forward as true.
- Checkable: passes — It can be checked against evidence.
- Load-bearing: passes — The paper’s conclusions depend on it.
- Based: passes — The paper gives a reason why it holds.
A result the paper reports from its own data — it cites no other source for it, so there is none to check. The quote shows it is in the paper.
In the paper
“We observed a high degree of concordance in spatial cell type distribution as determined by ATAC versus RNA”
§ Spatial epigenome–transcriptome co-profiling of mammalian tissues > Spatial ATAC–RNA-seq of mouse brain
plaincorrelational- Asserted: passes — The authors put it forward as true.
- Checkable: passes — It can be checked against evidence.
- Load-bearing: passes — The paper’s conclusions depend on it.
- Based: passes — The paper gives a reason why it holds.
- Probably not a substantial claim. 13
- It may state two separate claims as one. 46
The paper states this without a source or data behind it here, so there is nothing to check it against. The quote shows it is in the paper.
In the paper
“Using a 100 × 100 barcode scheme, the mapping area covers nearly the entire hemisphere of a P22 mouse brain coronal section.”
§ Spatial epigenome–transcriptome co-profiling of mammalian tissues > Technology workflow and data quality
plainSingle case- Asserted: passes — The authors put it forward as true.
- Checkable: passes — It can be checked against evidence.
- Load-bearing: fails — The paper’s conclusions may not depend on it.
- Based: passes — The paper gives a reason why it holds.
Probably not a substantial claim. The paper’s conclusions may not depend on it.
A result the paper reports from its own data — it cites no other source for it, so there is none to check. The quote shows it is in the paper.
In the paper
“we obtained a median of 10,644 (H3K27me3), 10,002 (H3K27ac) and 2,507 (H3K4me3) unique fragments per pixel, of which 12% (H3K27me3), 17% (H3K27ac) and 67% (H3K4me3) overlapped with transcription start site regions and 12% (H3K27me3), 21% (H3K27ac) and 54% (H3K4me3) were located in peaks”
§ Spatial epigenome–transcriptome co-profiling of mammalian tissues > Technology workflow and data quality
plain- Asserted: passes — The authors put it forward as true.
- Checkable: passes — It can be checked against evidence.
- Load-bearing: passes — The paper’s conclusions depend on it.
- Based: passes — The paper gives a reason why it holds.
It may state two separate claims as one.
A result the paper reports from its own data — it cites no other source for it, so there is none to check. The quote shows it is in the paper.
In the paper
“For the RNA data, 25,881 (H3K27me3), 23,415 (H3K27ac) and 22,731 (H3K4me3) genes were detected with an average of 2,011 (H3K27me3), 1,513 (H3K27ac) and 1,329 (H3K4me3) genes per pixel (4,734 (H3K27me3), 3,580 (H3K27ac) and 2,885 (H3K4me3) UMIs per pixel, respectively”
§ Spatial epigenome–transcriptome co-profiling of mammalian tissues > Technology workflow and data quality
plain- Asserted: passes — The authors put it forward as true.
- Checkable: passes — It can be checked against evidence.
- Load-bearing: unclear — It is unclear whether the paper’s conclusions depend on it.
- Based: passes — The paper gives a reason why it holds.
It may state two separate claims as one.
A result the paper reports from its own data — it cites no other source for it, so there is none to check. The quote shows it is in the paper.
In the paper
“From this sample we obtained a median of 14,284 unique fragments per pixel, of which 19% were enriched in the transcription start site regions and 26% located in peaks”
§ Spatial epigenome–transcriptome co-profiling of mammalian tissues > Technology workflow and data quality
plainSingle case- Asserted: passes — The authors put it forward as true.
- Checkable: passes — It can be checked against evidence.
- Load-bearing: unclear — It is unclear whether the paper’s conclusions depend on it.
- Based: passes — The paper gives a reason why it holds.
It may state two separate claims as one.
None of the sources cited for this claim have been checked yet.
In the paper
“For the 50-μm pixel size we obtained an average of 25 cells for E10 mouse embryo1 and between one and nine cells for human hippocampus3.”
§ Spatial epigenome–transcriptome co-profiling of mammalian tissues > Technology workflow and data quality
What the sources say
- Not checked yetcites [1] Liu, Y. et al. High-spatial-resolution multi-omics sequencing via deterministic barcoding in yissue. Cell 183, 1665–1681 (2020). source
- Not checked yetcites [3] Deng, Y. et al. Spatial profiling of chromatin accessibility in mouse and human tissues. Nature 609, 375–383 (2022). source
plain- Asserted: passes — The authors put it forward as true.
- Checkable: passes — It can be checked against evidence.
- Load-bearing: unclear — It is unclear whether the paper’s conclusions depend on it.
- Based: passes — The paper gives a reason why it holds.
It may state two separate claims as one.
A result the paper reports from its own data — it cites no other source for it, so there is none to check. The quote shows it is in the paper.
In the paper
“Although highly concordant tissue features were identified by either spatial epigenome or spatial transcriptome we also observed distinct patterns”
§ Spatial epigenome–transcriptome co-profiling of mammalian tissues > Abstract
plaincorrelational- Asserted: passes — The authors put it forward as true.
- Checkable: passes — It can be checked against evidence.
- Load-bearing: passes — The paper’s conclusions depend on it.
- Based: passes — The paper gives a reason why it holds.
It may state two separate claims as one.
A result the paper reports from its own data — it cites no other source for it, so there is none to check. The quote shows it is in the paper.
In the paper
“For the RNA portion a total of 22,914 genes were detected, with an average of 1,073 genes and 2,358 unique molecular identifiers (UMIs) per pixel (spatial ATAC–RNA-seq)”
§ Spatial epigenome–transcriptome co-profiling of mammalian tissues > Technology workflow and data quality
plain- Asserted: passes — The authors put it forward as true.
- Checkable: passes — It can be checked against evidence.
- Load-bearing: unclear — It is unclear whether the paper’s conclusions depend on it.
- Based: passes — The paper gives a reason why it holds.
It may state two separate claims as one.
In the paper
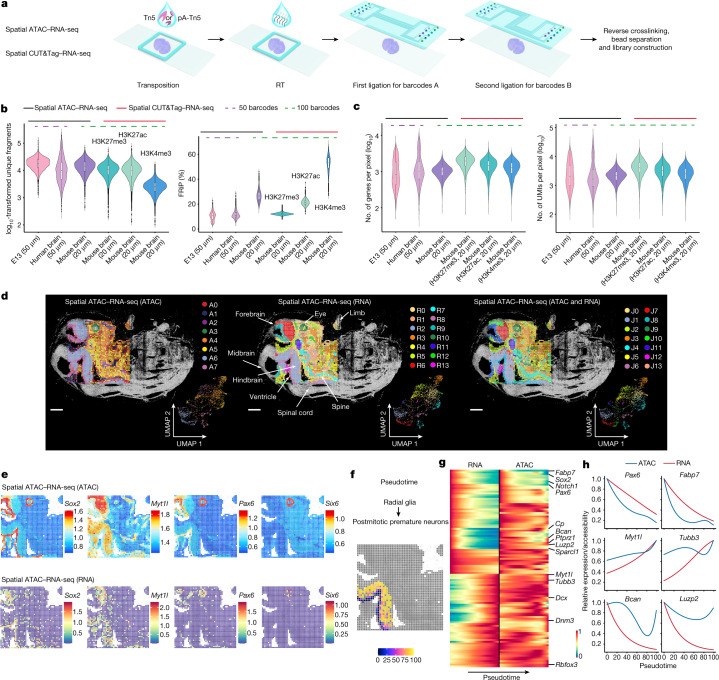
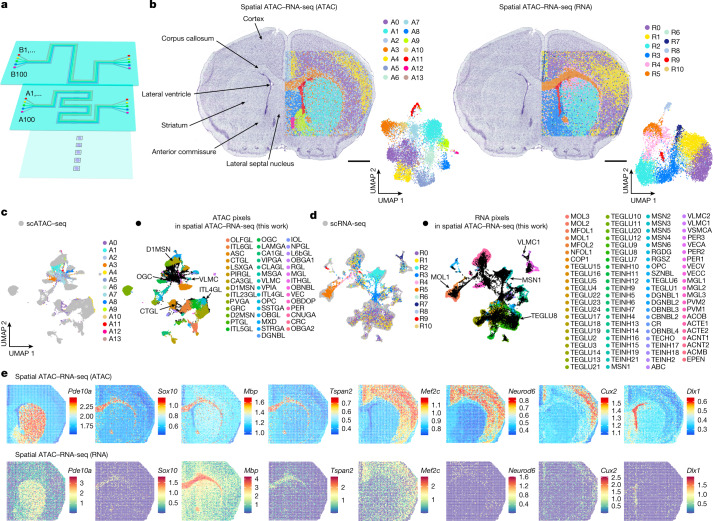
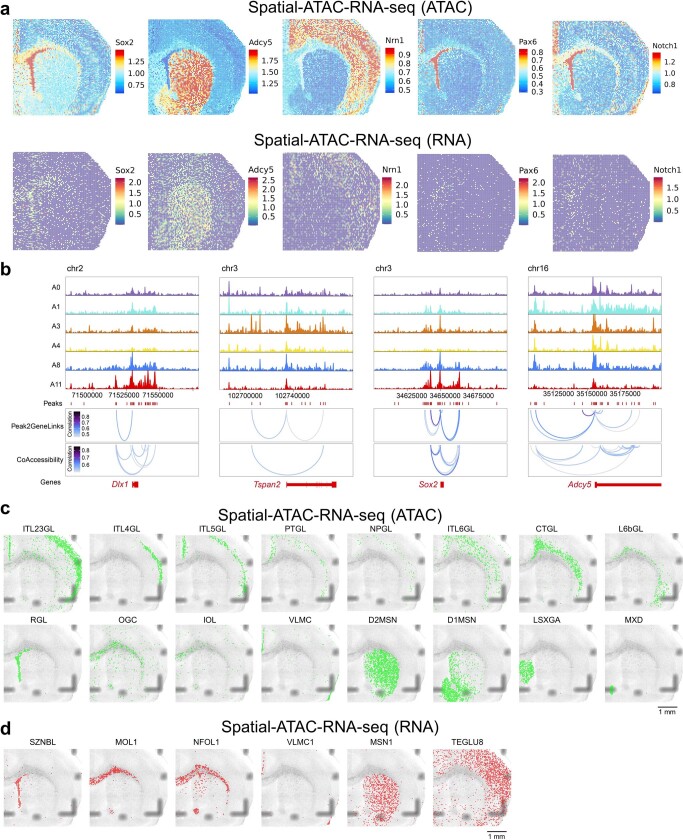
“we observed immature oligodendrocytes and oligodendrocytes in cluster A3 corresponding to corpus callosum. A thin layer of radial glia-like cells was found in the lateral ventricle, medium spiny neurons (D1MSN and D2MSN) in striatum and inhibitory neurons in the lateral septal nucleus30”
§ Spatial epigenome–transcriptome co-profiling of mammalian tissues > Spatial ATAC–RNA-seq of mouse brain
What the sources say
- Not checked yetcites [30] Li, Y. E. et al. An atlas of gene regulatory elements in adult mouse cerebrum. Nature 598, 129–136 (2021). source
plaincorrelational- Asserted: passes — The authors put it forward as true.
- Checkable: passes — It can be checked against evidence.
- Load-bearing: passes — The paper’s conclusions depend on it.
- Based: passes — The paper gives a reason why it holds.
It may state two separate claims as one.
A result the paper reports from its own data — it cites no other source for it, so there is none to check. The quote shows it is in the paper.
In the paper
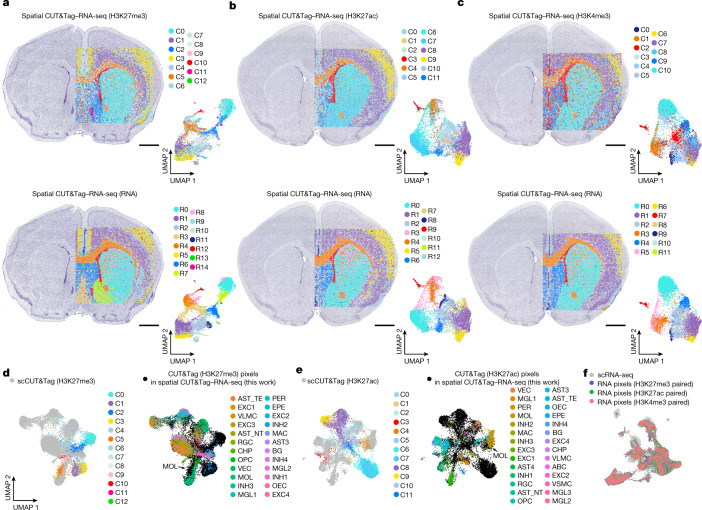
“We identified 13 and 15 specific clusters for H3K27me3 and RNA, 12 and 13 clusters for H3K27ac and RNA and 11 and 12 clusters for H3K4me3 and RNA, respectively (Fig. 3a–c).”
§ Spatial epigenome–transcriptome co-profiling of mammalian tissues > Spatial CUT&Tag–RNA-seq of mouse brain
plainSingle case- Asserted: passes — The authors put it forward as true.
- Checkable: passes — It can be checked against evidence.
- Load-bearing: passes — The paper’s conclusions depend on it.
- Based: passes — The paper gives a reason why it holds.
It may state two separate claims as one.
A result the paper reports from its own data — it cites no other source for it, so there is none to check. The quote shows it is in the paper.
In the paper
“Monocle2 pseudotime analysis showed a bifurcation in chromatin accessibility but not in RNA expression; one path led to regions close to the ventricular zone (green pixels, Extended Data Fig. 3d,e) and the other terminated in regions distal to the ventricular zone (blue pixels).”
§ Spatial epigenome–transcriptome co-profiling of mammalian tissues > Spatial comapping of mouse embryo
plaindirect- Asserted: passes — The authors put it forward as true.
- Checkable: passes — It can be checked against evidence.
- Load-bearing: passes — The paper’s conclusions depend on it.
- Based: passes — The paper gives a reason why it holds.
It may state two separate claims as one.
A result the paper reports from its own data — it cites no other source for it, so there is none to check. The quote shows it is in the paper.
In the paper
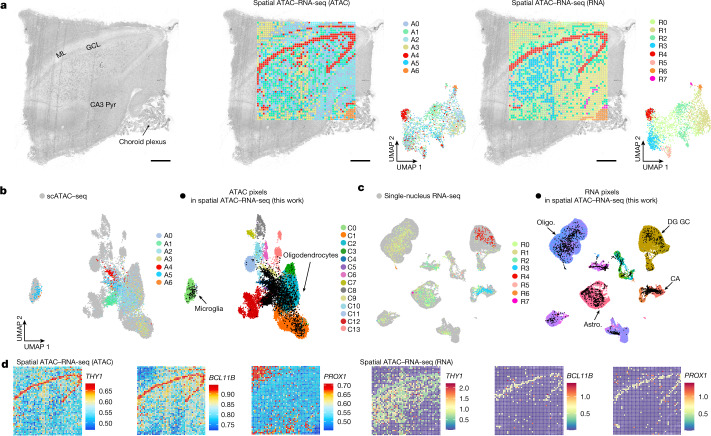
“Chromatin accessibility of marker genes identified major regions such as striatum (Pde10a and Adcy5, markers of medium spiny neurons, cluster A1), corpus callosum (Sox10, Mbp and Tspan2, markers of oligodendroglia, cluster A3), cortex (Mef2c, Neurod6 and Nrn1, clusters A0 and A4, markers of excitatory neurons; Cux2, cluster A4) and lateral ventricle (Dlx1, Pax6, Notch1 and Sox2, markers of ependym”
§ Spatial epigenome–transcriptome co-profiling of mammalian tissues > Spatial ATAC–RNA-seq of mouse brain
plaincorrelational- Asserted: passes — The authors put it forward as true.
- Checkable: passes — It can be checked against evidence.
- Load-bearing: passes — The paper’s conclusions depend on it.
- Based: passes — The paper gives a reason why it holds.
It may state two separate claims as one.
A result the paper reports from its own data — it cites no other source for it, so there is none to check. The quote shows it is in the paper.
In the paper
“Spatial ATAC–RNA-seq on E13 mouse embryo identified eight major ATAC clusters and 14 RNA clusters”
§ Spatial epigenome–transcriptome co-profiling of mammalian tissues > Spatial comapping of mouse embryo
plainSingle case- Asserted: passes — The authors put it forward as true.
- Checkable: passes — It can be checked against evidence.
- Load-bearing: passes — The paper’s conclusions depend on it.
- Based: passes — The paper gives a reason why it holds.
It may state two separate claims as one.
A result the paper reports from its own data — it cites no other source for it, so there is none to check. The quote shows it is in the paper.
In the paper
“genes involved in neuronal identity, axonogenesis and synapse organization (GO Myt1l to Dnm3 in Extended Data Fig. 3a), such as Dcx and Tubb3, showed increased expression in spatial pseudotime but chromatin accessibility at their loci was already elevated at earlier stages”
§ Spatial epigenome–transcriptome co-profiling of mammalian tissues > Spatial comapping of mouse embryo
plaincorrelational- Asserted: passes — The authors put it forward as true.
- Checkable: passes — It can be checked against evidence.
- Load-bearing: passes — The paper’s conclusions depend on it.
- Based: passes — The paper gives a reason why it holds.
It may state two separate claims as one.
A result the paper reports from its own data — it cites no other source for it, so there is none to check. The quote shows it is in the paper.
In the paper
“radial glia (neural stem/progenitor cells) were observed predominantly in the ventricular layer, and differentiated cell types such as postmitotic premature neurons and inhibitory interneurons were enriched in those regions distant from the ventricular layer”
§ Spatial epigenome–transcriptome co-profiling of mammalian tissues > Spatial comapping of mouse embryo
plaincorrelational- Asserted: passes — The authors put it forward as true.
- Checkable: passes — It can be checked against evidence.
- Load-bearing: unclear — It is unclear whether the paper’s conclusions depend on it.
- Based: passes — The paper gives a reason why it holds.
It may state two separate claims as one.
A result the paper reports from its own data — it cites no other source for it, so there is none to check. The quote shows it is in the paper.
In the paper
“Spatial RNA clusters also showed region-specific gene expression such as striatum (Pde10a, cluster R2, medium spiny neurons), corpus callosum (Mbp and Tspan2, cluster R5, oligodendroglia) and cortex (Mef2c, clusters R0 and R1, excitatory neurons)”
§ Spatial epigenome–transcriptome co-profiling of mammalian tissues > Spatial ATAC–RNA-seq of mouse brain
plaincorrelational- Asserted: passes — The authors put it forward as true.
- Checkable: passes — It can be checked against evidence.
- Load-bearing: passes — The paper’s conclusions depend on it.
- Based: passes — The paper gives a reason why it holds.
It may state two separate claims as one.
A result the paper reports from its own data — it cites no other source for it, so there is none to check. The quote shows it is in the paper.
In the paper
“Satb2 showed the highest activity in clusters C8 and C9 (H3K27ac) and C6 and C7 (H3K4me3), but the lowest CSS in clusters C1 and C3 (H3K27me3) in the cortical layer.”
§ Spatial epigenome–transcriptome co-profiling of mammalian tissues > Spatial CUT&Tag–RNA-seq of mouse brain
plaincorrelational- Asserted: passes — The authors put it forward as true.
- Checkable: passes — It can be checked against evidence.
- Load-bearing: unclear — It is unclear whether the paper’s conclusions depend on it.
- Based: passes — The paper gives a reason why it holds.
It may state two separate claims as one.
A result the paper reports from its own data — it cites no other source for it, so there is none to check. The quote shows it is in the paper.
In the paper
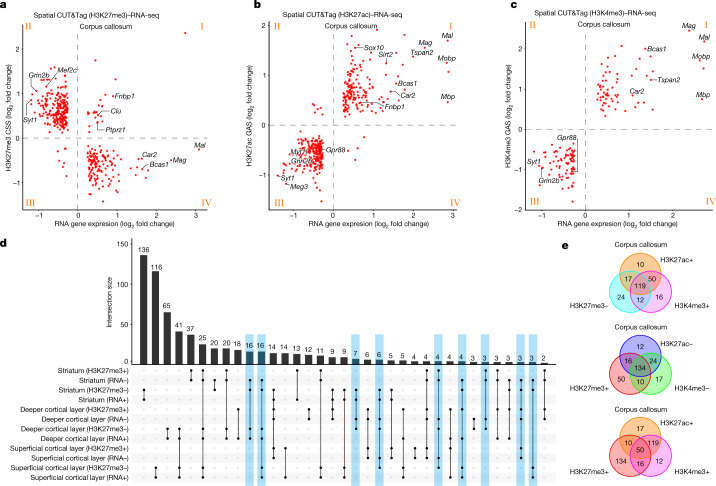
“For instance, in the superficial cortical layer, genes for GABAergic regulation of synaptic transmission were enriched in H3K27me3 whereas glutamatergic synapse transmission genes had high expression and low H3K27me3 (Supplementary Figs. 9b, 10b and 11b; GOs for striatum, superficial and deeper cortical layers).”
§ Spatial epigenome–transcriptome co-profiling of mammalian tissues > Region-specific gene expression regulation
plaincorrelational- Asserted: passes — The authors put it forward as true.
- Checkable: passes — It can be checked against evidence.
- Load-bearing: passes — The paper’s conclusions depend on it.
- Based: passes — The paper gives a reason why it holds.
It may state two separate claims as one.
A result the paper reports from its own data — it cites no other source for it, so there is none to check. The quote shows it is in the paper.
In the paper
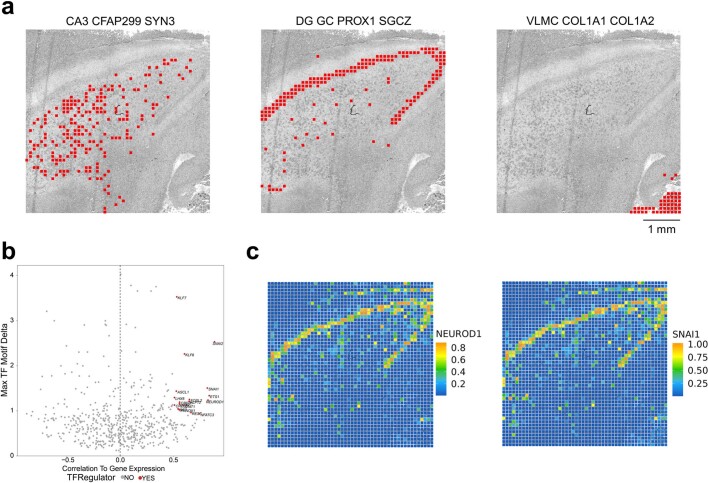
“TF motifs (NEUROD1 and SNAI1) and their spatial patterns were visualized in different tissue regions, and positive TF regulators were identified (Extended Data Fig. 10b,c).”
§ Spatial epigenome–transcriptome co-profiling of mammalian tissues > Spatial comapping of human brain
plaincorrelationalSingle case- Asserted: passes — The authors put it forward as true.
- Checkable: passes — It can be checked against evidence.
- Load-bearing: unclear — It is unclear whether the paper’s conclusions depend on it.
- Based: passes — The paper gives a reason why it holds.
It may state two separate claims as one.
A result the paper reports from its own data — it cites no other source for it, so there is none to check. The quote shows it is in the paper.
In the paper
“These techniques were applied to comapping of embryonic and juvenile mouse brain, as well as adult human brain.”
§ Spatial epigenome–transcriptome co-profiling of mammalian tissues > Discussion
plain- Asserted: passes — The authors put it forward as true.
- Checkable: passes — It can be checked against evidence.
- Load-bearing: passes — The paper’s conclusions depend on it.
- Based: passes — The paper gives a reason why it holds.
It may state two separate claims as one.
A result the paper reports from its own data — it cites no other source for it, so there is none to check. The quote shows it is in the paper.
In the paper
“We identified seven and eight major clusters for ATAC and RNA, respectively, and the spatial pattern agreed with major anatomical landmarks (Fig. 5a)3, including specific marker genes (Fig. 5d).”
§ Spatial epigenome–transcriptome co-profiling of mammalian tissues > Spatial comapping of human brain
plaincorrelationalSingle case- Asserted: passes — The authors put it forward as true.
- Checkable: passes — It can be checked against evidence.
- Load-bearing: passes — The paper’s conclusions depend on it.
- Based: passes — The paper gives a reason why it holds.
It may state two separate claims as one.
A result the paper reports from its own data — it cites no other source for it, so there is none to check. The quote shows it is in the paper.
In the paper
“For example, PROX1, a signature gene defining granule neuron identity during pyramidal neuron fate selection44, is indeed highly expressed in GCL but showed modest chromatin accessibility (Fig. 5d).”
§ Spatial epigenome–transcriptome co-profiling of mammalian tissues > Spatial comapping of human brain
plaincorrelational- Asserted: passes — The authors put it forward as true.
- Checkable: passes — It can be checked against evidence.
- Load-bearing: unclear — It is unclear whether the paper’s conclusions depend on it.
- Based: passes — The paper gives a reason why it holds.
It may state two separate claims as one.
A result the paper reports from its own data — it cites no other source for it, so there is none to check. The quote shows it is in the paper.
In the paper
“The ATAC cluster A4 represents the granule cell layer (GCL) (THY1, BCL11B) and cluster A6 corresponds to the choroid plexus (Fig. 5a,d).”
§ Spatial epigenome–transcriptome co-profiling of mammalian tissues > Spatial comapping of human brain
plaincorrelationalSingle case- Asserted: passes — The authors put it forward as true.
- Checkable: passes — It can be checked against evidence.
- Load-bearing: passes — The paper’s conclusions depend on it.
- Based: passes — The paper gives a reason why it holds.
It may state two separate claims as one.
A result the paper reports from its own data — it cites no other source for it, so there is none to check. The quote shows it is in the paper.
In the paper
“Tspan2 was enriched in cluster C4 (H3K27ac) and cluster C1 (H3K4me3) but depleted in cluster C5 (H3K27me3) in corpus callosum, associated with oligodendrocyte lineage development (Supplementary Fig. 6).”
§ Spatial epigenome–transcriptome co-profiling of mammalian tissues > Spatial CUT&Tag–RNA-seq of mouse brain
plaincorrelational- Asserted: passes — The authors put it forward as true.
- Checkable: passes — It can be checked against evidence.
- Load-bearing: unclear — It is unclear whether the paper’s conclusions depend on it.
- Based: passes — The paper gives a reason why it holds.
It may state two separate claims as one.
A result the paper reports from its own data — it cites no other source for it, so there is none to check. The quote shows it is in the paper.
In the paper
“These genes are involved in oligodendrocyte differentiation and myelination and other processes such as protein catabolism and localization (Supplementary Figs. 13 and 14).”
§ Spatial epigenome–transcriptome co-profiling of mammalian tissues > Region-specific gene expression regulation
plaincorrelational- Asserted: passes — The authors put it forward as true.
- Checkable: passes — It can be checked against evidence.
- Load-bearing: unclear — It is unclear whether the paper’s conclusions depend on it.
- Based: passes — The paper gives a reason why it holds.
It may state two separate claims as one.
A result the paper reports from its own data — it cites no other source for it, so there is none to check. The quote shows it is in the paper.
In the paper
“Gpr88, a marker gene of MSN, was enriched in striatum for ATAC, H3K27ac and H3K4me3 but with low CSS in striatum for H3K27me3 (Extended Data Fig. 9f).”
§ Spatial epigenome–transcriptome co-profiling of mammalian tissues > Region-specific gene expression regulation
plaincorrelational- Asserted: passes — The authors put it forward as true.
- Checkable: passes — It can be checked against evidence.
- Load-bearing: unclear — It is unclear whether the paper’s conclusions depend on it.
- Based: passes — The paper gives a reason why it holds.
It may state two separate claims as one.
A result the paper reports from its own data — it cites no other source for it, so there is none to check. The quote shows it is in the paper.
In the paper
“For example, we observed an enrichment of MOL within the corpus callosum, a thin layer of ependymal cells in the lateral ventricle, excitatory neurons in cerebral cortex and MSN in the striatum.”
§ Spatial epigenome–transcriptome co-profiling of mammalian tissues > Spatial CUT&Tag–RNA-seq of mouse brain
plaincorrelational- Asserted: passes — The authors put it forward as true.
- Checkable: passes — It can be checked against evidence.
- Load-bearing: unclear — It is unclear whether the paper’s conclusions depend on it.
- Based: passes — The paper gives a reason why it holds.
It may state two separate claims as one.
The paper states this without a source or data behind it here, so there is nothing to check it against. The quote shows it is in the paper.
In the paper
“We have demonstrated either ATAC or CUT&Tag in conjunction with RNA for spatial multiomics mapping.”
§ Spatial epigenome–transcriptome co-profiling of mammalian tissues > Discussion
boostedcorrelational- Asserted: passes — The authors put it forward as true.
- Checkable: passes — It can be checked against evidence.
- Load-bearing: passes — The paper’s conclusions depend on it.
- Based: passes — The paper gives a reason why it holds.
It may state two separate claims as one.
A result the paper reports from its own data — it cites no other source for it, so there is none to check. The quote shows it is in the paper.
In the paper
“In general H3K4me3 and H3K27ac showed high correlations, with their signals anticorrelated with H3K27me3 (Fig. 4e).”
§ Spatial epigenome–transcriptome co-profiling of mammalian tissues > Region-specific gene expression regulation
plaincorrelational- Asserted: passes — The authors put it forward as true.
- Checkable: passes — It can be checked against evidence.
- Load-bearing: unclear — It is unclear whether the paper’s conclusions depend on it.
- Based: passes — The paper gives a reason why it holds.
It may state two separate claims as one.
A result the paper reports from its own data — it cites no other source for it, so there is none to check. The quote shows it is in the paper.
In the paper
“Granule cells (GC) were detected in the GCL, cornu ammonis (CA) neurons were enriched in CA3–4 regions and VLMC were strongly distinguished in choroid plexus as opposed to other regions.”
§ Spatial epigenome–transcriptome co-profiling of mammalian tissues > Spatial comapping of human brain
boostedcorrelational- Asserted: passes — The authors put it forward as true.
- Checkable: passes — It can be checked against evidence.
- Load-bearing: passes — The paper’s conclusions depend on it.
- Based: passes — The paper gives a reason why it holds.
It may state two separate claims as one.
The paper states this without a source or data behind it here, so there is nothing to check it against. The quote shows it is in the paper.
In the paper
“Spatial epigenome–transcriptome cosequencing yielded two layers of spatial omics information directly in tissue, with data quality similar to that previously obtained by single modalities.”
§ Spatial epigenome–transcriptome co-profiling of mammalian tissues > Discussion
plain- Asserted: passes — The authors put it forward as true.
- Checkable: passes — It can be checked against evidence.
- Load-bearing: passes — The paper’s conclusions depend on it.
- Based: passes — The paper gives a reason why it holds.
It may state two separate claims as one.
A result the paper reports from its own data — it cites no other source for it, so there is none to check. The quote shows it is in the paper.
In the paper
“Clustering of CSS or GAS based on different modifications resolved all major tissue regions (Fig. 3a–c and Supplementary Fig. 6) and identified region-specific marker gene modifications.”
§ Spatial epigenome–transcriptome co-profiling of mammalian tissues > Spatial CUT&Tag–RNA-seq of mouse brain
plaindirect- Asserted: passes — The authors put it forward as true.
- Checkable: passes — It can be checked against evidence.
- Load-bearing: passes — The paper’s conclusions depend on it.
- Based: passes — The paper gives a reason why it holds.
It may state two separate claims as one.
A result the paper reports from its own data — it cites no other source for it, so there is none to check. The quote shows it is in the paper.
In the paper
“In contrast to H3K27me3, we observed a robust correlation between RNA and activating marks H3K4me3 or H3K27ac in the corpus callosum, with genes highly expressed and with high deposition in these two modalities regulating processes in oligodendroglia (Fig. 4b,c and Supplementary Fig. 12; GO for H3K27ac quadrant I and H3K4me3 quadrant I).”
§ Spatial epigenome–transcriptome co-profiling of mammalian tissues > Region-specific gene expression regulation
plaincorrelational- Asserted: passes — The authors put it forward as true.
- Checkable: passes — It can be checked against evidence.
- Load-bearing: passes — The paper’s conclusions depend on it.
- Based: passes — The paper gives a reason why it holds.
It may state two separate claims as one.
The paper states this without a source or data behind it here, so there is nothing to check it against. The quote shows it is in the paper.
In the paper
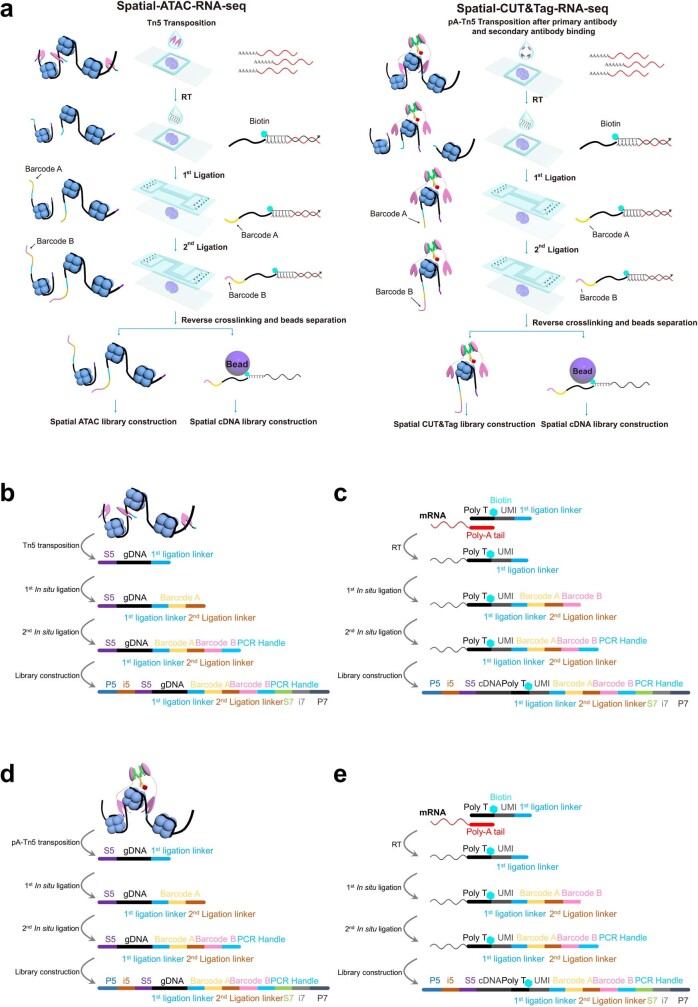
“The serpentine channel design allows simultaneous processing of five tissue samples, each mapped for 10,000 pixels.”
§ Spatial epigenome–transcriptome co-profiling of mammalian tissues > Discussion
plaindirectn = 5- Asserted: passes — The authors put it forward as true.
- Checkable: passes — It can be checked against evidence.
- Load-bearing: unclear — It is unclear whether the paper’s conclusions depend on it.
- Based: passes — The paper gives a reason why it holds.
It may state two separate claims as one.
None of the sources cited for this claim have been checked yet.
In the paper
“However, current methods capture only one layer of omics information at a time, precluding the possibility of examining the mechanistic relationship across the central dogma of molecular biology.”
§ Spatial epigenome–transcriptome co-profiling of mammalian tissues > Abstract
What the sources say
- Not checked yetcites [1] Liu, Y. et al. High-spatial-resolution multi-omics sequencing via deterministic barcoding in yissue. Cell 183, 1665–1681 (2020). source
- Not checked yetcites [2] Deng, Y. et al. Spatial-CUT&Tag: spatially resolved chromatin modification profiling at the cellular level. Science 375, 681–686 (2022). source
- Not checked yetcites [3] Deng, Y. et al. Spatial profiling of chromatin accessibility in mouse and human tissues. Nature 609, 375–383 (2022). source
- Not checked yetcites [4] Chen, A. et al. Spatiotemporal transcriptomic atlas of mouse organogenesis using DNA nanoball-patterned arrays. Cell 185, 1777–1792 (2022). source
- Not checked yetcites [5] Lu, T., Ang, C. E. & Zhuang, X. Spatially resolved epigenomic profiling of single cells in complex tissues. Cell 185, 4448–4464 (2022). source
plaindirect- Asserted: passes — The authors put it forward as true.
- Checkable: passes — It can be checked against evidence.
- Load-bearing: passes — The paper’s conclusions depend on it.
- Based: passes — The paper gives a reason why it holds.
It may state two separate claims as one.
None of the sources cited for this claim have been checked yet.
In the paper
“Single-cell multiomics allows uncovering of the mechanisms of gene regulation across different omics layers6–9 but lacks spatial information, which is crucial to understanding cellular function in tissue.”
§ Spatial epigenome–transcriptome co-profiling of mammalian tissues > Main
What the sources say
- Not checked yetcites [6] Allaway, K. C. et al. Genetic and epigenetic coordination of cortical interneuron development. Nature 597, 693–697 (2021). source
- Not checked yetcites [7] Chen, S., Lake, B. B. & Zhang, K. High-throughput sequencing of the transcriptome and chromatin accessibility in the same cell. Nat. Biotechnol. 37, 1452–1457 (2019). source
- Not checked yetcites [8] Cao, J. et al. Joint profiling of chromatin accessibility and gene expression in thousands of single cells. Science 361, 1380–1385 (2018). source
- Not checked yetcites [9] Trevino, A. E. et al. Chromatin and gene-regulatory dynamics of the developing human cerebral cortex at single-cell resolution. Cell 184, 5053–5069 (2021). source
plain- Asserted: passes — The authors put it forward as true.
- Checkable: passes — It can be checked against evidence.
- Load-bearing: passes — The paper’s conclusions depend on it.
- Based: passes — The paper gives a reason why it holds.
It may state two separate claims as one.
None of the sources cited for this claim have been checked yet.
In the paper
“we developed spatially resolved, genome-wide comapping of the epigenome and transcriptome by simultaneous profiling of chromatin accessibility and messenger RNA expression (spatial assay for transposase-accessible chromatin and RNA using sequencing (spatial ATAC–RNA-seq)), or histone modifications and mRNA expression”
§ Spatial epigenome–transcriptome co-profiling of mammalian tissues > Main
What the sources say
- Not checked yetcites [3] Deng, Y. et al. Spatial profiling of chromatin accessibility in mouse and human tissues. Nature 609, 375–383 (2022). source
- Not checked yetcites [2] Deng, Y. et al. Spatial-CUT&Tag: spatially resolved chromatin modification profiling at the cellular level. Science 375, 681–686 (2022). source
plain- Asserted: passes — The authors put it forward as true.
- Checkable: passes — It can be checked against evidence.
- Load-bearing: passes — The paper’s conclusions depend on it.
- Based: passes — The paper gives a reason why it holds.
It may state two separate claims as one.
In the paper
“Although computational methods can integrate data from multiple omics10, they cannot readily uncover the mechanistic links between different omics layers.”
§ Spatial epigenome–transcriptome co-profiling of mammalian tissues > Main
What the sources say
- Not checked yetcites [10] Ma, S. et al. Chromatin potential identified by shared single-cell profiling of RNA and chromatin. Cell 183, 1103–1116 (2020). source
plain- Asserted: passes — The authors put it forward as true.
- Checkable: passes — It can be checked against evidence.
- Load-bearing: passes — The paper’s conclusions depend on it.
- Based: passes — The paper gives a reason why it holds.
It may state two separate claims as one.
None of the sources cited for this claim have been checked yet.
In the paper
“Previously we developed deterministic barcoding in tissue for spatial omics sequencing for spatially resolved comeasurement of the transcriptome and a panel of proteins1, and recently it was also realized in the 10X Visium platform11.”
§ Spatial epigenome–transcriptome co-profiling of mammalian tissues > Main
What the sources say
- Not checked yetcites [1] Liu, Y. et al. High-spatial-resolution multi-omics sequencing via deterministic barcoding in yissue. Cell 183, 1665–1681 (2020). source
- Not checked yetcites [11] Ben-Chetrit, N. et al. Integration of whole transcriptome spatial profiling with protein markers. Nat. Biotechnol. https://doi.org/10.1038/s41587-022-01536-3 (2023). source
plain- Asserted: passes — The authors put it forward as true.
- Checkable: passes — It can be checked against evidence.
- Load-bearing: fails — The paper’s conclusions may not depend on it.
- Based: passes — The paper gives a reason why it holds.
Probably not a substantial claim. The paper’s conclusions may not depend on it. It may state two separate claims as one.
None of the sources cited for this claim have been checked yet.
In the paper
“Spatial epigenomics, transcriptomics and proteomics emerged recently1–5 but most of these can capture only one layer of the omics information.”
§ Spatial epigenome–transcriptome co-profiling of mammalian tissues > Main
What the sources say
- Not checked yetcites [1] Liu, Y. et al. High-spatial-resolution multi-omics sequencing via deterministic barcoding in yissue. Cell 183, 1665–1681 (2020). source
- Not checked yetcites [2] Deng, Y. et al. Spatial-CUT&Tag: spatially resolved chromatin modification profiling at the cellular level. Science 375, 681–686 (2022). source
- Not checked yetcites [3] Deng, Y. et al. Spatial profiling of chromatin accessibility in mouse and human tissues. Nature 609, 375–383 (2022). source
- Not checked yetcites [4] Chen, A. et al. Spatiotemporal transcriptomic atlas of mouse organogenesis using DNA nanoball-patterned arrays. Cell 185, 1777–1792 (2022). source
- Not checked yetcites [5] Lu, T., Ang, C. E. & Zhuang, X. Spatially resolved epigenomic profiling of single cells in complex tissues. Cell 185, 4448–4464 (2022). source
plain- Asserted: passes — The authors put it forward as true.
- Checkable: passes — It can be checked against evidence.
- Load-bearing: passes — The paper’s conclusions depend on it.
- Based: passes — The paper gives a reason why it holds.
It may state two separate claims as one.
In the paper
“Integration of single-cell ATAC-seq mouse brain atlas data30 with spatial ATAC-seq data facilitated identification of all major cell types, and label transfer was then used to assign cell types to spatial locations where the epigenetic state may control specific cell type formation”
§ Spatial epigenome–transcriptome co-profiling of mammalian tissues > Spatial ATAC–RNA-seq of mouse brain
What the sources say
- Not checked yetcites [30] Li, Y. E. et al. An atlas of gene regulatory elements in adult mouse cerebrum. Nature 598, 129–136 (2021). source
hedgedconditional- Asserted: passes — The authors put it forward as true.
- Checkable: passes — It can be checked against evidence.
- Load-bearing: passes — The paper’s conclusions depend on it.
- Based: passes — The paper gives a reason why it holds.
It may state two separate claims as one.
What the paper did — it cites no source for this, so there is none to check. The quote shows it is in the paper.
In the paper
“We developed a microchip with 100 serpentine microchannels to barcode 100 × 100 or, in total, 10,000 pixels per tissue section and up to five samples per chip”
§ Spatial epigenome–transcriptome co-profiling of mammalian tissues > Spatial ATAC–RNA-seq of mouse brain
plainn = 5- Asserted: passes — The authors put it forward as true.
- Checkable: passes — It can be checked against evidence.
- Load-bearing: passes — The paper’s conclusions depend on it.
- Based: passes — The paper gives a reason why it holds.
It may state two separate claims as one.
A conclusion the paper draws from its own results — it cites no other source for it, so there is none to check. The quote shows it is in the paper.
In the paper
“Thus, our spatial ATAC–RNA-seq can be used to decipher the gene regulation mechanism and spatiotemporal dynamics during tissue development.”
§ Spatial epigenome–transcriptome co-profiling of mammalian tissues > Spatial comapping of mouse embryo
plaincorrelationalSingle case- Asserted: passes — The authors put it forward as true.
- Checkable: passes — It can be checked against evidence.
- Load-bearing: passes — The paper’s conclusions depend on it.
- Based: passes — The paper gives a reason why it holds.
It may state two separate claims as one.
What the paper did — it cites no source for this, so there is none to check. The quote shows it is in the paper.
In the paper
“Correlation analysis between replicates showed high reproducibility (r = 0.98 for ATAC, r = 0.98 for RNA in spatial ATAC–RNA-seq, r = 0.96 for CUT&Tag (H3K27ac), r = 0.89 for RNA in spatial CUT&Tag–RNA-seq”
§ Spatial epigenome–transcriptome co-profiling of mammalian tissues > Technology workflow and data quality
plaincorrelational- Asserted: passes — The authors put it forward as true.
- Checkable: passes — It can be checked against evidence.
- Load-bearing: passes — The paper’s conclusions depend on it.
- Based: passes — The paper gives a reason why it holds.
It may state two separate claims as one.
A conclusion the paper draws from its own results — it cites no other source for it, so there is none to check. The quote shows it is in the paper.
In the paper
“As mentioned above, this potential H3K4me3/H3K27me3 bivalency may reflect transcriptional poising.”
§ Spatial epigenome–transcriptome co-profiling of mammalian tissues > Region-specific gene expression regulation
hedgedconditional- Asserted: passes — The authors put it forward as true.
- Checkable: passes — It can be checked against evidence.
- Load-bearing: fails — The paper’s conclusions may not depend on it.
- Based: passes — The paper gives a reason why it holds.
Probably not a substantial claim. The paper’s conclusions may not depend on it.
A conclusion the paper draws from its own results — it cites no other source for it, so there is none to check. The quote shows it is in the paper.
In the paper
“In general, both ATAC and RNA can readily resolve all major tissue features in this region, but spatial cosequencing of epigenome and transcriptome may provide new insights into the dynamic gene regulation mechanism that cannot be realized by single modalities.”
§ Spatial epigenome–transcriptome co-profiling of mammalian tissues > Spatial comapping of human brain
hedgedconditional- Asserted: passes — The authors put it forward as true.
- Checkable: passes — It can be checked against evidence.
- Load-bearing: passes — The paper’s conclusions depend on it.
- Based: passes — The paper gives a reason why it holds.
It may state two separate claims as one.
A conclusion the paper draws from its own results — it cites no other source for it, so there is none to check. The quote shows it is in the paper.
In the paper
“This could also be due in part to the presence in proximity of both oligodendrocyte precursor cells (expressing Ptprz1) and mature oligodendrocytes (where Ptprz1 is repressed) in the corpus callosum.”
§ Spatial epigenome–transcriptome co-profiling of mammalian tissues > Region-specific gene expression regulation
hedgedconditional- Asserted: passes — The authors put it forward as true.
- Checkable: passes — It can be checked against evidence.
- Load-bearing: fails — The paper’s conclusions may not depend on it.
- Based: passes — The paper gives a reason why it holds.
Probably not a substantial claim. The paper’s conclusions may not depend on it.
A conclusion the paper draws from its own results — it cites no other source for it, so there is none to check. The quote shows it is in the paper.
In the paper
“These technologies allow us to examine spatiotemporal dynamics and genome-wide gene regulation mechanisms in the tissue context.”
§ Spatial epigenome–transcriptome co-profiling of mammalian tissues > Discussion
plaindirect- Asserted: passes — The authors put it forward as true.
- Checkable: passes — It can be checked against evidence.
- Load-bearing: passes — The paper’s conclusions depend on it.
- Based: passes — The paper gives a reason why it holds.
It may state two separate claims as one.
In the paper
“PROX1, a signature gene defining granule neuron identity during pyramidal neuron fate selection44”
§ Spatial epigenome–transcriptome co-profiling of mammalian tissues > Spatial comapping of human brain
What the sources say
- Not checked yetcites [44] La Manno, G. et al. RNA velocity of single cells. Nature 560, 494–498 (2018). source
plaincorrelational- Asserted: passes — The authors put it forward as true.
- Checkable: passes — It can be checked against evidence.
- Load-bearing: fails — The paper’s conclusions may not depend on it.
- Based: passes — The paper gives a reason why it holds.
Probably not a substantial claim. The paper’s conclusions may not depend on it.
In the paper
“These results are in accordance with ATAC/H3K27me3/H3K27ac Nano-CUT&Tag analysis37 of oligodendroglial differentiation in the juvenile brain, which showed two waves of H3K27me3 repression during this process37.”
§ Spatial epigenome–transcriptome co-profiling of mammalian tissues > Region-specific gene expression regulation
What the sources say
- Not checked yetcites [37] Bartosovic, M. & Castelo-Branco, G. Multimodal chromatin profiling using nanobody-based single-cell CUT&Tag. Nat. Biotechnol. https://doi.org/10.1038/s41587-022-01535-4 (2022). source
plaincorrelational- Asserted: passes — The authors put it forward as true.
- Checkable: passes — It can be checked against evidence.
- Load-bearing: fails — The paper’s conclusions may not depend on it.
- Based: passes — The paper gives a reason why it holds.
Probably not a substantial claim. The paper’s conclusions may not depend on it.
None of the sources cited for this claim have been checked yet.
In the paper
“For H3K27ac and H3K4me3, active genes should correspond to high GAS2,13 (Methods).”
§ Spatial epigenome–transcriptome co-profiling of mammalian tissues > Spatial CUT&Tag–RNA-seq of mouse brain
What the sources say
- Not checked yetcites [2] Deng, Y. et al. Spatial-CUT&Tag: spatially resolved chromatin modification profiling at the cellular level. Science 375, 681–686 (2022). source
- Not checked yetcites [13] Granja, J. M. et al. ArchR is a scalable software package for integrative single-cell chromatin accessibility analysis. Nat. Genet. 53, 403–411 (2021). source
plaincorrelational- Asserted: passes — The authors put it forward as true.
- Checkable: passes — It can be checked against evidence.
- Load-bearing: passes — The paper’s conclusions depend on it.
- Based: passes — The paper gives a reason why it holds.
Probably not a substantial claim.
What the paper did — it cites no source for this, so there is none to check. The quote shows it is in the paper.
In the paper
“A biological replicate was also performed on P21 mouse brain (Extended Data Fig. 8; 20-μm pixel size, 50 × 50 barcodes).”
§ Spatial epigenome–transcriptome co-profiling of mammalian tissues > Spatial CUT&Tag–RNA-seq of mouse brain
plainSingle case- Asserted: passes — The authors put it forward as true.
- Checkable: passes — It can be checked against evidence.
- Load-bearing: fails — The paper’s conclusions may not depend on it.
- Based: passes — The paper gives a reason why it holds.
Probably not a substantial claim. The paper’s conclusions may not depend on it.
None of the sources cited for this claim have been checked yet.
In the paper
“such as Ptprz1, a marker of oligodendrocyte precursor cells38,39”
§ Spatial epigenome–transcriptome co-profiling of mammalian tissues > Region-specific gene expression regulation
What the sources say
- Not checked yetcites [38] Marques, S. et al. Oligodendrocyte heterogeneity in the mouse juvenile and adult central nervous system. Science 352, 1326–1329 (2016). source
- Not checked yetcites [39] Marques, S. et al. Transcriptional convergence of oligodendrocyte lineage progenitors during development. Dev. Cell 46, 504–517 (2018). source
plaincorrelational- Asserted: passes — The authors put it forward as true.
- Checkable: passes — It can be checked against evidence.
- Load-bearing: fails — The paper’s conclusions may not depend on it.
- Based: passes — The paper gives a reason why it holds.
Probably not a substantial claim. The paper’s conclusions may not depend on it.
A conclusion the paper draws from its own results — it cites no other source for it, so there is none to check. The quote shows it is in the paper.
In the paper
“This might be attributed to a minimal demand for synthesis of new PROX1 transcripts in postmitotic mature granule cells, and is thus not required to maintain an active open chromatin state.”
§ Spatial epigenome–transcriptome co-profiling of mammalian tissues > Spatial comapping of human brain
hedgedconditional- Asserted: passes — The authors put it forward as true.
- Checkable: passes — It can be checked against evidence.
- Load-bearing: fails — The paper’s conclusions may not depend on it.
- Based: passes — The paper gives a reason why it holds.
Probably not a substantial claim. The paper’s conclusions may not depend on it. It may state two separate claims as one.
What the paper did — it cites no source for this, so there is none to check. The quote shows it is in the paper.
In the paper
“All procedures described were approved by the local committee for ethical experiments on laboratory animals in Sweden (Stockholms Norra Djurförsöksetiska nämnd, nos. 1995/2019 and 7029/2020).”
§ Spatial epigenome–transcriptome co-profiling of mammalian tissues > Methods > Preparation of tissue slides
plain- Asserted: passes — The authors put it forward as true.
- Checkable: passes — It can be checked against evidence.
- Load-bearing: fails — The paper’s conclusions may not depend on it.
- Based: passes — The paper gives a reason why it holds.
Probably not a substantial claim. The paper’s conclusions may not depend on it.
What the paper did — it cites no source for this, so there is none to check. The quote shows it is in the paper.
In the paper
“All experimental procedures were conducted following European directive no. 2010/63/EU, local Swedish directive no. L150/SJVFS/2019:9, Saknr no. L150 and Karolinska Institutet complementary guidelines for procurement and use of laboratory animals, no. Dnr. 1937/03-640.”
§ Spatial epigenome–transcriptome co-profiling of mammalian tissues > Methods > Preparation of tissue slides
plain- Asserted: passes — The authors put it forward as true.
- Checkable: passes — It can be checked against evidence.
- Load-bearing: fails — The paper’s conclusions may not depend on it.
- Based: passes — The paper gives a reason why it holds.
Probably not a substantial claim. The paper’s conclusions may not depend on it.
What the paper did — it cites no source for this, so there is none to check. The quote shows it is in the paper.
In the paper
“Brain tissue collection was conducted with New York State Psychiatric Institute Institutional Review Board approval, and informed consent obtained from next of kin who agreed to donate the brains and participate in psychological autopsy interviews.”
§ Spatial epigenome–transcriptome co-profiling of mammalian tissues > Methods > Preparation of tissue slides
plain- Asserted: passes — The authors put it forward as true.
- Checkable: passes — It can be checked against evidence.
- Load-bearing: fails — The paper’s conclusions may not depend on it.
- Based: passes — The paper gives a reason why it holds.
Probably not a substantial claim. The paper’s conclusions may not depend on it. It may state two separate claims as one.
The paper relies on this without support.
The selected tissues (E13 mouse embryo, P21/22 mouse brain, adult human hippocampus) are representative models for studying spatial epigenome–transcriptome relationships in mammalian tissues.
“We applied these techniques to embryonic and juvenile mouse brain, as well as adult human brain hippocampus, to dissect epigenetic and transcriptional states and their role in the regulation of cell types dynamics in tissue.”
The paper relies on this without support.
As of the time of the study, current technologies had not been able to perform unbiased genome-wide comapping of epigenome and transcriptome on the same tissue section at the cellular level.
“As of today, current technologies have not been able to perform unbiased genome-wide comapping of epigenome and transcriptome on the same tissue section at the cellular level.”
The paper relies on this without support.
To comprehensively understand the mechanism of gene regulation, different layers of omics information need to be profiled simultaneously.
“However, to comprehensively understand the mechanism of gene regulation, different layers of omics information need to be profiled simultaneously.”
Claims other papers make about this one
Each is checked against this paper’s own text: does it say what the citing paper says it does?
The cited source says what the claim attributes to it.
In the citing paper
“the group extended this approach to spatial ATAC-RNA-seq and spatial assay of cleavage under targets and tagmentation and RNA sequencing (spatial CUT&Tag-RNA-seq) [86], which achieve co-profile of epigenome and transcriptome”
From Single-cell sequencing to multi-omics: technologies and applications (2024) · cites this paper as [86]
In the citing paper
“Recently, DBiT-seq has further demonstrated its versatility by spatial co-profiling of mRNA transcriptome and hundreds of cellular proteins as part of spatial CITE-seq126 and of transcriptome and epigenome as part of spatial ATAC–RNA-seq127, spatial CUT&Tag–RNA-seq127 and (reported in a preprint) SPARC-seq128.”
From The technological landscape and applications of single-cell multi-omics (2023) · cites this paper as [127]
Citations
Cites
Integrated analysis of multimodal single-cell data
Hao, Y., Hao, S., Andersen-Nissen, E., Mauck, W. M., Zheng, S., Butler, A., Lee, M. J., Wilk, A. J., Darby, C., Zagar, M., et al. (2020) · doi:10.1101/2020.10.12.335331 · Cited by 15,508
Integrating single-cell transcriptomic data across different conditions, technologies, and species
Butler, A., Hoffman, P., Smibert, P., Papalexi, E., & Satija, R. (2018) · Nature Biotechnology · doi:10.1038/nbt.4096 · Cited by 13,174
clusterProfiler 4.0: A universal enrichment tool for interpreting omics data
(2021) · doi:10.1016/j.xinn.2021.100141 · Cited by 12,455
Trapnell, C., Cacchiarelli, D., Grimsby, J., Pokharel, P., Li, S., Morse, M., Lennon, N. J., Livak, K. J., Mikkelsen, T. S., & Rinn, J. L. (2014) · Nature Biotechnology · doi:10.1038/nbt.2859 · Cited by 7,314
The GeneCards suite: from gene data mining to disease genome sequence analyses
Stelzer, G., Rosen, N., Plaschkes, I., Zimmerman, S., Twik, M., Fishilevich, S., Stein, T. I., Nudel, R., Lieder, I., Mazor, Y., et al. (2016) · Current Protocols in Bioinformatics · doi:10.1002/cpbi.5 · Cited by 5,550
The Global Assessment Scale: A Procedure for Measuring Overall Severity of Psychiatric Disturbance
Endicott, J. (1976) · Archives of General Psychiatry · doi:10.1001/archpsyc.1976.01770060086012 · Cited by 4,982
GREAT improves functional interpretation of cis-regulatory regions
McLean, C. Y., Bristor, D., Hiller, M., Clarke, S. L., Schaar, B. T., Lowe, C. B., Wenger, A. M., & Bejerano, G. (2010) · Nature Biotechnology · doi:10.1038/nbt.1630 · Cited by 4,502
The single-cell transcriptional landscape of mammalian organogenesis
Cao, J., Spielmann, M., Qiu, X., Huang, X., Ibrahim, D. M., Hill, A. J., Zhang, F., Mundlos, S., Christiansen, L., Steemers, F. J., et al. (2019) · Nature · doi:10.1038/s41586-019-0969-x · Cited by 4,490
La Manno, G., Soldatov, R., Zeisel, A., Braun, E., Hochgerner, H., Petukhov, V., Lidschreiber, K., Kastriti, M. E., Lönnerberg, P., Furlan, A., et al. (2018) · Nature · doi:10.1038/s41586-018-0414-6 · Cited by 4,118
Self-citationMolecular Architecture of the Mouse Nervous System
Zeisel, A., Hochgerner, H., Lönnerberg, P., Johnsson, A., Memic, F., van der Zwan, J., Häring, M., Braun, E., Borm, L. E., La Manno, G., et al. (2018) · Cell · doi:10.1016/j.cell.2018.06.021 · Cited by 2,552
Cited by
Sorted by citations
Items 201–300 of 482
Epigenetic modulation of myeloid cell functions in HIV and SARS-CoV-2 infection
Krause, C., Bergmann, E., & Schmidt, S. V. (2024) · Molecular Biology Reports · doi:10.1007/s11033-024-09266-2 · Cited by 8
Jin, J., Wang, Y., Liu, Y., Chakrabarti, S., & Su, Z. (2024) · Acta Pharmaceutica Sinica B · doi:10.1016/j.apsb.2023.12.018 · Cited by 8
“However, they may pose a challenge to integrate and link various mechanisms at the omics level with difficulty 86 .”
BackgroundSelf-citationIntegrated analysis of spatial multi-omics with SpatialGluePreprint
Long, Y., Ang, K. S., Liao, S., Sethi, R., Heng, Y., Zhong, C., Xu, H., Husna, N., Jian, M., Ng, L. G., et al. (2023) · bioRxiv (Cold Spring Harbor Laboratory) · doi:10.1101/2023.04.26.538404 · Cited by 7
Inferring single-cell spatial gene expression with tissue morphology via explainable deep learningPreprint
Zhao, Y., Alizadeh, E., Taha, H. B., Liu, Y., Xu, M., Mahoney, J. M., & Li, S. (2024) · bioRxiv (Cold Spring Harbor Laboratory) · doi:10.1101/2024.06.12.598686 · Cited by 7
Self-citationEmerging Techniques in Spatial Multiomics: Fundamental Principles and Applications to Dermatology
Jia, B. B., Sun, B. K., Lee, E. Y., & Ren, B. (2024) · Journal of Investigative Dermatology · doi:10.1016/j.jid.2024.09.006 · Cited by 8
SpaOmicsVAE: A deep learning framework for integrative analysis of spatial multi-omics data
Zhang, Z., Wang, M., Zhang, X., Dai, R., Wang, Z., Lei, L., Li, Z., Han, K., Wang, Z., Shi, C., et al. (2025) · Computer Methods and Programs in Biomedicine · doi:10.1016/j.cmpb.2025.109032 · Cited by 6
Charting the cardiac landscape: Advances in spatial transcriptomics for heart biology
Farah, E. N., Diaz, J. T., Bloomekatz, J. E., & Chi, N. C. (2025) · Seminars in Cell and Developmental Biology · doi:10.1016/j.semcdb.2025.103648 · Cited by 9
Li, J., Raina, M., Wang, Y., Xu, C., Su, L., Guo, Q., Ferreira, R. M., Eadon, M. T., Ma, Q., Wang, J., et al. (2025) · Bioinformatics · doi:10.1093/bioinformatics/btaf554 · Cited by 7
“12A, available as supplementary data at Bioinformatics online), while the second is the P22 mouse brain dataset (Zhang et al. 2023) containing over 9000 spots and around 121 000 peaks (Fig.”
Computational methods for spatial multi-omics integration
Geng, A., Cui, C., Luo, Z., Xu, J., Meng, Y., Cui, F., Wei, L., Zou, Q., & Zhang, Z. (2026) · Biotechnology Advances · doi:10.1016/j.biotechadv.2026.108807 · Cited by 6
The potential of wheat spatial omics
Tao, X.-Y., Tan, C., Liu, Y., Wang, Y., Raza, A., He, J., Wang, L., Xia, K., Yan, Y., Liao, S., et al. (2026) · Nature Genetics · doi:10.1038/s41588-026-02542-w · Cited by 9
“Spatial-ATAC-seq 65 and spatial-CUT&Tag 65 enable spatially resolved, genome-wide profiling of chromatin accessibility and histone modifications, and related multimodal systems have been developed to coprofile the transcriptome and epigenome at a genome-wide scale 58 .”
Self-citationHistone Modifications in Cardiovascular Disease: Mechanisms and Therapeutic Opportunities
Zheng, Y., Gao, Y., Guo, M., Wang, L., Zheng, X., Liao, Y., Li, Y., Zhu, J.-P., & Wei, J. (2026) · MedComm · doi:10.1002/mco2.70765 · Cited by 7
“Spatial epigenome–transcriptome coprofiling measures histone marks and gene expression on the same section, including H3K27me3, H3K27ac, and H3K4me3 [ 345 ].”
Self-citationLayering epigenomic and transcriptomic space
Minton, K. (2023) · Nature Reviews Genetics · doi:10.1038/s41576-023-00596-8 · Cited by 6
Spatial Omics: Navigating Neuroscience Research into the New Era
Guo, P., & Deng, Y. (2024) · Advances in neurobiology · doi:10.1007/978-3-031-69188-1_6 · Cited by 6
Self-citationNeMO Analytics: a compendium of transcriptomic data for the exploration of neocortical development
Sonthalia, S., Herb, B. R., Adkins, R. S., Orvis, J., Liu, J., Liao, X., Yu, Q., Mato-Blanco, X., Casella, A. M., Liu, J., et al. (2026) · Nature Neuroscience · doi:10.1038/s41593-026-02204-4 · Cited by 8
“…the regulatory control of these neuronal maturity signatures, leveraging coupled spatial RNA sequencing and epigenetic mark quantification 42 , we explored the epigenetic control of the conserved (p4of20CtxLayer) and primate-specific (p19of20CtxLayer) L4 signatures in slices of adult…”
Self-citationCell type specificity for circuit output in the midbrain dopaminergic system
Blaess, S., & Krabbe, S. (2023) · Current Opinion in Neurobiology · doi:10.1016/j.conb.2023.102811 · Cited by 6
Spatial Deconvolution of Cell Types and Cell States at Scale Utilizing TACITPreprint
Huynh, K., Tyc, K. M., Matuck, B. F., Easter, Q. T., Pratapa, A., Kumar, N. V., Pérez, P., Kulchar, R. J., Pranzatelli, T. J. F., de Souza, D., et al. (2024) · bioRxiv (Cold Spring Harbor Laboratory) · doi:10.1101/2024.05.31.596861 · Cited by 6
Yao, J., Yu, J., Caffo, B. S., Page, S. C., Martinowich, K., & Hicks, S. C. (2025) · Genome Research · doi:10.1101/gr.279380.124 · Cited by 7
“In principle, Proust ’ s framework could easily be extended and applied in other multi-omics settings including measuring RNA and chromatin accessibility (spatial ATAC – RNA-seq) (Zhang et al. 2023) or measuring RNA and metab-olomics (spatial metabolomics) (Alexandrov 2023).”
Ouologuem, S., Martens, L. D., Schaar, A. C., Shulman, M., Gagneur, J., & Theis, F. J. (2025) · Bioinformatics · doi:10.1093/bioinformatics/btaf268 · Cited by 5
“Recently, the emergence of spatial chromatin accessibility technologies (Deng et al. 2022, Llorens-Bobadilla et al. 2023, Zhang et al. 2023, Russell et al. 2024, Guo et al. 2025) offers the potential to investigate gene regulatory processes and chromatin regulation within this spatial context.”
AI-based hardware and software tools in microscopy to boost research in immunology and virology
Morone, D., & D’Antuono, R. (2025) · Frontiers in Immunology · doi:10.3389/fimmu.2025.1610345 · Cited by 5
Gao, H., Nishikubo, H., Ma, D., Pan, J., Sano, T., Imanishi, D., Sakuma, T., Fan, C., & Yashiro, M. (2025) · International Journal of Molecular Sciences · doi:10.3390/ijms26199695 · Cited by 5
“The emerging field of spatial epigenomics provides appropriate tools and promises an added layer for decoding TME complexity [121,129,130].”
Mapping multipathology via spatial omic integration
Palaganas, R. G., Sidiropoulos, D. N., Morris, M., & Stein-O’Brien, G. (2025) · Current Opinion in Biotechnology · doi:10.1016/j.copbio.2025.103398 · Cited by 6
From modality-specific to compositional foundation models for cell biology
Bahrami, M., Richter, T., Schmacke, N. A., Lavandera, A. E., & Theis, F. J. (2026) · Cell Systems · doi:10.1016/j.cels.2026.101534 · Cited by 7
Interpretable spatial multi-omics data integration and dimensionality reduction with SpaMV
Liu, Y., Ma, K., Xu, H., Xu, K., Hu, Y., Lin, Z., Lin, J.-L., Han, B., Li, S.-C., Lin, Z.-X., et al. (2026) · Nature Communications · doi:10.1038/s41467-026-74718-1 · Cited by 4
“We applied SpaMV to integrate spatial epigenomics and transcriptomics data from an embryonic day 13 mouse embryo 22 .”
Self-citationLiu, Y., Li, Z., Chen, X., Cui, X., Gao, Z., & Jiang, R. (2025) · Nature Communications · doi:10.1038/s41467-025-56535-0 · Cited by 6
“16 to 25).”
Self-citationLi, Y., Cai, G., Chen, F., Wen, K., & Ou-Yang, L. (2025) · Communications Biology · doi:10.1038/s42003-025-08372-6 · Cited by 6
Michielsen, L., Prjibelski, A. D., Foord, C., Spiegelman, Y., Kim, T., Hu, W., Jarroux, J., Hsu, J., Pfeil, R., Zhang, X., et al. (2025) · bioRxiv (Cold Spring Harbor Laboratory) · doi:10.1101/2025.06.25.661563 · Cited by 5
“However, a major shortcoming of these methods is that they lose the spatial location of cells, preventing the study of how isoforms may be spatially regulated at the cell-type-specific level.”
Cross‐Modal Denoising and Integration of Spatial Multi‐Omics Data with CANDIES
Liu, Y., Zou, W., Li, Y., Wang, J., Cai, M., & Cai, H. (2026) · Advanced Science · doi:10.1002/advs.202523754 · Cited by 6
“According to the original study [ 6 ], the authors performed spatial ATAC–RNA-seq experiments on E13 mouse embryo tissue at a pixel size of 50 𝜇𝑚 .”
InfluentialSelf-citationsoFusion: facilitating tissue structure identification via spatial multi-omics data fusion
Yu, N., Li, W., Sun, X. G., Hu, J., Zou, Q., Liu, Z., Zhang, D., Zhang, W., & Gao, R. (2025) · Briefings in Bioinformatics · doi:10.1093/bib/bbaf513 · Cited by 5
“…data from mouse thymus [8], SPOTS data from mouse spleen [6], Spatial-CITE-seq data from human tonsil [9], 10 × Visium RNA-protein data from human lymph node [23],MISAR-seq data from mouse brain [34],as well as Spatial ATAC-RNA-seq and spatial CUT&Tag-RNA-seq data fr om mouse (P22) brain [10].”
Self-citationSpaBalance: Balanced Learning for Efficient Spatial Multi‐Omics Decoding
Cui, Y., Zhao, Y. T., Yang, C., Tang, T., Liao, X., Zhang, H., Zhao, H., Wang, Z., & Zeng, Y. (2025) · Advanced Science · doi:10.1002/advs.202512973 · Cited by 5
Zhang, X., Yu, Z., Hao, G., Yao, Q., Hu, Y., Wang, F., Chen, X., Liu, L., Wong, K., & Li, X. (2026) · Nature Communications · doi:10.1038/s41467-026-68500-6 · Cited by 4
“In this study, weillustrate theability of GARDEN toidentify spatialdomainsin chromatin accessibility data, derived from a juvenile mouse brain slice processed through Spatial ATAC-RNA-seq 93 .”
Natalí, L., de la Cruz-Thea, B., Godino, A., Conde, C. B., Peinado, V. I., & Musri, M. M. (2026) · Biomolecules · doi:10.3390/biom16010173 · Cited by 5
“Some of these techniques even allow for the simultaneous detection of RNA levels and chromatin accessibility [158].”
Interpretable data integration for single-cell and spatial multi-omics
Yang, C., He, Z., Nie, Q. H., & Zhang, L. (2026) · Cell Systems · doi:10.1016/j.cels.2025.101479 · Cited by 4
SPACE-seq integrates spatial transcriptomics and lineage tracing in native tissues
Jia, Y., Sun, D., Weir, J. A., Liu, X., Russell, A. J. C., Kim, Y., Thom, N., Marrero, G. J., Kumar, V., Chen, F., et al. (2026) · Cell stem cell · doi:10.1016/j.stem.2026.05.017 · Cited by 5
Mechanisms and interventions of epigenetic aging
Chu, Q., Li, Y., Wu, Z., Qu, J. T., & Liu, G. (2026) · Cell chemical biology · doi:10.1016/j.chembiol.2026.05.007 · Cited by 4
Differential chromatin accessibility and Gene Expression Associated with Backfat Deposition in pigs
Zhang, Z., Chang, L., Wang, B., Wei, Y., Li, X., Li, X., Zhang, Y., Wang, K., Qiao, R., Yang, F., et al. (2024) · BMC Genomics · doi:10.1186/s12864-024-10805-1 · Cited by 4
“Chromatin accessibility, a crucial aspect of epigenetics, represents the direct impact of chromatin structure on gene transcription [8].”
BackgroundCao, X. D., Ma, T., Fan, R., & Yuan, G. (2024) · Cell Systems · doi:10.1016/j.cels.2024.10.006 · Cited by 5
Self-citationDivergent combinations of enhancers encode spatial gene expression
Hong, D., Shu, M., Liu, J., Liu, L., Cheng, H., Zhu, M., Du, Y., Xu, B., Hu, D., Liu, Z., et al. (2025) · Nature Communications · doi:10.1038/s41467-025-60482-1 · Cited by 5
“The spatial epigenome-transcriptome co-pro fi ling was captured by Zhang et al. 14 , containing 9215 spots with 260,032 accessible peaks and 22,914 expressed genes.”
InfluentialFox, J. A., Reader, S. M., Guigueno, M. F., & Barrett, R. D. H. (2025) · Molecular Ecology · doi:10.1111/mec.17831 · Cited by 6
“Newly developed spatial sequencing technologies may also be useful for this (Zhang et al. 2023).”
Zhu, J., Liu, C., Huang, X., van de Leemput, J., Lee, H., & Han, Z. (2023) · Journal of Cardiovascular Development and Disease · doi:10.3390/jcdd10070307 · Cited by 4
Chen, Y., Zhen, C., Mo, Y., Liu, J., & Zhang, L. (2025) · Advanced Science · doi:10.1002/advs.202413124 · Cited by 4
AtlasXplore: a web platform for visualizing and sharing spatial epigenome data
Barnett, J., Sotudeh, N., Rao, P., Silverman, J., Jafar, T., & Wang, L. (2023) · Bioinformatics · doi:10.1093/bioinformatics/btad447 · Cited by 3
“…emerged for interrogating chromatin state (Deng, Bartosovic, Ma, et al. , 2022; Llorens-Bobadilla et al. , 2023), histone modifications (Deng, Bartosovic, Kukanja, et al. , 2022), or co-profiling chromatin state/histone modification with transcriptome (Zhang et al. , 2023) in solid tissue sections.”
BackgroundMethodSelf-citationHow is Big Data reshaping preclinical aging research?
Fernández, M. E., Martínez-Romero, J., Aon, M. A., Bernier, M., Price, N. L., & de Cabo, R. (2023) · Lab Animal · doi:10.1038/s41684-023-01286-y · Cited by 5
STAN, a computational framework for inferring spatially informed transcription factor activity
Zhang, L., Sagan, A., Qin, B., Wang, H., Kim, E. S., Hu, B., & Osmanbeyoglu, H. U. (2025) · Nucleic Acids Research · doi:10.1093/nar/gkaf1473 · Cited by 4
“Our framework can be extended by emerging spatial epigenome − transcriptome coprofiling [ 78 ] for more accurate representation of both promoter and enhancer regions, as performed in the context of patient-specific predictive regulatory models [ 79 ].”
SIMVI reveals intrinsic and spatial-induced states in spatial omics dataPreprint
Dong, M., Su, D. G., Kluger, H. M., Fan, R., & Kluger, Y. (2023) · bioRxiv (Cold Spring Harbor Laboratory) · doi:10.1101/2023.08.28.554970 · Cited by 4
“Sequencing-based spatial omics technologies, such as DBiT-seq [5–7], Slide-seqV2 [8], HDST [9], Slide-tags [10] and Stereo-seq [11, 12], provide genome-wide gene profiling at a cellular or near cellular resolution.”
Self-citationZhang, D., Yu, N., Li, W., Sun, X. G., Zou, Q., Li, X., Liu, Z., Yuan, Z., Zhang, W., & Gao, R. (2024) · bioRxiv (Cold Spring Harbor Laboratory) · doi:10.1101/2024.02.22.581503 · Cited by 4
Self-citationPelayo, M. A., & Yamaguchi, N. (2023) · Frontiers in Plant Science · doi:10.3389/fpls.2023.1323507 · Cited by 3
“…at integrating transcriptomic data at single-cell resolution with the epigenome, which was recently reported for mammalian systems but currently unavailable in plants, should greatly advance our understanding of fl oral meristem development in four dimensions (Minton, 2023; Zhang et al., 2023).”
BackgroundWang, B., Liu, W., Luo, J., Chen, X., & Kwoh, C. K. (2024) · IEEE International Conference on Bioinformatics and Biomedicine (BIBM) · doi:10.1109/bibm62325.2024.10822097 · Cited by 4
“Sequencing-based techniques include: 10x Genomics Xenium [4], MISAR-seq [5], SM-Omics [6], CUT&Tag-RNA-seq [7], spatial-CITE-seq [8], and SPOTS [9], etc.”
What spatial omics is teaching us about field cancerisation in prostate and bladder cancer
Byrne, M. H. V., Anbarasan, T., Browning, L., & Woodcock, D. J. (2025) · British Journal of Urology · doi:10.1111/bju.16830 · Cited by 6
Roadmap for spatial transcriptomics of HIV in tissues
Guan, Q., Eshetu, A., & Ho, Y. (2025) · Current Opinion in HIV and AIDS · doi:10.1097/coh.0000000000000961 · Cited by 5
Histone modifications: key mechanisms in embryo implantation of domestic animal
Sha, Y., Qin, X., & Pang, W. (2025) · Theriogenology · doi:10.1016/j.theriogenology.2025.117568 · Cited by 3
Wang, Y., Ma, W., Ma, Y., Zhao, W., & Ma, X. (2025) · IEEE Transactions on Computational Biology and Bioinformatics · doi:10.1109/tcbbio.2025.3627901 · Cited by 3
“To demonstrate that SIMID is not limited to datasets sequenced from humans, we further evaluate it on a mouse brain epigenome–transcriptome dataset generated by spatial ATAC– RNA-seq [54] to assess its generalizability.”
Mapping TAM–tumor crosstalk in glioma via ligand–receptor multi-omics: mechanisms of immune evasion
Zhang, D., Ma, Y., & Feng, D. (2025) · Frontiers in Immunology · doi:10.3389/fimmu.2025.1699915 · Cited by 3
Self-citationWang, J., Sun, Z., Zhou, Y., Wang, L., & Liu, J. (2026) · Stem Cell Research & Therapy · doi:10.1186/s13287-025-04885-3 · Cited by 3
“By integrating genome, transcriptome, proteome, metabolome, and epigenome data in their spatial context, this methodology enables researchers to explore how diverse molecular processes converge to regulate brain development and function [67, 68].”
Self-citationAgrawal, A., & Thomann, S. (2026) · American Journal Of Pathology · doi:10.1016/j.ajpath.2026.01.007 · Cited by 4
GATCL: graph attention network meets contrastive learning for spatial domain identification
Mu, J., Yao, Y., Chen, Q., Sun, J., & Zhao, T. (2026) · Briefings in Bioinformatics · doi:10.1093/bib/bbag043 · Cited by 3
“To a ddress this, the field has transitioned to spatial multi-omics, like Stereo-cite-seq [18], SPOTS [19], spatial ATAC–RNA-seq and CUT&Tag-RNA-seq [20].”
Heterogeneity of bacterial host-pathogen interactions across biological scales
Redondo, J. A., Purkait, N., & Paszek, P. (2026) · mSystems · doi:10.1128/msystems.01804-25 · Cited by 3
Spatial 5mC-seq profiling of embryos and decidua after implantation in mammals
Shan, X., Tang, Y., Hu, J., Bian, M., Yao, X., Gao, L., & Liu, J. (2026) · Nature Methods · doi:10.1038/s41592-026-03079-w · Cited by 3
“Spatial epigenomics technologies provide powerful tools to uncover epigenetic heterogeneity, as well as the spatial heterogeneity and organizational architecture of tissues, allowing for a more comprehensive understanding of biological systems 1–4 .”
Spatial transcriptomics in Alzheimer's disease: technologies, challenges and discoveries
Shi, C. H., Piña-Crespo, J., Yip, K. Y., & Huang, T. Y. (2026) · Molecular Neurodegeneration Advances · doi:10.1186/s44477-026-00036-x · Cited by 3
Multimodal spatial omics: From data acquisition to computational integration
Işık, E. B., Usta, Y. H., Riazi, M., Liu, H., Roach, W., Zhou, H., Nicolaou, A., Rattray, M., & Georgaka, S. (2026) · Patterns · doi:10.1016/j.patter.2026.101592 · Cited by 5
“90,91 Table 1 provides a summary of all the above strategies.”
Spatial epigenome–transcriptome comapping technology
Jin, M., & Jin, W. (2023) · Trends in Cell Biology · doi:10.1016/j.tcb.2023.03.011 · Cited by 3
Single-cell technologies for multimodal omics measurements
Bai, D., & Zhu, C. (2023) · Frontiers in Systems Biology · doi:10.3389/fsysb.2023.1155990 · Cited by 3
“By introducing spatial information to single cells with a deterministic barcoding approach, spatial-ATAC-RNAseq, and spatial-CUT&Tag-RNA-seq enabled co-profiling of accessible chromatin or histone modifications with transcriptome on the same tissue section and uncovered new biological insights in epigenetic priming an…”
BackgroundKartiganer, Z., Rojas, G., Riccio, M., Tyree, A., Noronha, K. J., Wetzel, M., Barnett, J., McGann, J. C., Garbarino, J. M., Massucci, D., et al. (2023) · GEN Biotechnology · doi:10.1089/genbio.2023.0044 · Cited by 3
Emerging high-resolution spatial transcriptomic technologies in kidney research
Xuanyuan, Q., Wu, H., & Humphreys, B. D. (2024) · Nephrology Dialysis Transplantation · doi:10.1093/ndt/gfae125 · Cited by 4
Trends and Challenges of the Modern Pathology Laboratory for Biopharmaceutical Research Excellence
Sisó, S., Kavirayani, A. M., Couto, S. S., Stierstorfer, B., Mohanan, S., Morel, C., Marella, M., Bangari, D. S., Clark, E. S., Schwartz, A. J., et al. (2024) · Toxicologic Pathology · doi:10.1177/01926233241303898 · Cited by 3
“32,39,44,63,69,72,79,98,109,115,117,128,129,139,154,172,180,189,194,200,202,204,205 As exciting as it is to witness this revolution in spatial molecular pathology tools, testing these technologies is very disruptive, expensive, and time-consuming.”
Assessing the current molecular understanding of therapeutic targets in osteosarcoma
Zhang, C., & Yang, J. (2025) · Expert Opinion on Therapeutic Targets · doi:10.1080/14728222.2025.2545836 · Cited by 3
“Spatial transcriptomic mapping recently uncovered H3K27me3 patterns that epigenetically prime ABCB1/P-gp-mediated drug efflux [6,7], while single-cell chromatin accessibility profiling demonstrated how metastatic clones hijack osteogenic enhancers to sustain stemness programs [8].”
Cofea: correlation-based feature selection for single-cell chromatin accessibility data
Li, K., Chen, X., Song, S., Hou, L., Chen, S., & Jiang, R. (2023) · Briefings in Bioinformatics · doi:10.1093/bib/bbad458 · Cited by 2
“Cofea first applies TF-IDF transformation to the input peak-by-cell matrix following Signac (21), a widely used toolkit for scCAS data analysis (23-26).”
Zhang, R., Jiang, W.-J., Zhao, S., Kang, L.-J., Wang, Q., & Feng, Y.-M. (2025) · Cancer Letters · doi:10.1016/j.canlet.2025.217463 · Cited by 3
Shining a light on cell biology of the nucleus with single-cell sequencing
van den Berg, J., & Zeller, P. J. (2025) · Current Opinion in Cell Biology · doi:10.1016/j.ceb.2025.102468 · Cited by 4
Dimensionality reduction for visualizing spatially resolved profiling data using SpaSNE
Zhou, Y., Tang, C., Xiao, X., Zhan, X., Wang, T., Xiao, G., & Xu, L. (2025) · GigaScience · doi:10.1093/gigascience/giaf002 · Cited by 5
Hu, L., Zhang, S., Zhang, X., Luo, Y., Gu, H., Liu, P., Mao, S., Chen, L., Xia, Y., Yang, M., et al. (2025) · bioRxiv (Cold Spring Harbor Laboratory) · doi:10.1101/2025.08.21.671434 · Cited by 3
Wang, D., Di, X., Gao, F., Li, G., Lin, L., He, S., Zhang, D., Jin, J. Y., Liang, Y., Cecchini, M., et al. (2025) · bioRxiv (Cold Spring Harbor Laboratory) · doi:10.1101/2025.09.11.675640 · Cited by 3
“Notably, recent advances in spatial ATAC-seq now allow chromatin accessibility profiling within intact tissue architecture, restoring spatial context while retaining high-resolution epigenomic data 26,27 .”
Self-citationSuper-CUT&Tag: A Sensitive, Spatially Resolved Approach for Epigenomic Profiling in Tissue SectionsPreprint
Zhu, M., Zha, Z., Xuan, J., Zhao, H., Dai, J., Liu, J., Xia, Y., Lin, H., Yang, Y., Chen, F., et al. (2025) · bioRxiv (Cold Spring Harbor Laboratory) · doi:10.64898/2025.12.08.692886 · Cited by 3
“This elegant strategy enables epigenomic mapping in the tissue section and is compatible with multi-omics extensions 28,29 .”
Advances in spatial multi-omics technologies
Zhang, W., Huang, X., He, L., & Zhao, X. (2025) · Chinese Science Bulletin (Chinese Version) · doi:10.1360/tb-2024-1403 · Cited by 3
CUT&RUN and CUT&Tag for histone modification and transcription factor binding analyses
Hinte, L. C., & von Meyenn, F. (2025) · Elsevier eBooks · doi:10.1016/b978-0-443-26759-8.00003-5 · Cited by 2
From identity to function: unveiling the cellular complexity of hypothalamic feeding circuits
Littleton, S. H., Tadross, J. A., & Yeo, G. S. H. (2025) · Reviews in Endocrine and Metabolic Disorders · doi:10.1007/s11154-025-10004-7 · Cited by 2
Denoising spatial epigenomic data via deep matrix factorization
Wang, S. S., Xu, H., Wang, J., Xiao, Y., Dai, S., Lu, J., Cao, R., Chen, X., & Qu, K. (2026) · Nature Computational Science · doi:10.1038/s43588-025-00941-3 · Cited by 2
“To further demonstrate SPEED’s utility beyond embryonic tissues, we applied it to three biologically complex datasets: (1) the adult human hippocampus spatial ATAC-RNA-seq dataset from Zhang et al. 8 ; (2) the P22 mouse brain dataset from the same study 8 ; and (3) the spatial-Mux-seq dataset from the mouse model of n…”
InfluentialSelf-citationSingle-cell protein profiling energized by microfluidic technology
Yang, R., Ruan, Q., Guo, W., Shen, H., Lin, X., Chen, Y., Tao, Y., Yang, C. J., & Ren, Y. (2026) · Lab on a Chip · doi:10.1039/d5lc00854a · Cited by 2
The Evolution of Spatial Omics Technologies Introduces A Novel Avenue for Lung Cancer Research
(何越), Y. H., Li, Z., (王文香), W. W., Liu, X., Lu, S., (白晶), J. B., Weng, L., Zhang, Q., Wang, J., & Chen, K. (2026) · Genomics Proteomics & Bioinformatics · doi:10.1093/gpbjnl/qzag010 · Cited by 2
MultiSP deciphers tissue structure and multicellular communication from spatial multi-omics data
Mo, C., Zou, X., & Jin, S. (2026) · Cell Genomics · doi:10.1016/j.xgen.2026.101141 · Cited by 2
Zhang, Z., Cheng, W. S., Taniguchi‐Ponciano, K., Marrero–Rodríguez, D., Smith, G. R., Pinças, H., Sagendorf, T. J., Mendelev, N., Strupinsky, G., Ge, Y., et al. (2026) · Cell Systems · doi:10.1016/j.cels.2026.101532 · Cited by 2
Gan, J., Yang, X., Wu, J., Cai, Z., Zhai, X., Wu, Y., Li, W., & Wu, M. (2026) · Cellular and Molecular Neurobiology · doi:10.1007/s10571-026-01718-6 · Cited by 2
“In recent years, an increasing number of studies have sug - gested that histone methylation/demethylation participates in neuronal apoptosis and ferroptosis (Zhang et al. 2023b).”
Li, M., Sun, P., Luo, Y., Zhou, G., Yang, X., Meng, D., & Ye, K. (2026) · Nature Communications · doi:10.1038/s41467-026-71882-2 · Cited by 3
Epigenetic noise in the aging brain: tuning neuronal vulnerability to neurodegeneration
Yin, X., Zhang, H., Zhang, R., Xue, J., & Hou, Y. (2026) · Trends in Neurosciences · doi:10.1016/j.tins.2026.04.006 · Cited by 3
Cellular mechano-memory informs biomaterials and mechano-medicine
Qiao, P., Zhao, H., Ma, Z., Hasani, M., & Song, Y. (2026) · Cell Reports Physical Science · doi:10.1016/j.xcrp.2026.103308 · Cited by 2
3D multi-omics tumour atlases: from technology to biology and clinical translation
Liu, M., Villazon, J. I., Forjaz, A., Tian, X., Fan, R., Wang, S., Shi, L., Wirtz, D., & Kiemen, A. L. (2026) · Nature reviews. Cancer · doi:10.1038/s41568-026-00940-0 · Cited by 3
Self-citationDecoding Cardiac Development and Maturation at Single-Cell and Spatial Transcriptomic Resolution
Li, B., Liu, X., Murphy, S. A., Tampakakis, E., & Kwon, C. (2026) · Circulation Research · doi:10.1161/circresaha.125.327473 · Cited by 3
Michielsen, L., Prjibelski, A. D., Foord, C., Spiegelman, Y., Kim, T., Hu, W., Jarroux, J., Hsu, J., Pfeil, R., Zhang, X., et al. (2026) · Nature Methods · doi:10.1038/s41592-026-03211-w · Cited by 6
“18).”
Unveiling aging dynamics in the hematopoietic system insights from single-cell technologies
Jin, X., Zhang, R., Fu, Y., Zhu, Q., Hong, L., Wu, A., & Wang, H. (2024) · Briefings in Functional Genomics · doi:10.1093/bfgp/elae019 · Cited by 2
Curry, A. R., Ooi, L., & Matosin, N. (2024) · Stress · doi:10.1080/10253890.2024.2351394 · Cited by 2
“…(Klengel & Binder elisabeth, 2015). two methods include the spatial assay for transposase-accessible chromatin with sequencing (SpatialAtAC&RnAseq) (Deng et al., 2022) and the spatial cleavage under targets and tagmentation (Spatial-CUt&tag) meth-ods (Deng et al., 2022; Zhang et al., 2023).”
Verstappe, B., & Scott, C. L. (2024) · Clinical & Experimental Immunology · doi:10.1093/cei/uxae077 · Cited by 3
“In addition to these spatial proteogenomic approaches allowing multiplexed spatial mapping of gene and protein expression profiles, spatial epigenetic methods (spatial ATAC-seq, spatial cut and run) are now also being developed [112– 114].”
Pathogenomic fingerprinting to identify associations between tumor morphology and epigenetic states
Monabbati, S., Corredor, G., Pathak, T. B., Peacock, C. D., Yang, K., Koyfman, S. A., Scacheri, P. C., Lewis, J. S., Madabhushi, A., Viswanath, S. E., et al. (2025) · European Journal of Cancer · doi:10.1016/j.ejca.2025.115429 · Cited by 2
Relation of Known Hallmarks of Aging to the Ontogenesis Program
Salnikov, L. (2023) · Open Access Journal of Gerontology & Geriatric Medicine · doi:10.19080/oajggm.2023.07.555706 · Cited by 2
Battistoni, G., Torres-Garcia, S., Sia, C. Y., Corriero, S., Boquetale, C., Williams, E., Alini, M., Hemmer, N., Balasubramanian, S., Czech, B., et al. (2024) · bioRxiv (Cold Spring Harbor Laboratory) · doi:10.1101/2024.05.20.595040 · Cited by 2
“For instance, Share-Seq 31 and DBiT-seq 26,27 both employ a nucleic acid handle that can be attached to many types of biomolecules to enable subsequent serial ligations to generate a barcode that encodes the cell identity or spatial location, respectively.”
BackgroundWills, C., & Ashe, A. (2025) · doi:10.1093/obo/9780199941728-0158 · Cited by 2
Wu, S., Amin, S., Lee, C., Richard, J.-B., Merali, N., Morrell, C., Overend, L., Gao, W., Tucci, F., Gordon-Weeks, A. N., et al. (2025) · bioRxiv (Cold Spring Harbor Laboratory) · doi:10.1101/2025.06.30.662328 · Cited by 2
Interpretable spatial multi-omics data integration and dimension reduction with SpaMVPreprint
Liu, Y., Ma, K., Xu, H., Xu, K., Hu, Y., Lin, Z., Lin, J.-L., Han, B., Li, S.-C., Lin, Z.-X., et al. (2025) · bioRxiv · doi:10.1101/2025.08.02.668264 · Cited by 3
“SpaMV enhances spatial multi-omics integration in mouse embryo spatial epigenome-transcriptome data We applied SpaMV on a real-world dataset from an embryonic day 13 (E13) mouse embryo, which includes co-profiling of the spatial transcriptome and epigenome [18].”
InfluentialSelf-citationWhole-genome single-cell multimodal history tracing to reveal cell identity transitionPreprint
Kawamura, Y., Khalil, V., & Kitazawa, T. (2025) · bioRxiv (Cold Spring Harbor Laboratory) · doi:10.1101/2025.08.12.669973 · Cited by 2
Spatial patterning of transcriptional and regulatory programs in the primate subcortexPreprint
Dan, S., Turner, M. A., DeBerardine, M., Caceres, L., Nieto-Caballero, V. E., Schembri, J., Levandowski, K. M., Cardenas, C., Wang, N., Li, C., et al. (2025) · bioRxiv (Cold Spring Harbor Laboratory) · doi:10.1101/2025.11.22.689869 · Cited by 4
Self-citationMultimodal alignments of in vivo imaging and spatial biology datasets at cellular resolutionPreprint
Wang, L., Jiang, X., Sun, X., Chattree, G., Cetin, A. H., Cai, X., Paul, E., Chrapkiewicz, R., Hernandez, O., Ke, Y., et al. (2026) · bioRxiv (Cold Spring Harbor Laboratory) · doi:10.64898/2026.04.28.719500 · Cited by 4
Self-citationThe importance of age‐specific gene expression
Hall, J. G. (2023) · American Journal of Medical Genetics Part A · doi:10.1002/ajmg.a.63354 · Cited by 1
“There may be differences between different ethnic groups (Liao et al., 2023; Xu et al., 2023; Zhang et al., 2023).”
Background
Metadata
- Authors
- Zhang, D., Deng, Y., Kukanja, P., Agirre, E., Bartosovic, M., Dong, M., Ma, C., Ma, S., Su, G., Bao, S., Liu, Y., Xiao, Y., Rosoklija, G. B., Dwork, A. J., Mann, J. J., Leong, K. W., Boldrini, M., Wang, L., Haeussler, M., Raphael, B. J., Kluger, Y., Castelo-Branco, G., & Fan, R.
- Affiliations
- Yale University (US)
- Yale Cancer Center (US)
- Karolinska Institutet (SE)
- Princeton University (US)
- Broad Institute (US)
- Columbia University (US)
- Macedonian Academy of Sciences and Arts (MK)
- New York State Psychiatric Institute (US)
- Columbia University Irving Medical Center (US)
- University of California, Santa Cruz (US)
- Corresponding author
- Deng, Yanxiang
- Fan, Rong
- ORCID
- Venue
- Nature
- Published
- 2023-03-15
- Volume
- 616
- Issue
- 7955
- Pages
- 113-122
- ISSN
- 0028-0836 (ISSN-L)
- 1476-4687
- PMC
- PMC10076218
- OpenAlex
- W4324344255
- Semantic Scholar
- bde8da8ff6a896af73232add8cdb5f49a044ecc1
- Cited by
- 483
- References
- 58
- Citations by year
- 2026: 172 · 2025: 163 · 2024: 87 · 2023: 59
- FWCI
- 42.73
- Type
- journal article
- Language
- en
- Open access
- hybrid
- doi.org
- Locations
- Nature (publishedVersion, cc-by)
- Research Square (acceptedVersion, cc-by)
- PubMed Central (publishedVersion, cc-by)
- PubMed (publishedVersion)
- RePEc: Research Papers in Economics (submittedVersion)
- eScholarship (California Digital Library) (submittedVersion, cc-by)
- Funders
- Yale University
- Li Ka Shing Foundation
- Society for Immunotherapy of Cancer
- Göran Gustafssons Stiftelser
- European Commission (HORIZON2020, 794689)
- Cancerfonden (190394 Pj, 2019-)
- Svenska Sällskapet för Medicinsk Forskning (JUB2019)
- Karolinska Institutet
- Knut och Alice Wallenbergs Stiftelse (2019–0107)
- Vetenskapsrådet (2019-01360)
- National Institutes of Health (1u01ca294514-01, 1rf1mh128876-01)
- National Institute on Aging (U54AG076043, U54AG079759)
- National Institute of Mental Health (RF1 MH128876, RM1MH132648)
- National Cancer Institute (U01 CA294514, UH3CA257393, UG3CA257393, U24CA248453, R01CA245313, U54CA274509)
- National Institute of Diabetes and Digestive and Kidney Diseases (U54DK106857)
- Topics
- Life Sciences › Biochemistry, Genetics and Molecular Biology › Molecular Biology › Single-cell and spatial transcriptomics
- Life Sciences › Biochemistry, Genetics and Molecular Biology › Molecular Biology › Genomics and Chromatin Dynamics
- Life Sciences › Biochemistry, Genetics and Molecular Biology › Molecular Biology › Epigenetics and DNA Methylation
- Keywords
- spatial epigenomics, spatial transcriptomics, chromatin accessibility, histone modifications, H3K27me3, H3K27ac, H3K4me3, single-cell resolution, mouse brain, human brain, cell dynamics, gene expression regulation, epigenetic priming, tissue structure
- MeSH terms
- Epigenome, Aging, Animals, Brain, Chromatin, Gene Expression Regulation, Histones, Humans, Mammals, Organ Specificity, Gene Expression Profiling, Epigenesis, Genetic, Mice, Epigenomics, Single-Cell Analysis, Transcriptome
About these checks
Registry, retraction, Cites and statistics results are computed, not judged, with one exception: a printed reference that no index lists is read once by a model before it counts as a citation error. Claims are extracted by a model and kept only when their quote appears verbatim in the text; each cited source is then checked, with a model’s help, for whether it says what the claim relies on. Those verdicts can be wrong — read the claim’s quote and the cited source before relying on one.
A language model drew the claims from the paper on 2026-10-07, under version 3 of the claim definition (model deepseek-v4.1-flash, prompt extract-v3).
A second model labelled each claim on 2026-10-07 (model jev-1.13-20260917, definition revision gold-guideline-v0.2).
Cited sources are checked with a language model’s help (gpt-6-sol).
Statistics and arithmetic are recomputed, not judged.
Confidence bands are shown only for fields calibrated on our annotated test set. None is calibrated yet, so no band is shown.
What counts as a claim ›How we measure confidence ›How we check this ›
Are you an author, or do you see a problem with this page? Request a review
