

The DOI matches its Crossref record; 84 of the 84 references it cites were found in a registry or an index.
Mapping single-cell data to reference atlases by transfer learning
Open accessAbstract
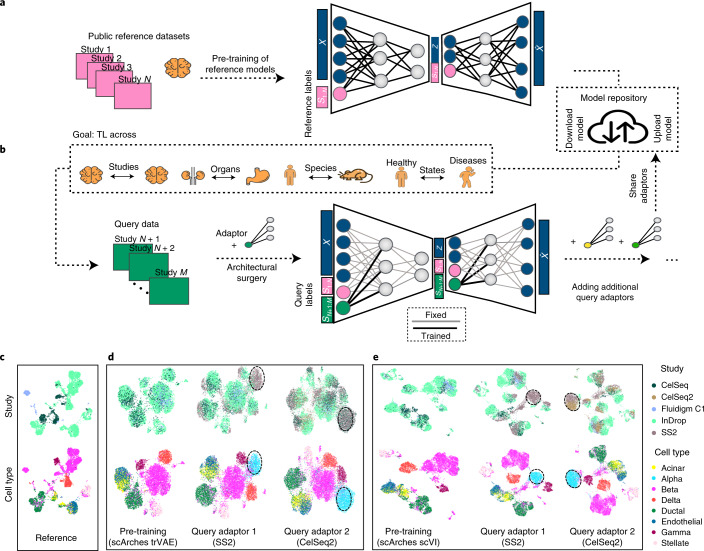
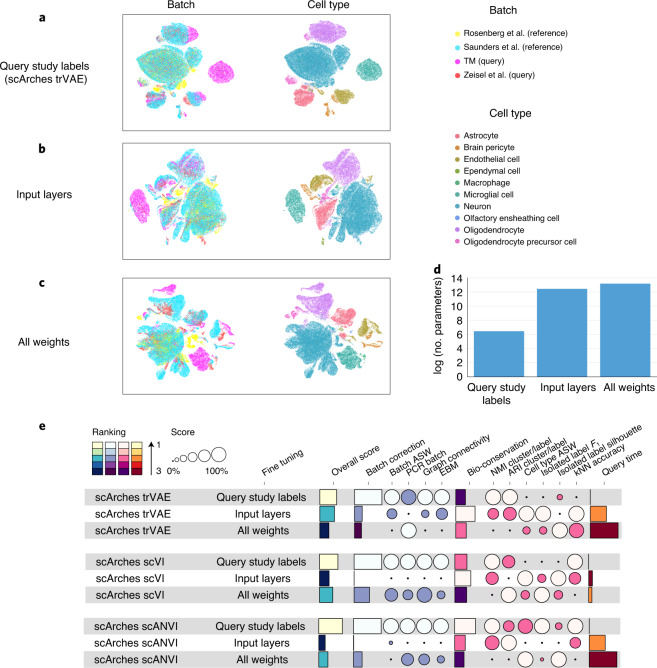
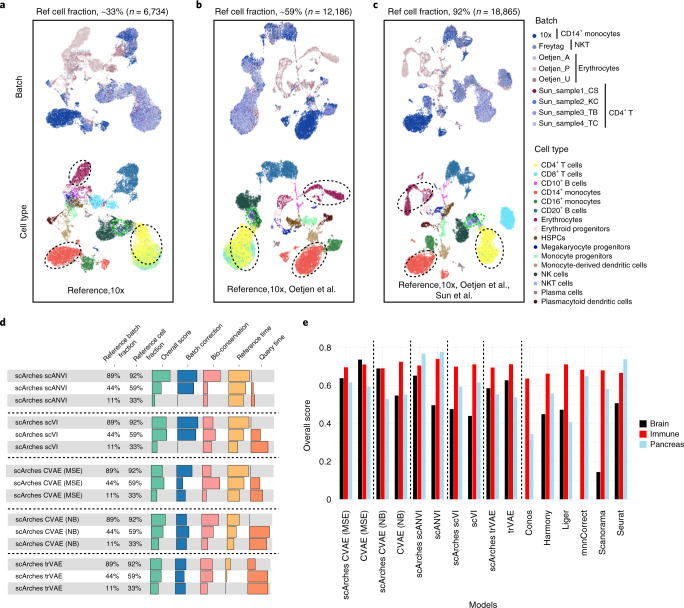
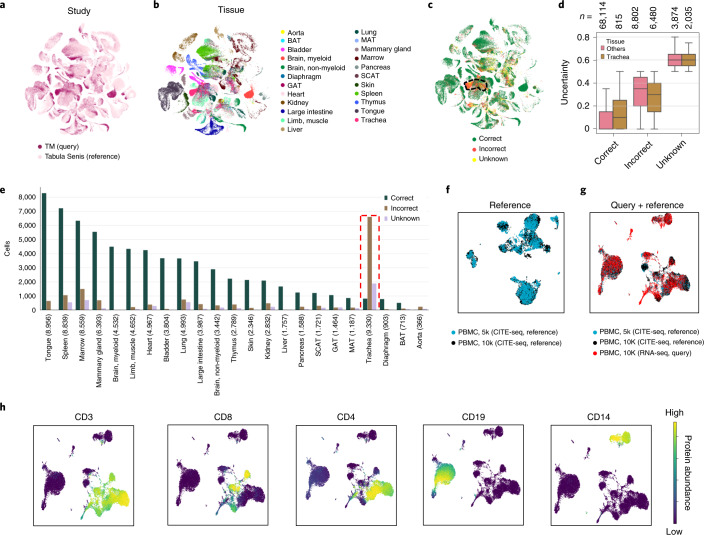
Large single-cell atlases are now routinely generated to serve as references for analysis of smaller-scale studies. Yet learning from reference data is complicated by batch effects between datasets, limited availability of computational resources and sharing restrictions on raw data. Here we introduce a deep learning strategy for mapping query datasets on top of a reference called single-cell architectural surgery (scArches). scArches uses transfer learning and parameter optimization to enable efficient, decentralized, iterative reference building and contextualization of new datasets with existing references without sharing raw data. Using examples from mouse brain, pancreas, immune and whole-organism atlases, we show that scArches preserves biological state information while removing batch effects, despite using four orders of magnitude fewer parameters than de novo integration. scArches generalizes to multimodal reference mapping, allowing imputation of missing modalities. Finally, scArches retains coronavirus disease 2019 (COVID-19) disease variation when mapping to a healthy reference, enabling the discovery of disease-specific cell states. scArches will facilitate collaborative projects by enabling iterative construction, updating, sharing and efficient use of reference atlases.
Overview
The claims and statistics of this paper haven’t been checked yet.
Free: it reads the open-access text and checks the first 5 claims that cite a source we can check. Create a free account to check every claim.
Integrity signals
Registry
Cites
Statistics
Figures
Verification
Claims the paper makes
The claims and statistics of this paper haven’t been checked yet.
Free: it reads the open-access text and checks the first 5 claims that cite a source we can check. Create a free account to check every claim.
Claims other papers make about this one
Each is checked against this paper’s own text: does it say what the citing paper says it does?
The cited source says what the claim attributes to it.
In the citing paper
“Lotfollahi et al. applied transfer learning for mapping query single cells with a decentralized and iterative updating reference model [12].”
From Challenges in AI-driven Biomedical Multimodal Data Fusion and Analysis (2025) · cites this paper as [12]
Self-check
Percentages, sums and reported differences re-computed from the paper’s own numbers.
The self-check needs the paper’s full text.
Citations
Cites
ImageNet classification with deep convolutional neural networks
Krizhevsky, A., Sutskever, I., & Hinton, G. E. (2017) · Communications of the ACM · doi:10.1145/3065386 · Cited by 112,155 · cited 1×
“These references help to understand the cellular heterogeneity that constitutes natural and inter-individual variation, aging, environmental influences and disease.”
BackgroundBERT: Pre-training of Deep Bidirectional Transformers for Language Understanding
Devlin, J., Chang, M.-W., Lee, K., & Toutanova, K. (2018) · arXiv · doi:10.48550/arxiv.1810.04805 · Cited by 73,173
Scikit-learn: Machine Learning in Python
Pedregosa, F., Varoquaux, G., Gramfort, A., Michel, V., Thirion, B., Grisel, O., Blondel, M., Müller, A., Nothman, J., Louppe, G., et al. (2012) · arXiv · doi:10.48550/arxiv.1201.0490 · Cited by 71,016 · cited 2×
“22 ) and logistic regression classifiers 50 (Supplementary Fig.”
BackgroundMethodBERT: Pre-training of Deep Bidirectional Transformers for Language Understanding
Devlin, J., Chang, M.-W., Lee, K., & Toutanova, K. (2019) · Proceedings of the 2019 Conference of the North American Chapter of the Association for Computational Linguistics: Human Language Technologies, Volume 1 (Long and Short Papers) · doi:10.18653/v1/n19-1423 · Cited by 54,325
Auto-Encoding Variational Bayes
Kingma, D. P., & Welling, M. (2013) · arXiv · doi:10.48550/arxiv.1312.6114 · Cited by 20,067
Integrated analysis of multimodal single-cell data
Hao, Y., Hao, S., Andersen-Nissen, E., Mauck, W. M., Zheng, S., Butler, A., Lee, M. J., Wilk, A. J., Darby, C., Zagar, M., et al. (2020) · doi:10.1101/2020.10.12.335331 · Cited by 15,508
Comprehensive Integration of Single-Cell Data
Stuart, T., Butler, A., Hoffman, P., Hafemeister, C., Papalexi, E., Mauck, W. M., Hao, Y., Stoeckius, M., Smibert, P., & Satija, R. (2019) · Cell · doi:10.1016/j.cell.2019.05.031 · Cited by 15,453
Fast, sensitive and accurate integration of single-cell data with Harmony
Korsunsky, I., Millard, N., Fan, J., Slowikowski, K., Zhang, F., Wei, K., Baglaenko, Y., Brenner, M., Loh, P.-R., & Raychaudhuri, S. (2019) · Nature Methods · doi:10.1038/s41592-019-0619-0 · Cited by 10,488
SCANPY: large-scale single-cell gene expression data analysis
Wolf, F. A., Angerer, P., & Theis, F. J. (2018) · Genome Biology · doi:10.1186/s13059-017-1382-0 · Cited by 8,881
Self-citationConditional Generative Adversarial Nets
Mirza, M., & Osindero, S. (2014) · arXiv · doi:10.48550/arxiv.1411.1784 · Cited by 8,863
Research works printed but not linked: 2
- Stuart, T. et al. Comprehensive integration of single cell data. Cell 177, 1888–1902 (2019). · DOI · Paper page
- Sohn, K., Lee, H. & Yan, X. Learning structured output representation using deep conditional generative models. in Advances in Neural Information Processing Systems (eds. Cortes, C. et al.) 28, 3483–3491 (Curran Associates, 2015).
Cited by
Dictionary learning for integrative, multimodal and scalable single-cell analysis
Hao, Y., Stuart, T., Kowalski, M. H., Choudhary, S., Hoffman, P., Hartman, A., Srivastava, A., Molla, G., Madad, S., Fernandez-Granda, C., et al. (2024) · Nature Biotechnology · doi:10.1038/s41587-023-01767-y · Cited by 5,631
“This strategy is enabled by the curation and public release of reference datasets as well as the development of new computational tools, including statistical learning 4–7 and deep learning-based approaches 8,9 , that have been successfully applied toward this goal.”
scGPT: Towards Building a Foundation Model for Single-Cell Multi-omics Using Generative AI
Cui, H., Wang, C., Maan, H., Pang, K., Luo, F., & Wang, B. (2023) · doi:10.1101/2023.04.30.538439 · Cited by 1,694
Cross-tissue immune cell analysis reveals tissue-specific features in humans
Domínguez Conde, C., Xu, C., Jarvis, L. B., Rainbow, D. B., Wells, S. B., Gomes, T., Howlett, S. K., Suchanek, O., Polanski, K., King, H. W., et al. (2022) · Science · doi:10.1126/science.abl5197 · Cited by 1,159
Self-citationBest practices for single-cell analysis across modalities
Heumos, L., Schaar, A. C., Lance, C., Litinetskaya, A., Drost, F., Zappia, L., Lücken, M. D., Strobl, D. C., Henao, J., Curion, F., et al. (2023) · Nature Reviews Genetics · doi:10.1038/s41576-023-00586-w · Cited by 1,051
“Failing to account for multiple sources of biological variability for experiments will inflate the FDR 90,91 .”
BackgroundSelf-citationAlzubaidi, L., Bai, J., Al-Sabaawi, A., Santamaría, J., Albahri, A. S., Al-dabbagh, B. S. N., Fadhel, M. A., Manoufali, M., Zhang, J., Al-Timemy, A. H., et al. (2023) · Journal of Big Data · doi:10.1186/s40537-023-00727-2 · Cited by 907
“High-level generalization is needed for the initially trained model, so new data can be adapted [128, 129, 219].”
Background
Metadata
- Authors
- Lotfollahi, M., Naghipourfar, M., Luecken, M. D., Khajavi, M., Büttner, M., Wagenstetter, M., Avsec, Ž., Gayoso, A., Yosef, N., Interlandi, M., Rybakov, S., Misharin, A. V., & Theis, F. J.
- Affiliations
- Helmholtz Munich (DE)
- Technical University of Munich (DE)
- University of California, Berkeley (US)
- Ragon Institute of MGH, MIT and Harvard (US)
- University of Münster (DE)
- Northwestern University (US)
- Corresponding author
- Theis, Fabian J.
- ORCID
- Venue
- Nature Biotechnology
- Published
- 2021-08-30
- Volume
- 40
- Issue
- 1
- Pages
- 121-130
- ISSN
- 0733-222X (ISSN-L)
- 1087-0156
- 1546-1696
- PMC
- PMC8763644
- OpenAlex
- W3196650609
- Cited by
- 602
- References
- 76
- Citations by year
- 2026: 130 · 2025: 144 · 2024: 146 · 2023: 116 · 2022: 57 · 2021: 7
- FWCI
- 26.29
- Type
- journal article
- Language
- en
- Open access
- hybrid
- doi.org
- Licence
- cc-by
- creativecommons.org/licenses/by/4.0 (tdm)
- creativecommons.org/licenses/by/4.0 (vor)
- Locations
- Nature Biotechnology (publishedVersion, cc-by)
- PubMed Central (publishedVersion, cc-by)
- PubMed (publishedVersion)
- PuSH - Publication Server of Helmholtz Zentrum München (submittedVersion, cc-by)
- eScholarship (California Digital Library) (submittedVersion)
- mediaTUM (Technical University of Munich) (submittedVersion, other-oa)
- Site cant be reached (submittedVersion, cc-by)
- Funders
- Deutsche Forschungsgemeinschaft (ZT-I-0007)
- Topics
- Life Sciences › Biochemistry, Genetics and Molecular Biology › Molecular Biology › Single-cell and spatial transcriptomics
- Life Sciences › Biochemistry, Genetics and Molecular Biology › Molecular Biology › Gene Regulatory Network Analysis
- Life Sciences › Biochemistry, Genetics and Molecular Biology › Molecular Biology › Bioinformatics and Genomic Networks
- Keywords
- transfer learning, single-cell data integration, batch effect correction, mouse brain atlas
- MeSH terms
- Deep Learning, COVID-19, SARS-CoV-2, Animals, Humans, Organ Specificity, Reference Standards, Mice, Single-Cell Analysis, Datasets as Topic
About these checks
Registry, retraction, Cites and statistics results are computed, not judged, with one exception: a printed reference that no index lists is read once by a model before it counts as a citation error. Claims are extracted by a model and kept only when their quote appears verbatim in the text; each cited source is then checked, with a model’s help, for whether it says what the claim relies on. Those verdicts can be wrong — read the claim’s quote and the cited source before relying on one.
Statistics and arithmetic are recomputed, not judged.
Confidence bands are shown only for fields calibrated on our annotated test set. None is calibrated yet, so no band is shown.
What counts as a claim ›How we measure confidence ›How we check this ›
Are you an author, or do you see a problem with this page? Request a review
How to cite
Cite CoChat for the checks on this page, and the paper for its own findings.
- This page
- CoChat. (2026). Citation check: Mapping single-cell data to reference atlases by transfer learning. https://app.cochat.ai/papers/10.1038/s41587-021-01001-7
- The paper
- Lotfollahi, M., Naghipourfar, M., Luecken, M. D., Khajavi, M., Büttner, M., Wagenstetter, M., Avsec, Ž., Gayoso, A., Yosef, N., Interlandi, M., Rybakov, S., Misharin, A. V., & Theis, F. J. (2022). Mapping single-cell data to reference atlases by transfer learning. Nature Biotechnology. https://doi.org/10.1038/s41587-021-01001-7
Data sources
Bibliographic data: Semantic Scholar, OpenAlex, Crossref.
Contains information from the Semantic Scholar Academic Graph Datasets, made available under the ODC Attribution License (ODC-BY 1.0).
Semantic Scholar’s data is described in: Kinney, R., et al. (2023). The Semantic Scholar Open Data Platform. arXiv:2301.10140.
