CoChat

High-plex protein and whole transcriptome co-mapping at cellular resolution with spatial CITE-seq

Open access

Published version of a preprint

The DOI matches its Crossref record; 27 of the 27 references it cites were found in a registry or an index.

Abstract

In this study, we extended co-indexing of transcriptomes and epitopes (CITE) to the spatial dimension and demonstrated high-plex protein and whole transcriptome co-mapping. We profiled 189 proteins and whole transcriptome in multiple mouse tissue types with spatial CITE sequencing and then further applied the method to measure 273 proteins and transcriptome in human tissues, revealing spatially distinct germinal center reactions in tonsil and early immune activation in skin at the Coronavirus Disease 2019 mRNA vaccine injection site.

Overview

The claims and statistics of this paper haven’t been checked yet.

Free: it reads the open-access text and checks the first 5 claims that cite a source we can check. Create a free account to check every claim.

A few free checks a day · papers already verified open instantly · results are public

Integrity signals

Registry

Crossref · 10.1038/s41587-023-01676-0

Cites

27 of 27 references verified0 citation errors · 0 not checkable

Statistics

Figures

Fig. 1 Spatial-CITE-seq workflow design and application to diverse mouse tissue types and human tonsil for co-mapping of proteins and whole transcriptome. a, Scheme of spatial-CITE-seq. A cocktail of ADTs is applied to a PFA-fixed tissue section to label a panel of ~200–300 protein markers in situ. Next, a set of DNA barcodes A1–A50 is flowed over the tissue surface in a spatially defined manner via parallel microchannels, and reverse transcription is carried out inside each channel for in-tissue synthesis of cDNAs complementary to endogenous mRNAs and introduced ADTs. Then, a set of DNA barcodes B1–B50 is introduced using another microfluidic device with microchannels perpendicular to the first flow direction and subsequently ligated to barcodes A1–A50, creating a 2D grid of tissue pixels, each of which has a unique spatial address code AB. Finally, barcoded cDNA is collected, purified, amplified and prepared for paired-end NGS sequencing. b, Spatially resolved 189-plex protein and whole transcriptome co-mapping of mouse spleen, colon, intestine and kidney tissue with 25-µm pixel size. Upper row: bright-field optical images of the tissue sections. Middle row: unsupervised clustering of all pixels based on all 189 protein markers only and projection onto the tissue images. Lower row: unsupervised clustering of whole transcriptome of all pixels and projection to the tissue images. Colors correspond to different proteomic or transcriptomic clusters indicated on the right side of each panel. c, Image of a human tonsil tissue section. The region mapped by spatial-CITE-seq is indicated by a dashed box. d, Per-pixel UMI count and protein count histograms. e, UMAP plot of the clustering analysis of all pixels based on 273 proteins only. f, Spatial distribution of the clusters (0–6) indicated by the same colors as in e. g, UMAP plot of the clustering analysis of all pixels based on the mRNA transcriptome. h, Spatial distribution of the transcriptomic clusters (0–5) indicated by the same colors as in g. Pixel size: 25 µm. i, Differentially expressed proteins in the clusters shown in c and d. j, Tissue image of the mapped region (left), spatial proteomic clusters (right) and the overlay (middle). k, Individual surface protein markers related to B cells and follicular DCs. l, Functional protein markers such as immunoglobulins showing spatially distinct distribution of GC B cells (IgM), matured B cells (IgG) and naive B cells (IgD), in agreement with B cell maturation, class switch and migration. m, Individual protein markers enriched in the extracellular region (CD90, Notch3) and crypt (Mac2). n, Individual T cell protein markers CD3, CD4 and CD45RA showing T cell zones and subtypes. o, Individual protein markers CD32, CD9 and CD171. CD32 identified a range of immune cells, including platelets, neutrophils, macrophages and DCs, trafficking from vasculature. CD9 identified plasma cell precursors in GCs and crypt. CD171, a neural cell adhesion molecule, is found highly distinct in the GC dark zone. Color key: protein expression from high to low.
Fig. 1 Spatial-CITE-seq workflow design and application to diverse mouse tissue types and human tonsil for co-mapping of proteins and whole transcriptome. a, Scheme of spatial-CITE-seq. A cocktail of ADTs is applied to a PFA-fixed tissue section to label a panel of ~200–300 protein markers in situ. Next, a set of DNA barcodes A1–A50 is flowed over the tissue surface in a spatially defined manner via parallel microchannels, and reverse transcription is carried out inside each channel for in-tissue synthesis of cDNAs complementary to endogenous mRNAs and introduced ADTs. Then, a set of DNA barcodes B1–B50 is introduced using another microfluidic device with microchannels perpendicular to the first flow direction and subsequently ligated to barcodes A1–A50, creating a 2D grid of tissue pixels, each of which has a unique spatial address code AB. Finally, barcoded cDNA is collected, purified, amplified and prepared for paired-end NGS sequencing. b, Spatially resolved 189-plex protein and whole transcriptome co-mapping of mouse spleen, colon, intestine and kidney tissue with 25-µm pixel size. Upper row: bright-field optical images of the tissue sections. Middle row: unsupervised clustering of all pixels based on all 189 protein markers only and projection onto the tissue images. Lower row: unsupervised clustering of whole transcriptome of all pixels and projection to the tissue images. Colors correspond to different proteomic or transcriptomic clusters indicated on the right side of each panel. c, Image of a human tonsil tissue section. The region mapped by spatial-CITE-seq is indicated by a dashed box. d, Per-pixel UMI count and protein count histograms. e, UMAP plot of the clustering analysis of all pixels based on 273 proteins only. f, Spatial distribution of the clusters (0–6) indicated by the same colors as in e. g, UMAP plot of the clustering analysis of all pixels based on the mRNA transcriptome. h, Spatial distribution of the transcriptomic clusters (0–5) indicated by the same colors as in g. Pixel size: 25 µm. i, Differentially expressed proteins in the clusters shown in c and d. j, Tissue image of the mapped region (left), spatial proteomic clusters (right) and the overlay (middle). k, Individual surface protein markers related to B cells and follicular DCs. l, Functional protein markers such as immunoglobulins showing spatially distinct distribution of GC B cells (IgM), matured B cells (IgG) and naive B cells (IgD), in agreement with B cell maturation, class switch and migration. m, Individual protein markers enriched in the extracellular region (CD90, Notch3) and crypt (Mac2). n, Individual T cell protein markers CD3, CD4 and CD45RA showing T cell zones and subtypes. o, Individual protein markers CD32, CD9 and CD171. CD32 identified a range of immune cells, including platelets, neutrophils, macrophages and DCs, trafficking from vasculature. CD9 identified plasma cell precursors in GCs and crypt. CD171, a neural cell adhesion molecule, is found highly distinct in the GC dark zone. Color key: protein expression from high to low.CC BY · PubMed Central
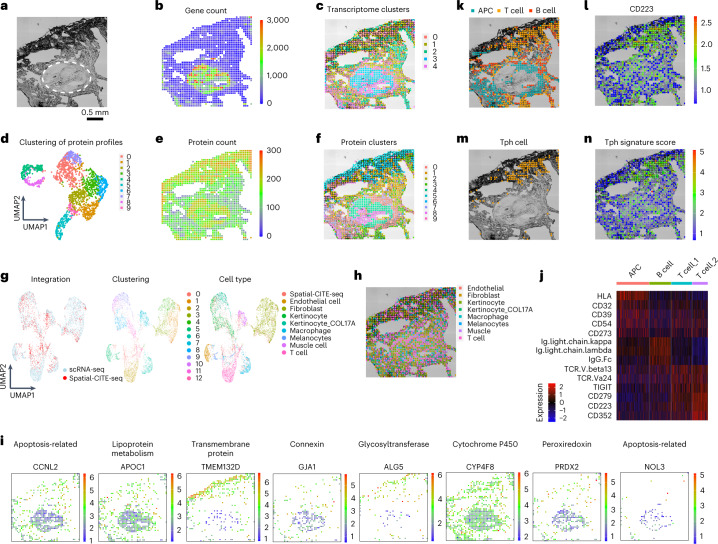
Fig. 2 Integrated spatial and single-cell profiling of a human skin biopsy tissue at the site of COVID-19 mRNA vaccination injection revealed localized peripheral T cell activation. a, Bright-field image of skin section in the mapped region. A pilosebaceous unit is indicated by the dashed region. b, Gene count spatial map. c, Spatial clustering of all pixels based on whole transcriptome. Despite low gene count in the low cell density regions of dermal collagen, the clustering analysis revealed spatially distinct zones based on transcriptomic profiles. d, UMAP clustering of all 273 proteins. e, Protein count distribution. f, Spatial clustering of all pixels based on 273 proteins only, which is in high concordance with spatial clusters identified by spatial transcriptome co-mapped on the same tissue section. g, Integrated analysis of single-cell and spatial transcriptome. Left: The transcriptomes of spatial tissue pixels (red) conform to the clusters identified by joint analysis with scRNA-seq (blue). Middle: unsupervised clustering of the combined transcriptome dataset. Right: cell type annotation. i, Visualization of select genes associated with different gene oncology functions via integrated analysis and transfer learning. j, Differential protein expression in different cell types (APC, B cell and two subtypes of T cells). k, Spatial distribution of APCs, T cells and B cells. l, Expression of CD223 (LAG3) protein, a functional marker of activated T cells and other immune cell subsets. m, Identification of a highly localized population of Tph cells at the vaccine injection site. n, Spatial distribution of Tph gene score correlates with the cell localization. Pixel size: 25 µm.
Fig. 2 Integrated spatial and single-cell profiling of a human skin biopsy tissue at the site of COVID-19 mRNA vaccination injection revealed localized peripheral T cell activation. a, Bright-field image of skin section in the mapped region. A pilosebaceous unit is indicated by the dashed region. b, Gene count spatial map. c, Spatial clustering of all pixels based on whole transcriptome. Despite low gene count in the low cell density regions of dermal collagen, the clustering analysis revealed spatially distinct zones based on transcriptomic profiles. d, UMAP clustering of all 273 proteins. e, Protein count distribution. f, Spatial clustering of all pixels based on 273 proteins only, which is in high concordance with spatial clusters identified by spatial transcriptome co-mapped on the same tissue section. g, Integrated analysis of single-cell and spatial transcriptome. Left: The transcriptomes of spatial tissue pixels (red) conform to the clusters identified by joint analysis with scRNA-seq (blue). Middle: unsupervised clustering of the combined transcriptome dataset. Right: cell type annotation. i, Visualization of select genes associated with different gene oncology functions via integrated analysis and transfer learning. j, Differential protein expression in different cell types (APC, B cell and two subtypes of T cells). k, Spatial distribution of APCs, T cells and B cells. l, Expression of CD223 (LAG3) protein, a functional marker of activated T cells and other immune cell subsets. m, Identification of a highly localized population of Tph cells at the vaccine injection site. n, Spatial distribution of Tph gene score correlates with the cell localization. Pixel size: 25 µm.CC BY · PubMed Central
Extended Data Fig. 1 Spatial-CITE-seq design and detailed workflow. (a) ADT structure. The oligo labelled to the antibody has three functional regions: PCR handle (21 bp), antibody barcode (15 bp) and poly-A region (32 bp). (b) ADTs and mRNA with Poly-A region at the 3′ end can be reverse transcribed into cDNA using Barcode A as the RT primer. Barcode A consists of three functional regions, the poly-T region, spatial barcode region and the ligation region. During the first flow, 50 Barcode As were loaded into 50 parallel channels and the RT reaction was carried out inside each isolated channel (Step 1&2). After peeling off the 1st PDMS, a 2nd PDMS was attached. The in-channel ligation was performed with injecting 50 Barcode Bs into each of the 50 channels which are perpendicular to the channels of 1st PDMS chip (Step 3). Barcode B has four functional regions: ligation region, barcode region, UMI region and PCR handle region. Barcode B was also 5′ biotin modification. After ligation, tissue was lysed, and cDNAs were purified with streptavidin beads. The cDNAs on the beads were templated switched with template switch oligo (Step 4). PCR was used to amplify the cDNA (Step 5). The products were split into two portions, the mRNA derived cDNAs and the ADT derived cDNAs. The library was then built separately. More details were in the method section.
Extended Data Fig. 1 Spatial-CITE-seq design and detailed workflow. (a) ADT structure. The oligo labelled to the antibody has three functional regions: PCR handle (21 bp), antibody barcode (15 bp) and poly-A region (32 bp). (b) ADTs and mRNA with Poly-A region at the 3′ end can be reverse transcribed into cDNA using Barcode A as the RT primer. Barcode A consists of three functional regions, the poly-T region, spatial barcode region and the ligation region. During the first flow, 50 Barcode As were loaded into 50 parallel channels and the RT reaction was carried out inside each isolated channel (Step 1&2). After peeling off the 1st PDMS, a 2nd PDMS was attached. The in-channel ligation was performed with injecting 50 Barcode Bs into each of the 50 channels which are perpendicular to the channels of 1st PDMS chip (Step 3). Barcode B has four functional regions: ligation region, barcode region, UMI region and PCR handle region. Barcode B was also 5′ biotin modification. After ligation, tissue was lysed, and cDNAs were purified with streptavidin beads. The cDNAs on the beads were templated switched with template switch oligo (Step 4). PCR was used to amplify the cDNA (Step 5). The products were split into two portions, the mRNA derived cDNAs and the ADT derived cDNAs. The library was then built separately. More details were in the method section.CC BY · PubMed Central
Extended Data Fig. 2 Spatial mapping of mouse spleen, colon, intestine and kidney with Spatial-CITE-seq. A 189 antibodies cocktail was used for all four mouse samples. The bright field image, spatial gene heatmap, spatial gene UMI heatmap, spatial protein heatmap and spatial protein UMI heatmap of spleen (a), colon (b), intestine (c) and kidney (d). (e) gene and gene UMI count per pixel of all four mouse samples. The box plots were derived from n = 2500 spatial pixels. The boxplot ranges from the first to the third quartile with the median value shown as the middle line, and whiskers represent 1.5× the interquartile range. (f) Protein and protein UMI count per pixel of all four mouse samples. (g) Transcriptome sequencing saturation curve of mouse spleen and human tonsil.
Extended Data Fig. 2 Spatial mapping of mouse spleen, colon, intestine and kidney with Spatial-CITE-seq. A 189 antibodies cocktail was used for all four mouse samples. The bright field image, spatial gene heatmap, spatial gene UMI heatmap, spatial protein heatmap and spatial protein UMI heatmap of spleen (a), colon (b), intestine (c) and kidney (d). (e) gene and gene UMI count per pixel of all four mouse samples. The box plots were derived from n = 2500 spatial pixels. The boxplot ranges from the first to the third quartile with the median value shown as the middle line, and whiskers represent 1.5× the interquartile range. (f) Protein and protein UMI count per pixel of all four mouse samples. (g) Transcriptome sequencing saturation curve of mouse spleen and human tonsil.CC BY · PubMed Central
Extended Data Fig. 3 Immunostaining validation of spatial protein profiles. Sequential IF staining of human tonsil on COMET™ using the FFeX technology previously described by Lunaphore Technologies. Note: the data obtained is not from the same sample. Scale bar = 1 mm for all images. The experiment was from reference and was completed only once.
Extended Data Fig. 3 Immunostaining validation of spatial protein profiles. Sequential IF staining of human tonsil on COMET™ using the FFeX technology previously described by Lunaphore Technologies. Note: the data obtained is not from the same sample. Scale bar = 1 mm for all images. The experiment was from reference and was completed only once.CC BY · PubMed Central
Extended Data Fig. 4 Comparison with single cell CITE-seq and immunofluorescence imaging (mIF). (a) Multiplex immunofluorescence imaging of 6 select proteins of an adjacent tissue section (human tonsil) and comparison with the protein expression map from spatial-CITE-seq. Color key: protein expression from high to low. The image was taken without repeats. (b) Person correlation analysis of pseudo bulk data generated from Spatial-CITE-seq and scCITE-seq data of human tonsil; The fitted linear regression line is in blue color and the 95% confidence interval was shown in gray color. (c) Integration analysis of Spatial-CITE-seq and scCITE-seq data from human tonsil.
Extended Data Fig. 4 Comparison with single cell CITE-seq and immunofluorescence imaging (mIF). (a) Multiplex immunofluorescence imaging of 6 select proteins of an adjacent tissue section (human tonsil) and comparison with the protein expression map from spatial-CITE-seq. Color key: protein expression from high to low. The image was taken without repeats. (b) Person correlation analysis of pseudo bulk data generated from Spatial-CITE-seq and scCITE-seq data of human tonsil; The fitted linear regression line is in blue color and the 95% confidence interval was shown in gray color. (c) Integration analysis of Spatial-CITE-seq and scCITE-seq data from human tonsil.CC BY · PubMed Central
Extended Data Fig. 5 Spatial mapping of human spleen and thymus with Spatial-CITE-seq. A 273 antibodies cocktail was used for all four human samples. The bright field image, spatial gene heatmap, spatial gene UMI heatmap, spatial protein heatmap, spatial protein UMI heatmap, spatial clustering (based protein) and spatial clustering (based on RNA) of spleen (a) and thymus (b). (c) gene and gene UMI count per pixel of all four human samples. (d) Protein and protein UMI count per pixel of all four human samples. The box plots were derived from n = 2500 spatial pixels. The boxplot ranges from the first to the third quartile with the median value shown as the middle line, and whiskers represent 1.5× the interquartile range.
Extended Data Fig. 5 Spatial mapping of human spleen and thymus with Spatial-CITE-seq. A 273 antibodies cocktail was used for all four human samples. The bright field image, spatial gene heatmap, spatial gene UMI heatmap, spatial protein heatmap, spatial protein UMI heatmap, spatial clustering (based protein) and spatial clustering (based on RNA) of spleen (a) and thymus (b). (c) gene and gene UMI count per pixel of all four human samples. (d) Protein and protein UMI count per pixel of all four human samples. The box plots were derived from n = 2500 spatial pixels. The boxplot ranges from the first to the third quartile with the median value shown as the middle line, and whiskers represent 1.5× the interquartile range.CC BY · PubMed Central
Extended Data Fig. 6 Spatial profiling of human skin biopsy tissue collected from the COVID-19 mRNA vaccine injection site. Spatial heatmap of gene (a), gene UMI (b), protein (c) and protein UMI (d). (e) Expression heatmap of the 10 clusters identified in skin biopsy sample. (f) the individual clusters plotted. (g) spatial distribution of some representative proteins.
Extended Data Fig. 6 Spatial profiling of human skin biopsy tissue collected from the COVID-19 mRNA vaccine injection site. Spatial heatmap of gene (a), gene UMI (b), protein (c) and protein UMI (d). (e) Expression heatmap of the 10 clusters identified in skin biopsy sample. (f) the individual clusters plotted. (g) spatial distribution of some representative proteins.CC BY · PubMed Central
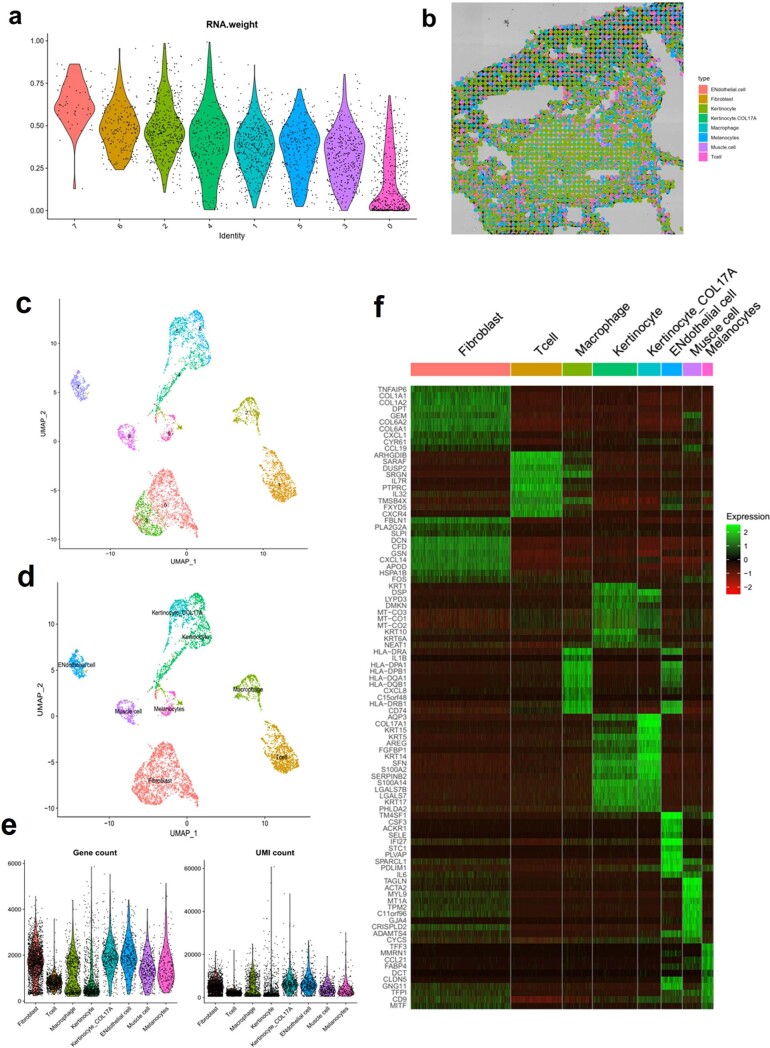
Extended Data Fig. 7 scRNA-seq sequencing data of skin biopsy sample and weighted-nearest neighbor analysis and deconvolution of Spatial CITE-seq data. (a) The modality weights that were learned for each cluster. Most of the clusters were weighed heavily on protein. (b) The spatial Pi chart generated using Spotlight package. The single cell reference was obtained from the same skin block. (c) spatial clusters of scRNA-seq data. (d) annotated cell types using canonical marker genes. (e) violin plot of genes and UMIs for each cell type. (f) Expression heatmap of different cell types.
Extended Data Fig. 7 scRNA-seq sequencing data of skin biopsy sample and weighted-nearest neighbor analysis and deconvolution of Spatial CITE-seq data. (a) The modality weights that were learned for each cluster. Most of the clusters were weighed heavily on protein. (b) The spatial Pi chart generated using Spotlight package. The single cell reference was obtained from the same skin block. (c) spatial clusters of scRNA-seq data. (d) annotated cell types using canonical marker genes. (e) violin plot of genes and UMIs for each cell type. (f) Expression heatmap of different cell types.CC BY · PubMed Central

Verification

Claims the paper makes

The claims and statistics of this paper haven’t been checked yet.

Free: it reads the open-access text and checks the first 5 claims that cite a source we can check. Create a free account to check every claim.

A few free checks a day · papers already verified open instantly · results are public

Claims other papers make about this one

Each is checked against this paper’s own text: does it say what the citing paper says it does?

Self-check

Percentages, sums and reported differences re-computed from the paper’s own numbers.

The self-check needs the paper’s full text.

Citations

Cites

Show all 27 references

Cited by

See all 418

Metadata

Authors
Liu, Y., DiStasio, M., Su, G., Asashima, H., Enninful, A., Qin, X., Deng, Y., Nam, J., Gao, F., Bordignon, P., Cassano, M., Tomayko, M., Xu, M., Halene, S., Craft, J. E., Hafler, D., & Fan, R.
Affiliations
  • Yale Cancer Center (US)
  • Yale University (US)
Corresponding author
Fan, Rong
Venue
Nature Biotechnology
Published
2023-02-23
Volume
41
Issue
10
Pages
1405-1409
ISSN
  • 0733-222X (ISSN-L)
  • 1087-0156
  • 1546-1696
OpenAlex
W4321611267
Cited by
418
References
27
Citations by year
2026: 137 · 2025: 157 · 2024: 74 · 2023: 42
FWCI
36.22
Type
journal article
Language
en
Open access
Licence
Locations
  • Nature Biotechnology (publishedVersion, cc-by)
  • Research Square (acceptedVersion, cc-by)
  • PubMed Central (publishedVersion, cc-by)
  • PubMed (publishedVersion)
  • PubMed Central (submittedVersion, cc-by)
Funders
U.S. Department of Health & Human Services | National Institutes of Health (U54AG076043, R01CA245313, R01MH128876)
Topics
  • Life Sciences › Biochemistry, Genetics and Molecular Biology › Molecular Biology › Single-cell and spatial transcriptomics
  • Life Sciences › Biochemistry, Genetics and Molecular Biology › Cell Biology › Biotin and Related Studies
  • Life Sciences › Biochemistry, Genetics and Molecular Biology › Molecular Biology › Genomics and Phylogenetic Studies
Keywords
spatial transcriptomics, cellular resolution, germinal center, tonsil

About these checks

Registry, retraction, Cites and statistics results are computed, not judged, with one exception: a printed reference that no index lists is read once by a model before it counts as a citation error. Claims are extracted by a model and kept only when their quote appears verbatim in the text; each cited source is then checked, with a model’s help, for whether it says what the claim relies on. Those verdicts can be wrong — read the claim’s quote and the cited source before relying on one.

Statistics and arithmetic are recomputed, not judged.

Confidence bands are shown only for fields calibrated on our annotated test set. None is calibrated yet, so no band is shown.

What counts as a claim ›How we measure confidence ›How we check this ›

Are you an author, or do you see a problem with this page? Request a review

How to cite

Cite CoChat for the checks on this page, and the paper for its own findings.

This page
CoChat. (2026). Citation check: High-plex protein and whole transcriptome co-mapping at cellular resolution with spatial CITE-seq. https://app.cochat.ai/papers/10.1038/s41587-023-01676-0
The paper
Liu, Y., DiStasio, M., Su, G., Asashima, H., Enninful, A., Qin, X., Deng, Y., Nam, J., Gao, F., Bordignon, P., Cassano, M., Tomayko, M., Xu, M., Halene, S., Craft, J. E., Hafler, D., & Fan, R. (2023). High-plex protein and whole transcriptome co-mapping at cellular resolution with spatial CITE-seq. Nature Biotechnology. https://doi.org/10.1038/s41587-023-01676-0

Data sources

Bibliographic data: Semantic Scholar, OpenAlex, Crossref.

Contains information from the Semantic Scholar Academic Graph Datasets, made available under the ODC Attribution License (ODC-BY 1.0).

Semantic Scholar’s data is described in: Kinney, R., et al. (2023). The Semantic Scholar Open Data Platform. arXiv:2301.10140.