

The DOI matches its Crossref record; 76 of the 77 references it cites were found in a registry or an index; 59 of the 70 sources its claims cite were checked for support.
Astrocyte transcriptomic changes along the spatiotemporal progression of Alzheimer’s disease
Open accessPublished version of a preprint
Abstract
Abstract Astrocytes play a critical role in brain homeostasis and normal functions but their changes along the spatiotemporal progression of Alzheimer’s disease (AD) neuropathology remain largely unknown. Here we performed single-nucleus RNA-sequencing on brain regions along the stereotypical progression of AD pathology from donors ranging the entire normal aging-AD continuum comprising 628,943 astrocyte nuclei from 32 donors across 5 brain regions. We discovered temporal gene-expression-trajectories with gene sets differentially activated at various disease stages. Surprisingly, a gene set enriched in proteostasis and energy metabolism, was upregulated in late-stage but unexpectedly returned to baseline levels in end-stage, suggesting exhaustion of response in “burnt-out” astrocytes. The spatial gene-expression-trajectories revealed that astrocytic genes of tripartite synapses are dysregulated in parallel to the stereotypical progression of tangle pathology across regions. We identified astrocyte heterogeneity across brain regions with a continuum from homeostatic to reactive cells through “intermediate” transitional states. These findings suggest complex astrocytic dysfunction in AD neurodegeneration.
Overview
AI snapshot
Written from the paper’s full text.
TL;DR
Single-nucleus RNA sequencing of 628,943 astrocyte nuclei from five brain regions across 32 donors spanning normal aging to severe Alzheimer’s disease maps spatial and temporal astrocyte transcriptomic changes. The study identifies homeostatic, intermediate, reactive, trophic factor-rich, and exhausted astrocyte subclusters, with late-stage response exhaustion at Braak stage VI.
Key findings
- The dataset comprised 628,943 astrocyte nuclei from five regions (EC, ITG, PFC, V2, V1) in 32 donors, with >100,000 nuclei per region and ≈6,000 average reads and ≈2,500 average genes detected per nucleus.
- In eight normal-aging control donors, EC and V1 had the most differentially expressed genes versus other regions (EC: 137 up, 152 down; V1: 93 up, 122 down); only 18 of 137 EC-upregulated and 37 of 152 EC-downregulated genes correlated with pTau/tau ratio, supporting an allocortex-specific signature distinct from a pTau signature.
- Spatial analysis identified 504 DEGs between adjacent AD-network nodes grouped into six spatial gene sets; temporal analysis identified 798 DEGs between adjacent pathology stages grouped into six temporal gene sets. Homeostatic, intermediate, and reactive astrocyte proportions changed along the spatial axis, whereas astMet and astTinf changed along the temporal axis; astTinf declined along pathology stages, while astMet increased in late stage and returned toward baseline in end stage, suggesting exhaustion.
- Clustering revealed nine astrocyte subclusters, including astH0, astIM, astR0/R1/R2, astMet, astTinf, and two likely doublet clusters (astNeu, astMic); reactive astrocytes represented less than 25% of nuclei. Pseudotime and CellRank supported astH0→astIM→astR transitions and off-pathway terminal astMet/astTinf states; comparison with nine public datasets found astTinf in all but one, but sizable astMet only in SEA-AD, with no significant astMet frequency change across Braak stages in those datasets.
Methods
- Frozen postmortem brain specimens from 32 donors were processed with fluorescence-activated nuclei sorting to deplete NeuN-positive neurons and OLIG2-positive oligodendrocytes, followed by 10x Genomics snRNA-seq of five cortical regions; donors were grouped into four pathology stages using CERAD neuritic plaque score, Braak NFT stage, 3D6 Aβ immunohistochemistry, and pTau/tau ELISA.
- Bioinformatics included Cell Ranger alignment, Seurat integration, differential expression, spectral clustering into spatial and temporal gene sets, Harmony-based astrocyte subclustering, monocle3 pseudotime, velocyto/scVelo/CellRank RNA velocity, and label transfer to nine public snRNA-seq datasets.
- Validation used immunohistochemistry and multiplex fluorescence for AQP4, GJA1, and reactive markers around Thioflavin-S plaques, plus RNAScope in situ hybridization for MAPT and HSPB1/ALDH1L1.
Limitations
- The paper states that no randomization was performed, no statistical methods were used to predetermine sample sizes, and data collection/analysis were not blinded to neuropathological diagnosis.
- The paper notes higher interdonor variability in temporal gene sets, possibly reflecting differences in stage duration across donors, and that the astMet exhaustion phenomenon was unique to this dataset and not significant across Braak stages in the nine public datasets.
- Evident from the text: the cross-sectional autopsy design cannot directly establish temporal ordering or causality, pathology stages are assumed to be temporally ordered, and per-stage donor numbers are small (8 donors per stage in Table 1), with some region-stage combinations missing (for example, n = 22 EC versus n = 32 V1 samples in Fig. 6a).
Model-written summary. Check it against the paper before relying on it.
Integrity signals
Registry
Cites
Statistics
Figures
Verification
Claims the paper makes
104 Own result · 50 Own interpretation · 20 Own method · 14 Partly supported · 7 Supported · 4 Supported so far · 3 No basis given · 1 Mixed support · 1 No full text of the sources · 1 Not checked yet · accuracy not yet measured
The cited sources support only part of this claim — read each source’s verdict below.
In the paper
“but less is known about the transcriptomic heterogeneity of astrocytes across different cortical areas in the aging human brain.”
§ Astrocyte transcriptomic changes along the spatiotemporal progression of Alzheimer’s disease > Results > Regional heterogeneity of astrocyte transcriptome in the normal aging brain
What the sources say
- Could not verifycites [8] Endo, F. et al. Molecular basis of astrocyte diversity and morphology across the CNS in health and disease. Science 378, eadc9020 (2022). sourceExperimental — accuracy not yet measured
The Strategy and Bioinformatic evaluation of astrocyte diversity sections describe transcriptomic comparisons across adult mouse CNS regions, including cortical areas. Our copy does not state whether transcriptomic heterogeneity across cortical areas in the aging human brain is less well understood; searches for human aging and cortical heterogeneity found no passage addressing that knowledge gap. (LLM, conf=0.75)
- Partly supportedcites [25] Morel, L. et al. Molecular and functional properties of regional astrocytes in the adult brain. J. Neurosci. 37, 8706–8717 (2017). sourceExperimental — accuracy not yet measured
The Introduction (page not provided) says earlier in vivo astrocyte gene profiling largely focused on the cortex or developing ages, and that regional human-brain datasets were not astrocyte-specific. This supports a general knowledge gap, but the paper studies adult mice and does not establish the claim specifically for different cortical areas in the aging human brain. (LLM, conf=0.86)
- Partly supportedcites [26] John Lin, C. C. et al. Identification of diverse astrocyte populations and their malignant analogs. Nat. Neurosci. 20, 396–405 (2017). sourceExperimental — accuracy not yet measured
The Discussion (page unavailable) says astrocyte diversity in the adult brain remained poorly understood, supporting the general knowledge-gap claim. But the study characterizes adult mouse brain regions, not different cortical areas in the aging human brain; its human evidence is limited to a comparison with human astrocyte gene signatures. (LLM, conf=0.84)
- Partly supportedcites [27] Chai, H. et al. Neural circuit-specialized astrocytes: transcriptomic, proteomic, morphological, and functional evidence. Neuron 95, 531–549 (2017). sourceExperimental — accuracy not yet measured
The Introduction says astrocyte diversity remains incompletely tested, while noting emerging evidence in aging and disease. The Results examine transcriptomic differences between the striatum and hippocampus of adult mice; the paper does not establish the specific knowledge gap concerning different cortical areas in the aging human brain. Page numbers are unavailable in our copy. (LLM, conf=0.85)
- Partly supportedcites [28] Clarke, L. E. et al. Normal aging induces A1-like astrocyte reactivity. Proc. Natl Acad. Sci. USA 115, E1896–E1905 (2018). sourceExperimental — accuracy not yet measured
The Discussion (A1-Like Reactive Astrocytes Appear with Normal Brain Aging; page unavailable) says the study did not characterize astrocytes in detail throughout all cortical regions and calls for further work. This supports a knowledge gap across cortical areas, but the study examined mice, not the aging human brain, and its cortical-region caveat concerns reactivity rather than transcriptomic heterogeneity specifically. (LLM, conf=0.83)
- Partly supportedcites [29] Zeisel, A. et al. Molecular architecture of the mouse nervous system. Cell 174, 999–1014 (2018). sourceExperimental — accuracy not yet measured
The Results section, “Astroependymal Cells Are Diverse and Spatially Patterned” (page not provided), describes limited historical understanding of astrocyte diversity and identifies regionally distinct astrocytes in mice. It does not assess how much is known about transcriptomic differences across cortical areas in the aging human brain. (LLM, conf=0.76)
- Partly supportedcites [30] Boisvert, M. M., Erikson, G. A., Shokhirev, M. N. & Allen, N. J. The aging astrocyte transcriptome from multiple regions of the mouse brain. Cell Rep. 22, 269–285 (2018). sourceExperimental — accuracy not yet measured
The Introduction describes limited prior work on astrocyte changes in aging, and the Results section “Adult Cortical Astrocytes Show Region-Dependent Gene Expression” documents transcriptomic differences across mouse cortical areas. The paper studies mice and does not specifically assess how much is known about those differences across cortical areas in the aging human brain. (LLM, conf=0.80)
- Partly supportedcites [31] Batiuk, M. Y. et al. Identification of region-specific astrocyte subtypes at single cell resolution. Nat. Commun. 11, 1220 (2020). sourceExperimental — accuracy not yet measured
The Results report transcriptomic heterogeneity between and within regions of the adult mouse brain, and the Introduction notes evidence for region-specific astrocyte subtypes in human tissue. Neither passage establishes how much is known about differences across cortical areas in the aging human brain; the paper's own single-cell analysis is in mice. (LLM, conf=0.77)
- Partly supportedcites [32] Allen, W. E., Blosser, T. R., Sullivan, Z. A., Dulac, C. & Zhuang, X. Molecular and spatial signatures of mouse brain aging at single-cell resolution. Cell 186, 194–208 (2023). sourceExperimental — accuracy not yet measured
The Results report spatial differences in aging-related astrocyte gene expression, but the measurements are from mouse brain regions, not human cortical areas. The Discussion proposes future spatial transcriptomic measurements in humans, suggesting a broader knowledge gap; it does not specifically establish what is known about astrocyte heterogeneity across human cortical areas. No page numbers are available in our copy. (LLM, conf=0.77)
plain- Asserted: passes — The authors put it forward as true.
- Checkable: passes — It can be checked against evidence.
- Load-bearing: passes — The paper’s conclusions depend on it.
- Based: passes — The paper gives a reason why it holds.
- Could not verify
The cited sources support only part of this claim — read each source’s verdict below.
In the paper
“consistent with the stereotypical hierarchical accumulation of NFTs along neural networks20,21”
§ Astrocyte transcriptomic changes along the spatiotemporal progression of Alzheimer’s disease > Results > A molecular survey of astrocytes in five brain regions affected stereotypically in AD
What the sources say
- Not checked — no full text of the sourcecites [20] Braak, H. & Braak, E. Neuropathological staging of Alzheimer-related changes. Acta Neuropathol. 82, 239–259 (1991). source
- Partly supportedcites [21] Braak, H., Alafuzoff, I., Arzberger, T., Kretzschmar, H. & Del Tredici, K. Staging of Alzheimer disease-associated neurofibrillary pathology using paraffin sections and immunocytochemistry. Acta Neuropathol. 112, 389–404 (2006). sourceExperimental — accuracy not yet measured
The staging system section describes a predictable sequence of neurofibrillary lesions across six stages, supporting the claim of stereotypical, hierarchical accumulation. It does not establish that accumulation occurs along neural networks; it describes the anatomical distribution of lesions instead. The pTau/tau ratio is the citing authors’ framing, not a finding attributed to this source by the cited sentence. (LLM, conf=0.82)
plaincorrelational- Asserted: passes — The authors put it forward as true.
- Checkable: passes — It can be checked against evidence.
- Load-bearing: unclear — It is unclear whether the paper’s conclusions depend on it.
- Based: passes — The paper gives a reason why it holds.
The cited sources support only part of this claim — read each source’s verdict below.
In the paper
“downregulation of SLC1A2 is predicted to increase the excitability of glutamatergic neurons38”
§ Astrocyte transcriptomic changes along the spatiotemporal progression of Alzheimer’s disease > Discussion
What the sources say
- Partly supportedcites [38] Ortinski, P. I. et al. Selective induction of astrocytic gliosis generates deficits in neuronal inhibition. Nat. Neurosci. 13, 584–591 (2010). sourceExperimental — accuracy not yet measured
The Results section, “Virus-induced astrocytosis alters network excitability” (page unavailable), reports hippocampal network hyperexcitability following reactive gliosis. But it attributes that effect to impaired inhibition associated with reduced glutamine synthetase, not to SLC1A2 downregulation. The paper does not establish the claimed SLC1A2-to-excitability link. (LLM, conf=0.82)
hedgedconditional- Asserted: passes — The authors put it forward as true.
- Checkable: passes — It can be checked against evidence.
- Load-bearing: passes — The paper’s conclusions depend on it.
- Based: passes — The paper gives a reason why it holds.
- Partly supported
Every source the paper cites for this claim was checked and supports it.
In the paper
“an increase in SLC1A2 expression in EC astrocytes has been associated with resilience to AD pathology37”
§ Astrocyte transcriptomic changes along the spatiotemporal progression of Alzheimer’s disease > Discussion
What the sources say
- Supportedcites [37] Kobayashi, E. et al. Activated forms of astrocytes with higher GLT-1 expression are associated with cognitive normal subjects with Alzheimer pathology in human brain. Sci. Rep. 8, 1712 (2018). source
The Discussion (page not provided) associates higher GLT-1 expression in entorhinal cortex (EC) astrocytes with maintained cognitive function despite AD pathology. The Results also report higher GLT-1 mRNA expression in the EC of subjects with AD pathology but no dementia than in those with dementia. The paper uses the name GLT-1 rather than SLC1A2. (LLM, conf=0.89)
plaincorrelational- Asserted: passes — The authors put it forward as true.
- Checkable: passes — It can be checked against evidence.
- Load-bearing: passes — The paper’s conclusions depend on it.
- Based: passes — The paper gives a reason why it holds.
- Supported
The cited sources support only part of this claim — read each source’s verdict below.
In the paper
“further suggesting a synergistic effect of Aβ and pTau on the astrocyte transcriptome5”
§ Astrocyte transcriptomic changes along the spatiotemporal progression of Alzheimer’s disease > Discussion
What the sources say
- Partly supportedcites [5] Jiwaji, Z. et al. Reactive astrocytes acquire neuroprotective as well as deleterious signatures in response to Tau and Aβ pathology. Nat. Commun. 13, 135 (2022). sourceExperimental — accuracy not yet measured
The Results section, “A core signature of astrocytic genes regulated by both Tau and Aß pathology” (Fig. 3A; page not provided), reports overlapping astrocyte gene-expression changes in separate tauopathy and amyloidopathy mouse models. It does not establish that Aß and phosphorylated tau act synergistically on the astrocyte transcriptome. (LLM, conf=0.86)
hedgeddirect- Asserted: passes — The authors put it forward as true.
- Checkable: passes — It can be checked against evidence.
- Load-bearing: passes — The paper’s conclusions depend on it.
- Based: passes — The paper gives a reason why it holds.
- Partly supported
Every source the paper cites for this claim was checked and supports it.
In the paper
“AstMet was not enriched in senescence genes34 (P ≥ 0.4)”
§ Astrocyte transcriptomic changes along the spatiotemporal progression of Alzheimer’s disease > Results > Dynamic transcriptomic changes in astrocyte subclusters along AD progression
What the sources say
- Supportedcites [34] Dehkordi, S. K. et al. Profiling senescent cells in human brains reveals neurons with CDKN2D/p19 and tau neuropathology. Nat. Aging 1, 1107–1116 (2021). source
The citation is attached to “senescence genes,” not to the citing authors’ AstMet enrichment result. In the paper’s eigengene description (page unavailable), the source defines three senescence-associated gene sets—CSP, SIP and SRP—so it supports the cited gene-set identification. It does not report the AstMet P value. (LLM, conf=0.88)
plain- Asserted: passes — The authors put it forward as true.
- Checkable: passes — It can be checked against evidence.
- Load-bearing: passes — The paper’s conclusions depend on it.
- Based: passes — The paper gives a reason why it holds.
- Supported
The sources with a verdict support this claim; the rest weren’t checked yet, have no full text we could read, or their verdicts aren’t rated yet.
In the paper
“white matter fibrous astrocytes are markedly different from protoplasmic cortical astrocytes40,41”
§ Astrocyte transcriptomic changes along the spatiotemporal progression of Alzheimer’s disease > Discussion
What the sources say
- Not checked — no full text of the sourcecites [40] Köhler, S., Winkler, U. & Hirrlinger, J. Heterogeneity of astrocytes in grey and white matter. Neurochem. Res. 46, 3–14 (2021). source
- Supportedcites [41] Allen, D. E. et al. Fate mapping of neural stem cell niches reveals distinct origins of human cortical astrocytes. Science 376, 1441–1446 (2022). source
The Discussion (page not specified) says the study identified molecular distinctions between white-matter and gray-matter astrocytes. The Molecular characterization section reports 445 differentially enriched genes between the astrocyte morphotypes studied, supporting the claim of substantial differences; the References identify fibrous and protoplasmic astrocytes with white and gray matter, respectively. (LLM, conf=0.88)
plain- Asserted: passes — The authors put it forward as true.
- Checkable: passes — It can be checked against evidence.
- Load-bearing: passes — The paper’s conclusions depend on it.
- Based: passes — The paper gives a reason why it holds.
The cited sources support only part of this claim — read each source’s verdict below.
In the paper
“may have confounded previous studies that compared only control and severe AD donors or grouped late- and end-stage donors (Braak stage V/VI) together9–15”
§ Astrocyte transcriptomic changes along the spatiotemporal progression of Alzheimer’s disease > Discussion
What the sources say
- Could not verifycites [9] Mathys, H. et al. Single-cell transcriptomic analysis of Alzheimer’s disease. Nature 570, 332–337 (2019). sourceExperimental — accuracy not yet measured
The ‘Cell-type-specific changes during pathological progression’ section distinguishes early from late AD pathology and reports different transcriptional changes, but does not identify an exhausted phase or say it confounded earlier studies. Searches for ‘exhausted phase,’ control-versus-severe comparisons, and grouping of Braak V/VI donors found no passage addressing that attribution. (LLM, conf=0.75)
- Not checked — no full text of the sourcecites [10] Grubman, A. et al. A single-cell atlas of entorhinal cortex from individuals with Alzheimer’s disease reveals cell-type-specific gene expression regulation. Nat. Neurosci. 22, 2087–2097 (2019). source
- Partly supportedcites [11] Zhou, Y. et al. Human and mouse single-nucleus transcriptomics reveal TREM2-dependent and TREM2-independent cellular responses in Alzheimer’s disease. Nat. Med. 26, 131–142 (2020). sourceExperimental — accuracy not yet measured
The Online Methods (Human samples; page unavailable) describe AD donors and controls, and the Results (Human brain AD gene signatures; page unavailable) compare their gene expression. Our copy does not establish that the AD donors were all severe, that Braak V and VI donors were grouped, or that an exhausted phase confounded the comparison. (LLM, conf=0.81)
- Supportedcites [12] Leng, K. et al. Molecular characterization of selectively vulnerable neurons in Alzheimer’s disease. Nat. Neurosci. 24, 276–287 (2021). source
The Results (page unavailable) report grouping Braak stages 5–6 in the histopathological comparison, so this paper is an example of the study design identified by the citation. The suggestion that an exhausted phase may have confounded such studies is the citing authors’ interpretation, not a finding attributed to this source. (LLM, conf=0.88)
- Partly supportedcites [13] Lau, S. F., Cao, H., Fu, A. K. Y. & Ip, N. Y. Single-nucleus transcriptome analysis reveals dysregulation of angiogenic endothelial cells and neuroprotective glia in Alzheimer’s disease. Proc. Natl Acad. Sci. USA 117, 25800–25809 (2020). sourceExperimental — accuracy not yet measured
The Methods (Selection Criteria for Brain Tissue Collection; page unavailable) classify donors as AD at Braak stage ≥4 or controls at ≤2, and the snRNA-seq Analysis Methods compare those two groups. This supports the claim that the study grouped AD stages for comparison with controls, but the copy does not identify a distinct V/VI grouping or say that an exhausted phase confounded the results. (LLM, conf=0.82)
- Partly supportedcites [14] Sadick, J. S. et al. Astrocytes and oligodendrocytes undergo subtype-specific transcriptional changes in Alzheimer’s disease. Neuron 110, 1788–1805 (2022). sourceExperimental — accuracy not yet measured
The Results section (‘Defining a well-controlled patient cohort’; page unavailable) says the paper compared non-symptomatic donors with AD donors and classified the latter as having moderate or severe pathology. It does not say the comparison included only severe AD donors, document a Braak V/VI grouping, or identify an ‘exhausted phase’ as a confounder. The possible confounding is the citing authors’ speculation, but the specific description of this study’s donor groups is only partly supported. (LLM, conf=0.81)
- Partly supportedcites [15] Smith, A. M. et al. Diverse human astrocyte and microglial transcriptional responses to Alzheimer’s pathology. Acta Neuropathol. 143, 75–91 (2022). sourceExperimental — accuracy not yet measured
The Discussion (page unavailable) says categorical Braak stages do not directly reflect local tissue pathology, supporting the concern that grouping donors by stage can obscure differences. It does not identify an exhausted phase or say that such a phase may have confounded earlier control-versus-severe-AD studies or studies grouping Braak V and VI donors. (LLM, conf=0.76)
hedgedconditional- Asserted: passes — The authors put it forward as true.
- Checkable: passes — It can be checked against evidence.
- Load-bearing: passes — The paper’s conclusions depend on it.
- Based: passes — The paper gives a reason why it holds.
- Could not verify
The cited sources support only part of this claim — read each source’s verdict below.
In the paper
“highlighting a severe end-stage dysfunctional or maladaptive response of astrocytes likely caused by their chronic exposure to Aβ, pTau and ongoing neurodegeneration52”
§ Astrocyte transcriptomic changes along the spatiotemporal progression of Alzheimer’s disease > Discussion
What the sources say
- Partly supportedcites [52] Galea, E. et al. Multi-transcriptomic analysis points to early organelle dysfunction in human astrocytes in Alzheimer’s disease. Neurobiol. Dis. 166, 105655 (2022). sourceExperimental — accuracy not yet measured
In the Discussion’s model of cortical astrocyte transformation (page unavailable), the paper predicts that astrocytes become globally malfunctional in advanced Alzheimer’s disease and proposes amyloid-β as a driver of their phenotypic change. It does not attribute that late-stage dysfunction specifically to chronic exposure to pTau or ongoing neurodegeneration, so the proposed combination of causes is only partly supported. (LLM, conf=0.85)
hedgedconditional- Asserted: passes — The authors put it forward as true.
- Checkable: passes — It can be checked against evidence.
- Load-bearing: passes — The paper’s conclusions depend on it.
- Based: passes — The paper gives a reason why it holds.
- Partly supported
The cited sources support only part of this claim — read each source’s verdict below.
In the paper
“many of these upregulated gene products have been demonstrated in AD reactive astrocytes via immunohistochemistry, especially near dense-core, typically neuritic, Aβ plaques53”
§ Astrocyte transcriptomic changes along the spatiotemporal progression of Alzheimer’s disease > Discussion
What the sources say
- Partly supportedcites [53] Viejo, L. et al. Systematic review of human post‐mortem immunohistochemical studies and bioinformatics analyses unveil the complexity of astrocyte reaction in Alzheimer’s disease. Neuropathol. Appl. Neurobiol. 48, e12753 (2022). sourceExperimental — accuracy not yet measured
The Results (Functional characterisation of markers of astrocyte reaction; page unavailable) review immunohistochemical evidence that many proteins are increased in AD reactive astrocytes. The claim’s plaque qualifier is not supported as stated: the review describes Aβ-immunoreactive astrocytes especially near diffuse Aβ deposits, not especially near dense-core, typically neuritic plaques. (LLM, conf=0.87)
boostedcorrelational- Asserted: passes — The authors put it forward as true.
- Checkable: passes — It can be checked against evidence.
- Load-bearing: unclear — It is unclear whether the paper’s conclusions depend on it.
- Based: passes — The paper gives a reason why it holds.
- Partly supported
- It may state two separate claims as one. 55
- Probably not a substantial claim. 32
- The quote only partly states this claim. 1
Some cited sources support this claim and some don’t — read each source’s verdict below.
In the paper
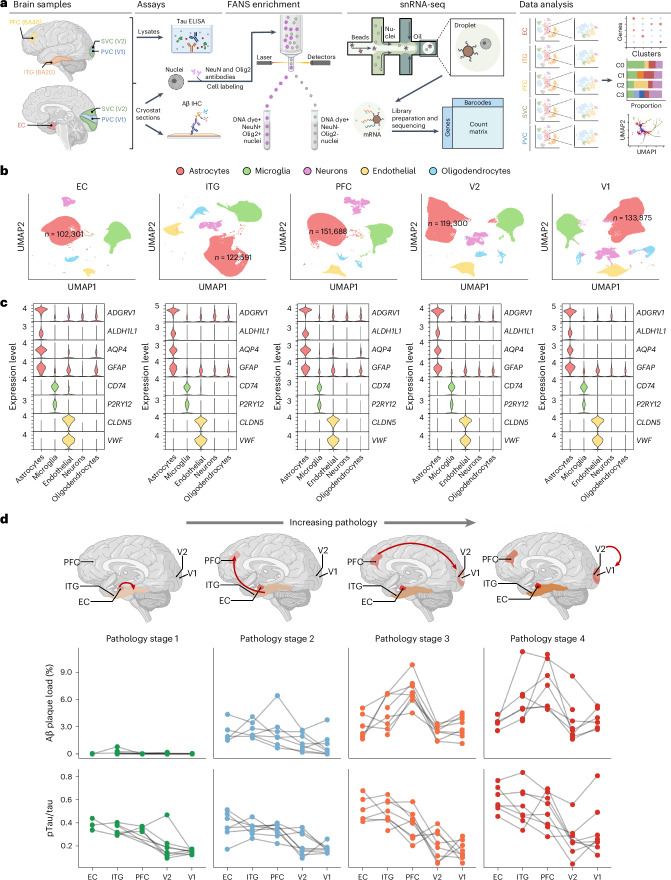
“resulting in over 100,000 astrocyte nuclei in each brain region with ≈6,000 average total number of reads and ≈2,500 average total number of genes detected, which is orders of magnitude higher than previous studies9–15”
§ Astrocyte transcriptomic changes along the spatiotemporal progression of Alzheimer’s disease > Results > A molecular survey of astrocytes in five brain regions affected stereotypically in AD
What the sources say
- Partly supportedcites [9] Mathys, H. et al. Single-cell transcriptomic analysis of Alzheimer’s disease. Nature 570, 332–337 (2019). sourceExperimental — accuracy not yet measured
The citing sentence uses Mathys et al. as a previous study for comparison, not as the source of its own dataset’s figures. In “Single-nucleus RNA-seq profiling of prefrontal cortex in human subjects with AD pathology” (page unavailable), Mathys et al. report 80,660 nuclei in total, so their study provides a smaller dataset for comparison. Our copy does not establish the claimed orders-of-magnitude comparison for astrocyte counts, reads, or genes detected. (LLM, conf=0.79)
- Not checked — no full text of the sourcecites [10] Grubman, A. et al. A single-cell atlas of entorhinal cortex from individuals with Alzheimer’s disease reveals cell-type-specific gene expression regulation. Nat. Neurosci. 22, 2087–2097 (2019). source
- Disputedcites [11] Zhou, Y. et al. Human and mouse single-nucleus transcriptomics reveal TREM2-dependent and TREM2-independent cellular responses in Alzheimer’s disease. Nat. Med. 26, 131–142 (2020). sourceExperimental — accuracy not yet measured
Extended Data Fig. 7 reports 9,019 astrocyte nuclei out of 66,311 total human nuclei, contrary to over 100,000 astrocyte nuclei in each brain region. The Online Methods report median UMIs and genes per nucleus, not the claimed average reads and genes. (LLM, conf=0.90)
Checked by a reasoning model — may be wrong.
- Disputedcites [12] Leng, K. et al. Molecular characterization of selectively vulnerable neurons in Alzheimer’s disease. Nat. Neurosci. 24, 276–287 (2021). sourceExperimental — accuracy not yet measured
The Results (page unavailable) report 42,528 nuclei from the entorhinal cortex and 63,608 from the superior frontal gyrus in total—not over 100,000 astrocyte nuclei in each region. The same passage describes transcript coverage as similar or superior to earlier AD datasets, not orders of magnitude higher; it does not establish the quoted read and gene averages. (LLM, conf=0.90)
Checked by a reasoning model — may be wrong.
- Disputedcites [13] Lau, S. F., Cao, H., Fu, A. K. Y. & Ip, N. Y. Single-nucleus transcriptome analysis reveals dysregulation of angiogenic endothelial cells and neuroprotective glia in Alzheimer’s disease. Proc. Natl Acad. Sci. USA 117, 25800–25809 (2020). sourceExperimental — accuracy not yet measured
In Results, “Single-Nucleus Transcriptome Profiling of the Prefrontal Cortex in AD” (page unavailable), the paper reports 169,496 nuclei in total from prefrontal cortex samples, with astrocytes comprising 11.9% of those nuclei—not over 100,000 astrocyte nuclei in each brain region. It also says the mean numbers of transcripts and genes detected per nucleus were comparable to a previous study, contrary to the claimed orders-of-magnitude increase. The quoted averages of approximately 6,000 reads and 2,500 genes are not established by these passages. (LLM, conf=0.90)
Checked by a reasoning model — may be wrong.
- Partly supportedcites [14] Sadick, J. S. et al. Astrocytes and oligodendrocytes undergo subtype-specific transcriptional changes in Alzheimer’s disease. Neuron 110, 1788–1805 (2022). sourceExperimental — accuracy not yet measured
The Results section reports that Sadick et al. captured 41,340 astrocyte nuclei across their final donor cohort, supporting its use as a comparison with a larger dataset. It does not establish that more than 100,000 nuclei per brain region is orders of magnitude higher than its dataset. The STAR METHODS section gives median counts and detected features for all nuclei, not the citing sentence’s average reads and genes for astrocytes. (LLM, conf=0.86)
- Disputedcites [15] Smith, A. M. et al. Diverse human astrocyte and microglial transcriptional responses to Alzheimer’s pathology. Acta Neuropathol. 143, 75–91 (2022). sourceExperimental — accuracy not yet measured
The Introduction and Results (page numbers not provided) report 52,706 astrocyte nuclei in total, not over 100,000 in each brain region. The Results give averages of 8,775 UMIs and 3,166 distinct genes per astrocyte nucleus, rather than the claimed approximately 6,000 reads and 2,500 genes. (LLM, conf=0.90)
Checked by a reasoning model — may be wrong.
plainn = 32- Asserted: passes — The authors put it forward as true.
- Checkable: passes — It can be checked against evidence.
- Load-bearing: passes — The paper’s conclusions depend on it.
- Based: passes — The paper gives a reason why it holds.
It may state two separate claims as one.
- Rests on an assumption: Single-nucleus RNA sequencing of astrocyte nuclei accurately reflects the astrocyte transcriptome.
- Partly supported
The cited sources support only part of this claim — read each source’s verdict below.
In the paper
“Because astrocyte morphology changes near Aβ plaques and pTau NFTs23,24”
§ Astrocyte transcriptomic changes along the spatiotemporal progression of Alzheimer’s disease > Results > A molecular survey of astrocytes in five brain regions affected stereotypically in AD
What the sources say
- Partly supportedcites [23] Serrano-Pozo, A. et al. Reactive glia not only associates with plaques but also parallels tangles in Alzheimer’s disease. Am. J. Pathol. 179, 1373–1384 (2011). sourceExperimental — accuracy not yet measured
The Spatial Relationships section (page unavailable) reports increased density of reactive astrocytes near dense-core plaques and NFTs. It does not report a change in astrocyte morphology near those lesions; the measured change was in reactive-cell density. (LLM, conf=0.86)
- Supportedcites [24] Perez-Nievas, B. G. & Serrano-Pozo, A. Deciphering the astrocyte reaction in Alzheimer’s disease. Front Aging Neurosci. 10, 114 (2018). source
In “Reactive Astrocytes Associate With Alzheimer’s Pathological Hallmarks” (page not supplied), the paper describes astrocyte processes surrounding and penetrating amyloid plaques and extracellular NFTs. The same section identifies NFTs as containing aberrantly hyperphosphorylated tau, supporting the paraphrase about morphological changes near Aβ plaques and pTau NFTs. (LLM, conf=0.88)
plaincorrelational- Asserted: passes — The authors put it forward as true.
- Checkable: passes — It can be checked against evidence.
- Load-bearing: passes — The paper’s conclusions depend on it.
- Based: passes — The paper gives a reason why it holds.
Probably not a substantial claim.
- Partly supported
The sources with a verdict support this claim; the rest weren’t checked yet, have no full text we could read, or their verdicts aren’t rated yet.
In the paper
“we rank ordered the five brain regions based on their known vulnerability to neurofibrillary degeneration20,21 (that is, EC > ITG > PFC > V2 > V1)”
§ Astrocyte transcriptomic changes along the spatiotemporal progression of Alzheimer’s disease > Results > Astrocyte transcriptomic changes along the stereotypical spatial progression of AD
What the sources say
- Not checked — no full text of the sourcecites [20] Braak, H. & Braak, E. Neuropathological staging of Alzheimer-related changes. Acta Neuropathol. 82, 239–259 (1991). source
- Supportedcites [21] Braak, H., Alafuzoff, I., Arzberger, T., Kretzschmar, H. & Del Tredici, K. Staging of Alzheimer disease-associated neurofibrillary pathology using paraffin sections and immunocytochemistry. Acta Neuropathol. 112, 389–404 (2006). source
The staging-system passages describe entorhinal involvement at stage II, spread into temporal neocortex at stages III–IV, and involvement of frontal association cortex at stage V. The stage V–VI passage places secondary visual areas later in the progression and the primary visual (striate) area last. Although the paper does not print the five-region ranking in these abbreviations, its reported progression supports the ordering. (LLM, conf=0.84)
boostedcorrelational- Asserted: passes — The authors put it forward as true.
- Checkable: passes — It can be checked against evidence.
- Load-bearing: passes — The paper’s conclusions depend on it.
- Based: passes — The paper gives a reason why it holds.
Probably not a substantial claim.
Every source the paper cites for this claim was checked and supports it.
In the paper
“the emerging view from experimental data is that reactive astrogliosis may contribute to neurodegeneration through both gains of toxic functions and loss of normal functions1.”
§ Astrocyte transcriptomic changes along the spatiotemporal progression of Alzheimer’s disease > Main
What the sources say
- Supportedcites [1] Escartin, C. et al. Reactive astrocyte nomenclature, definitions, and future directions. Nat. Neurosci. 24, 312–325 (2021). source
In “Impact in CNS diseases > From morphology to functional studies” (page not supplied), the paper says reactive astrocytes may lose homeostatic functions and gain detrimental functions, exacerbating pathology. The same section gives examples in neurodegenerative disease models, including lost functions in Huntington’s and Alzheimer’s disease and a potentially detrimental gain of function in Alzheimer’s and Parkinson’s disease. (LLM, conf=0.93)
hedgedconditional- Asserted: passes — The authors put it forward as true.
- Checkable: passes — It can be checked against evidence.
- Load-bearing: passes — The paper’s conclusions depend on it.
- Based: passes — The paper gives a reason why it holds.
Probably not a substantial claim.
- Supported
The cited sources support only part of this claim — read each source’s verdict below.
In the paper
“Previous transcriptomic studies comparing AD mouse models have reported similarities and differences in astrocyte responses to Aβ plaques versus pTau NFTs5,7,33.”
§ Astrocyte transcriptomic changes along the spatiotemporal progression of Alzheimer’s disease > Results > Astrocyte transcriptomic changes along the stereotypical spatial progression of AD
What the sources say
- Supportedcites [5] Jiwaji, Z. et al. Reactive astrocytes acquire neuroprotective as well as deleterious signatures in response to Tau and Aβ pathology. Nat. Commun. 13, 135 (2022). source
The Introduction says the study compares astrocyte responses to Aβ and Tau pathology in mouse models to identify common effects and differences. The Results report a core set of genes induced in both models, while the Discussion notes genes induced in only one model. The copy provides no page numbers for these passages. (LLM, conf=0.92)
- Supportedcites [7] Wu, T. et al. Complement C3 is activated in human AD brain and is required for neurodegeneration in mouse models of amyloidosis and tauopathy. Cell Rep. 28, 2111–2123 (2019). source
The section “Induction of Brain Complement Expression in PS2APP and TauP301S Mice” (page unavailable) compares gene-expression profiles in astrocytes from amyloidosis and tauopathy mouse models. Both showed increased classical complement gene expression, while TauP301S astrocytes showed stronger reactive-gene induction than PS2APP astrocytes. This supports the claimed similarities and differences. (LLM, conf=0.92)
- Partly supportedcites [33] De Bastiani, M. A. et al. Hippocampal GFAP-positive astrocyte responses to amyloid and tau pathologies. Brain Behav. Immun. 110, 175–184 (2023). sourceExperimental — accuracy not yet measured
The Introduction and results describe a transcriptomic comparison of hippocampal GFAP-positive astrocytes from PS2APP amyloidosis and Tau P301S mouse models, finding a small overlap of differentially expressed genes and distinct responses. The Discussion also reports inflammation-related changes in both models. The paper frames the comparison as Aβ versus tau pathology; the cited passages do not establish responses specifically to Aβ plaques versus phosphorylated-tau neurofibrillary tangles. (LLM, conf=0.82)
plaincorrelational- Asserted: passes — The authors put it forward as true.
- Checkable: passes — It can be checked against evidence.
- Load-bearing: fails — The paper’s conclusions may not depend on it.
- Based: passes — The paper gives a reason why it holds.
Probably not a substantial claim. The paper’s conclusions may not depend on it.
- Supported
The sources with a verdict support this claim; the rest weren’t checked yet, have no full text we could read, or their verdicts aren’t rated yet.
In the paper
“by definition, the primary visual cortex (V1 region) bears NFTs only in Braak NFT stage VI20,21”
§ Astrocyte transcriptomic changes along the spatiotemporal progression of Alzheimer’s disease > Results > A molecular survey of astrocytes in five brain regions affected stereotypically in AD
What the sources say
- Not checked — no full text of the sourcecites [20] Braak, H. & Braak, E. Neuropathological staging of Alzheimer-related changes. Acta Neuropathol. 82, 239–259 (1991). source
- Supportedcites [21] Braak, H., Alafuzoff, I., Arzberger, T., Kretzschmar, H. & Del Tredici, K. Staging of Alzheimer disease-associated neurofibrillary pathology using paraffin sections and immunocytochemistry. Acta Neuropathol. 112, 389–404 (2006). source
The staging-system section (Major characteristics of stages V–VI; page unavailable) identifies involvement of the striate area, or V1, as a key feature of stage VI. It notes isolated neuritic plaques and AT8-immunoreactive neurons there at stage V, but does not identify these as NFTs; the Fig. 5 caption describes the striate area as uninvolved at that stage. (LLM, conf=0.84)
boosted- Asserted: passes — The authors put it forward as true.
- Checkable: passes — It can be checked against evidence.
- Load-bearing: passes — The paper’s conclusions depend on it.
- Based: passes — The paper gives a reason why it holds.
Probably not a substantial claim.
Every source the paper cites for this claim was checked and supports it.
In the paper
“Astrocytes are critical for maintaining brain homeostasis2”
§ Astrocyte transcriptomic changes along the spatiotemporal progression of Alzheimer’s disease > Main
What the sources say
- Supportedcites [2] Verkhratsky, A. & Nedergaard, M. Physiology of astroglia. Physiol. Rev. 98, 239–389 (2018). source
The paper’s “Definition and Overview of Function” section says astrocytes sustain and control CNS homeostasis at levels from molecules to the whole organ. It also describes their homeostatic functions as vital to CNS operation, supporting the claim that they are critical for maintaining brain homeostasis. (LLM, conf=0.94)
plain- Asserted: passes — The authors put it forward as true.
- Checkable: passes — It can be checked against evidence.
- Load-bearing: fails — The paper’s conclusions may not depend on it.
- Based: passes — The paper gives a reason why it holds.
Probably not a substantial claim. The paper’s conclusions may not depend on it.
- Supported
The cited sources support only part of this claim — read each source’s verdict below.
In the paper
“These AD neuropathological changes (ADNC) are accompanied by a dramatic loss of synapses and neurons, as well as prominent morphological and functional changes of glial cells, collectively termed reactive gliosis1.”
§ Astrocyte transcriptomic changes along the spatiotemporal progression of Alzheimer’s disease > Main
What the sources say
- Partly supportedcites [1] Escartin, C. et al. Reactive astrocyte nomenclature, definitions, and future directions. Nat. Neurosci. 24, 312–325 (2021). sourceExperimental — accuracy not yet measured
The paper’s “Morphology revisited” section describes changes in astrocyte branches in AD mouse models, and “From morphology to functional studies” describes altered reactive-astrocyte functions in AD models. Its discussion of gliosis also supports the general terminology. The cited passages do not establish the claimed dramatic loss of synapses and neurons accompanying AD neuropathological changes; pages are not available in our copy. (LLM, conf=0.86)
plaincorrelational- Asserted: passes — The authors put it forward as true.
- Checkable: passes — It can be checked against evidence.
- Load-bearing: passes — The paper’s conclusions depend on it.
- Based: passes — The paper gives a reason why it holds.
Probably not a substantial claim. It may state two separate claims as one.
- Partly supported
The cited sources support only part of this claim — read each source’s verdict below.
In the paper
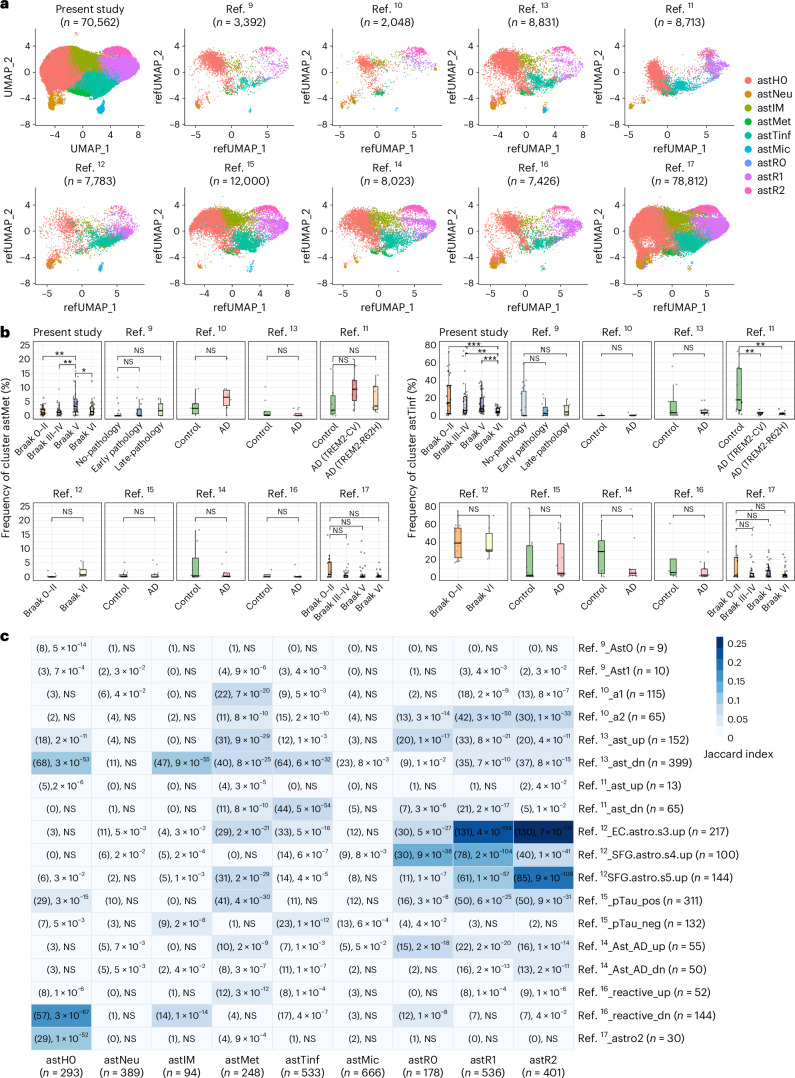
“Although all but one study10 had astTinf, only the largest study—the Seattle Alzheimer’s Disease Brain Cell Atlas (SEA-AD)17, performed in the middle temporal gyrus—had a sizable representation of the exhausted astMet subcluster.”
§ Astrocyte transcriptomic changes along the spatiotemporal progression of Alzheimer’s disease > Results > Comparison with other human snRNA-seq datasets
What the sources say
- Not checked — no full text of the sourcecites [10] Grubman, A. et al. A single-cell atlas of entorhinal cortex from individuals with Alzheimer’s disease reveals cell-type-specific gene expression regulation. Nat. Neurosci. 22, 2087–2097 (2019). source
- Partly supportedcites [17] Gabitto, M. I. et al. Integrated multimodal cell atlas of Alzheimeras disease. Nat. Neuro. https://doi.org/10.1038/s41593-024-01774-5 (2024). sourceExperimental — accuracy not yet measured
The Results section identifies SEA-AD as an MTG atlas, and Fig. 4b depicts it as larger than the publicly available datasets. But the copy does not identify astTinf or astMet, or establish that only SEA-AD had a sizable astMet subcluster (searched: astTinf, astMet, exhausted astrocyte subcluster). (LLM, conf=0.83)
plain- Asserted: passes — The authors put it forward as true.
- Checkable: passes — It can be checked against evidence.
- Load-bearing: passes — The paper’s conclusions depend on it.
- Based: passes — The paper gives a reason why it holds.
It may state two separate claims as one.
Every source the paper cites for this claim was checked and supports it.
In the paper
“previous bulk transcriptomic analyses have highlighted energy metabolism deficits as a feature of AD and other neurodegenerative diseases43,44”
§ Astrocyte transcriptomic changes along the spatiotemporal progression of Alzheimer’s disease > Discussion
What the sources say
- Supportedcites [43] Noori, A., Mezlini, A. M., Hyman, B. T., Serrano-Pozo, A. & Das, S. Systematic review and meta-analysis of human transcriptomics reveals neuroinflammation, deficient energy metabolism, and proteostasis failure across neurodegeneration. Neurobiol. Dis. 149, 105225 (2021). source
The Discussion reports that a meta-analysis of bulk microarray transcriptomic datasets from AD, LBD, and ALS-FTD found downregulation of genes involved in mitochondrial electron transport and energy metabolism. It also identifies failure of neuronal energy metabolism as a shared feature of these diseases. (LLM, conf=0.94)
- Supportedcites [44] Noori, A., Mezlini, A. M., Hyman, B. T., Serrano-Pozo, A. & Das, S. Differential gene expression data from the human central nervous system across Alzheimer’s disease, Lewy body diseases, and the amyotrophic lateral sclerosis and frontotemporal dementia spectrum. Data Brief. 35, 106863 (2021). source
The Abstract describes a meta-analysis of human CNS transcriptomic datasets spanning AD and other neurodegenerative diseases. The Specifications Table identifies the related research article as a transcriptomic meta-analysis that found deficient energy metabolism across neurodegeneration (page not provided). (LLM, conf=0.84)
plaincorrelational- Asserted: passes — The authors put it forward as true.
- Checkable: passes — It can be checked against evidence.
- Load-bearing: fails — The paper’s conclusions may not depend on it.
- Based: passes — The paper gives a reason why it holds.
Probably not a substantial claim. The paper’s conclusions may not depend on it.
- Supported
The cited sources support only part of this claim — read each source’s verdict below.
In the paper
“astrocytes have been reported to contribute to the (18F)fluoro-deoxy-glucose (FDG)–positron emission tomography (PET) signal via the glutamate transporter EAAT2/GLT-1, encoded by SLC1A2 (ref. 45)”
§ Astrocyte transcriptomic changes along the spatiotemporal progression of Alzheimer’s disease > Discussion
What the sources say
- Partly supportedcites [45] Zimmer, E. R. et al. [18F]FDG PET signal is driven by astroglial glutamate transport. Nat. Neurosci. 20, 393–395 (2017). sourceExperimental — accuracy not yet measured
The paper’s Abstract (page unavailable) reports that astrocytic glutamate transport via GLT-1 contributes to the [18F]FDG PET signal. Our copy does not identify GLT-1 as EAAT2 or state that it is encoded by SLC1A2, so those identifiers are not supported by this source. (LLM, conf=0.84)
hedgeddirect- Asserted: passes — The authors put it forward as true.
- Checkable: passes — It can be checked against evidence.
- Load-bearing: fails — The paper’s conclusions may not depend on it.
- Based: passes — The paper gives a reason why it holds.
Probably not a substantial claim. The paper’s conclusions may not depend on it.
- Partly supported
Every source the paper cites for this claim was checked and supports it.
In the paper
“higher plasma GFAP levels have been associated with higher (18F)FDG–PET signals in early AD46”
§ Astrocyte transcriptomic changes along the spatiotemporal progression of Alzheimer’s disease > Discussion
What the sources say
- Supportedcites [46] Salvadó, G. et al. Reactive astrogliosis is associated with higher cerebral glucose consumption in the early Alzheimer’s continuum. Eur. J. Nucl. Med. Mol. Imaging 49, 4567–4579 (2022). source
The Discussion identifies a positive association between plasma GFAP and cerebral glucose consumption early in the Alzheimer’s continuum. The Correlations with cerebral [18F]FDG uptake section reports a positive correlation with PET uptake; the Discussion notes that the association can turn negative in some regions among tau-positive individuals. (LLM, conf=0.93)
plaincorrelational- Asserted: passes — The authors put it forward as true.
- Checkable: passes — It can be checked against evidence.
- Load-bearing: fails — The paper’s conclusions may not depend on it.
- Based: passes — The paper gives a reason why it holds.
Probably not a substantial claim. The paper’s conclusions may not depend on it.
- Supported
Every source the paper cites for this claim was checked and supports it.
In the paper
“RORB had previously been identified by snRNA-seq as a marker gene for excitatory EC neurons that are vulnerable to NFTs and neurodegeneration in AD12”
§ Astrocyte transcriptomic changes along the spatiotemporal progression of Alzheimer’s disease > Discussion
What the sources say
- Supportedcites [12] Leng, K. et al. Molecular characterization of selectively vulnerable neurons in Alzheimer’s disease. Nat. Neurosci. 24, 276–287 (2021). source
The Introduction (page not provided) says the authors used snRNA-seq to discover a selectively vulnerable excitatory-neuron subpopulation in the entorhinal cortex. The Results (page not provided) identify RORB as a marker of vulnerable EC excitatory-neuron subpopulations and report both their depletion during AD progression and preferential phospho-tau accumulation. (LLM, conf=0.94)
plaincorrelational- Asserted: passes — The authors put it forward as true.
- Checkable: passes — It can be checked against evidence.
- Load-bearing: passes — The paper’s conclusions depend on it.
- Based: passes — The paper gives a reason why it holds.
Probably not a substantial claim.
- Supported
The cited sources support only part of this claim — read each source’s verdict below.
In the paper
“the distinguishing feature between Braak NFT stages V and VI is not just the presence of NFTs in the primary visual (V1), motor and sensory cortical areas, but more severe neurofibrillary degeneration21 and atrophy throughout the cortical mantle51”
§ Astrocyte transcriptomic changes along the spatiotemporal progression of Alzheimer’s disease > Discussion
What the sources say
- Supportedcites [21] Braak, H., Alafuzoff, I., Arzberger, T., Kretzschmar, H. & Del Tredici, K. Staging of Alzheimer disease-associated neurofibrillary pathology using paraffin sections and immunocytochemistry. Acta Neuropathol. 112, 389–404 (2006). source
In “Major characteristics of stages V–VI” (page not provided), the paper describes stage VI as reaching primary neocortical areas, including the striate area, and reports severe pathology across most of the neocortex, compared with more limited involvement at stage V. This supports the neurofibrillary-degeneration distinction attributed to this source. The sentence cites a different source for cortical atrophy, so that portion is not assessed here. (LLM, conf=0.89)
- Partly supportedcites [51] La Joie, R. et al. Prospective longitudinal atrophy in Alzheimer’s disease correlates with the intensity and topography of baseline tau-PET. Sci. Transl. Med. 12, eaau5732 (2020). sourceExperimental — accuracy not yet measured
The Results report cortical atrophy in patients with early-stage Alzheimer’s disease, and the Discussion reports an association between global cortical tau-PET signal and global cortical atrophy (pages unavailable). The paper does not compare Braak NFT stages V and VI or establish that more severe atrophy throughout the cortical mantle distinguishes them. Citation 51 is attached to the atrophy portion of the sentence, not the separate claim about neurofibrillary degeneration. (LLM, conf=0.79)
plain- Asserted: passes — The authors put it forward as true.
- Checkable: passes — It can be checked against evidence.
- Load-bearing: passes — The paper’s conclusions depend on it.
- Based: passes — The paper gives a reason why it holds.
It may state two separate claims as one.
- Supported
The sources with a verdict support this claim; the rest weren’t checked yet, have no full text we could read, or their verdicts aren’t rated yet.
In the paper
“our sample sizes are similar to those reported in previous publications9–17”
§ Astrocyte transcriptomic changes along the spatiotemporal progression of Alzheimer’s disease > Methods > Human specimens
What the sources say
- Supportedcites [9] Mathys, H. et al. Single-cell transcriptomic analysis of Alzheimer’s disease. Nature 570, 332–337 (2019). source
The Methods section, “Selection of individuals from the Religious Order Study (ROS) cohort” (page not provided), reports a sample of 48 individuals: 24 controls and 24 with AD pathology. This supports the citation as an example of a previous publication reporting a sample size; the comparison with the citing study’s own sample size is the citing authors’ assessment. (LLM, conf=0.90)
- Not checked — no full text of the sourcecites [10] Grubman, A. et al. A single-cell atlas of entorhinal cortex from individuals with Alzheimer’s disease reveals cell-type-specific gene expression regulation. Nat. Neurosci. 22, 2087–2097 (2019). source
- Supportedcites [11] Zhou, Y. et al. Human and mouse single-nucleus transcriptomics reveal TREM2-dependent and TREM2-independent cellular responses in Alzheimer’s disease. Nat. Med. 26, 131–142 (2020). source
The Online Methods (‘Mice’; page not provided) report three male mice per genotype for snRNA-seq and give sample sizes for other assays. The paper therefore supplies the prior-study sample sizes cited; whether the citing authors’ own sample sizes are similar is their comparison, not a finding attributed to this source. (LLM, conf=0.85)
- Supportedcites [12] Leng, K. et al. Molecular characterization of selectively vulnerable neurons in Alzheimer’s disease. Nat. Neurosci. 24, 276–287 (2021). source
The Sample sizes passage (labelled Discussion in our copy; page not provided) explicitly says the authors’ sample sizes were comparable to those in previous publications. This directly supports the paraphrase. (LLM, conf=0.94)
- Supportedcites [13] Lau, S. F., Cao, H., Fu, A. K. Y. & Ip, N. Y. Single-nucleus transcriptome analysis reveals dysregulation of angiogenic endothelial cells and neuroprotective glia in Alzheimer’s disease. Proc. Natl Acad. Sci. USA 117, 25800–25809 (2020). source
The Results section, “Single-Nucleus Transcriptome Profiling of the Prefrontal Cortex in AD” (page unavailable), reports sample sizes of 12 AD and 9 control subjects. The citation identifies a previous publication that reports sample sizes; the comparison with the citing study’s own sizes is the citing authors’ assessment. (LLM, conf=0.88)
- Supportedcites [14] Sadick, J. S. et al. Astrocytes and oligodendrocytes undergo subtype-specific transcriptional changes in Alzheimer’s disease. Neuron 110, 1788–1805 (2022). source
In STAR METHODS, under “Quantification and Statistical Analysis—Sample size estimation,” the paper explicitly says its donor cohort is similar in size to those in published works by Grubman et al. and Leng et al. This supports the cited comparison of sample sizes. (LLM, conf=0.94)
- Supportedcites [15] Smith, A. M. et al. Diverse human astrocyte and microglial transcriptional responses to Alzheimer’s pathology. Acta Neuropathol. 143, 75–91 (2022). source
The Methods (Brain tissue; page not available) report 6 control and 6 Alzheimer’s disease cases, yielding 24 brain samples. This supports citing Smith et al. as a previous publication with a reported sample size; the comparison with the citing authors’ own sample size is their framing, not a finding attributed to Smith et al. (LLM, conf=0.85)
- Supportedcites [16] Dai, D. L., Li, M. & Lee, E. B. Human Alzheimer’s disease reactive astrocytes exhibit a loss of homeostastic gene expression. Acta Neuropathol. Commun. 11, 127 (2023). source
The Discussion reports 11,337 astrocyte nuclei across 15 samples, and the Results report validation data from 10 normal and 10 Alzheimer’s disease brains. This source therefore supplies sample sizes from a previous publication; whether they are similar to the citing study’s sizes is the citing authors’ comparison, not a finding attributed to this source. (LLM, conf=0.85)
- Supportedcites [17] Gabitto, M. I. et al. Integrated multimodal cell atlas of Alzheimeras disease. Nat. Neuro. https://doi.org/10.1038/s41593-024-01774-5 (2024). source
The Methods section (‘Statistics, data visualization and reproducibility’) explicitly states that the study’s sample sizes are similar to those reported in previous publications. The difference in reference numbers does not change the attributed claim. (LLM, conf=0.95)
plain- Asserted: passes — The authors put it forward as true.
- Checkable: passes — It can be checked against evidence.
- Load-bearing: fails — The paper’s conclusions may not depend on it.
- Based: passes — The paper gives a reason why it holds.
Probably not a substantial claim. The paper’s conclusions may not depend on it.
- Supported
A result the paper reports from its own data — it cites no other source for it, so there is none to check. The quote shows it is in the paper.
In the paper
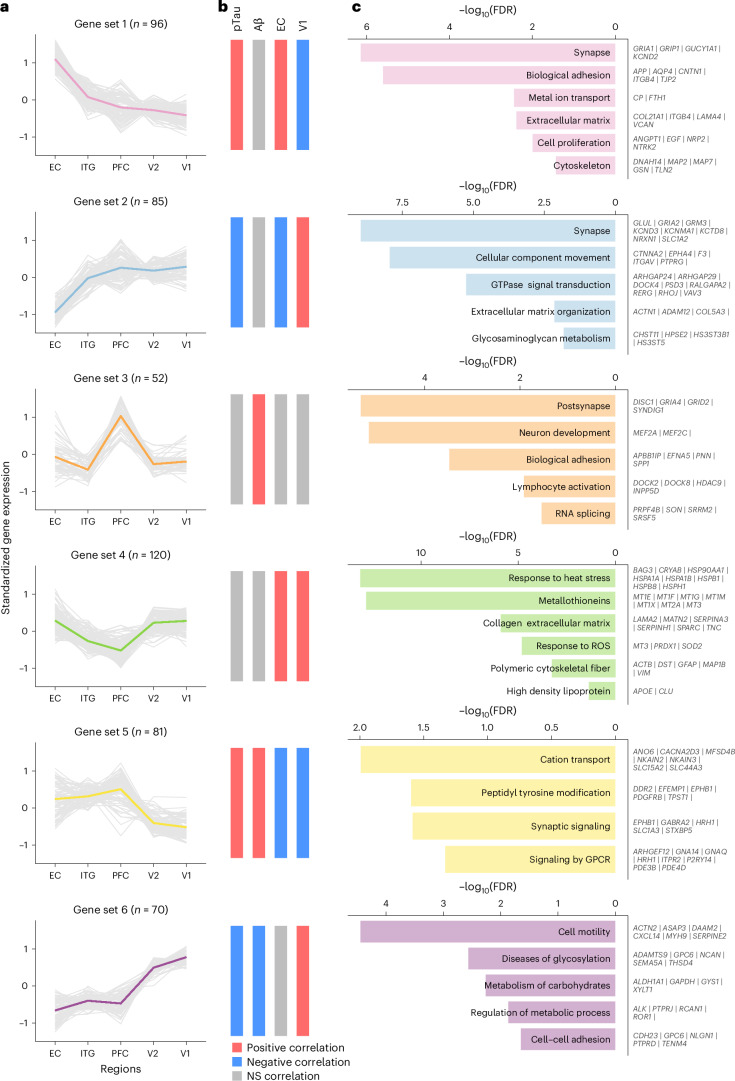
“Interestingly, the gene set decreasing linearly from EC to V1 (gene set 1) was positively correlated with the pTau/tau ratio, whereas the one increasing from EC to V1 (gene set 2) was negatively correlated with the pTau/tau ratio”
§ Astrocyte transcriptomic changes along the spatiotemporal progression of Alzheimer’s disease > Results > Astrocyte transcriptomic changes along the stereotypical spatial progression of AD
plaincorrelational- Asserted: passes — The authors put it forward as true.
- Checkable: passes — It can be checked against evidence.
- Load-bearing: passes — The paper’s conclusions depend on it.
- Based: passes — The paper gives a reason why it holds.
It may state two separate claims as one.
- Rests on an assumption: The local Aβ plaque load and pTau/tau ratio measured in adjacent tissue samples reflect the local ADNC burden experienced by the astrocytes sequenced from the same brain region.
A result the paper reports from its own data — it cites no other source for it, so there is none to check. The quote shows it is in the paper.
In the paper
“The last two spatial gene sets exhibited relatively constant expression levels in EC, ITG and PFC, but either decreased (gene set 5) or increased (gene set 6) from the PFC to V2 and V1.”
§ Astrocyte transcriptomic changes along the spatiotemporal progression of Alzheimer’s disease > Results > Astrocyte transcriptomic changes along the stereotypical spatial progression of AD
plaindirectn = 32- Asserted: passes — The authors put it forward as true.
- Checkable: passes — It can be checked against evidence.
- Load-bearing: passes — The paper’s conclusions depend on it.
- Based: passes — The paper gives a reason why it holds.
It may state two separate claims as one.
A result the paper reports from its own data — it cites no other source for it, so there is none to check. The quote shows it is in the paper.
In the paper
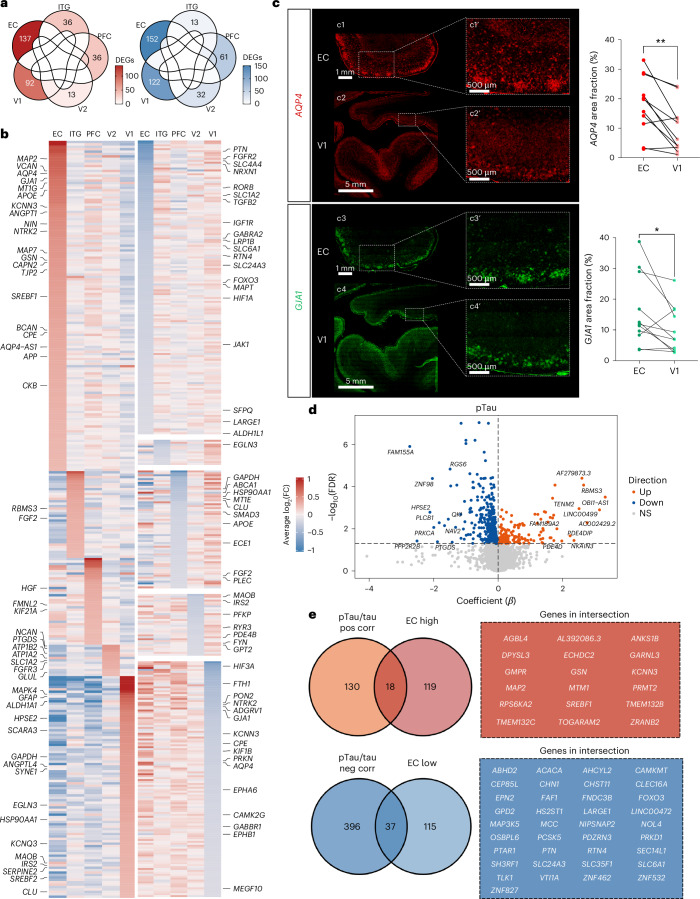
“Conversely, CLU, GFAP and MAOB were upregulated, whereas AQP4 and GJA1 were downregulated in V1 versus all other brain regions.”
§ Astrocyte transcriptomic changes along the spatiotemporal progression of Alzheimer’s disease > Results > Regional heterogeneity of astrocyte transcriptome in the normal aging brain
plaincorrelational- Asserted: passes — The authors put it forward as true.
- Checkable: passes — It can be checked against evidence.
- Load-bearing: unclear — It is unclear whether the paper’s conclusions depend on it.
- Based: passes — The paper gives a reason why it holds.
It may state two separate claims as one.
- Rests on an assumption: Single-nucleus RNA sequencing of astrocyte nuclei accurately reflects the astrocyte transcriptome.
A result the paper reports from its own data — it cites no other source for it, so there is none to check. The quote shows it is in the paper.
In the paper
“Among other genes of interest, APOE, APP, AQP4 and GJA1 were upregulated, whereas ALDH1L1, LRP1B, microtubule-associated protein tau (MAPT) and SLC1A2 were downregulated in EC relative to the other brain regions.”
§ Astrocyte transcriptomic changes along the spatiotemporal progression of Alzheimer’s disease > Results > Regional heterogeneity of astrocyte transcriptome in the normal aging brain
plaincorrelationaln = 8- Asserted: passes — The authors put it forward as true.
- Checkable: passes — It can be checked against evidence.
- Load-bearing: passes — The paper’s conclusions depend on it.
- Based: passes — The paper gives a reason why it holds.
It may state two separate claims as one.
- Rests on an assumption: Single-nucleus RNA sequencing of astrocyte nuclei accurately reflects the astrocyte transcriptome.
A result the paper reports from its own data — it cites no other source for it, so there is none to check. The quote shows it is in the paper.
In the paper
“Only 18 of the 137 EC-upregulated genes were positively correlated with the pTau/tau ratio (notably including cytoskeletal genes such as MAP2 and the master transcription factor regulating cholesterol metabolism, SREBF1), whereas only 37 of 152 EC-downregulated genes were negatively correlated with the pTau/tau ratio (including extracellular matrix/glycosaminoglycan metabolism genes, such as LARGE”
§ Astrocyte transcriptomic changes along the spatiotemporal progression of Alzheimer’s disease > Results > Regional heterogeneity of astrocyte transcriptome in the normal aging brain
plaincorrelationaln = 8- Asserted: passes — The authors put it forward as true.
- Checkable: passes — It can be checked against evidence.
- Load-bearing: passes — The paper’s conclusions depend on it.
- Based: passes — The paper gives a reason why it holds.
It may state two separate claims as one.
- Rests on an assumption: Single-nucleus RNA sequencing of astrocyte nuclei accurately reflects the astrocyte transcriptome.
A result the paper reports from its own data — it cites no other source for it, so there is none to check. The quote shows it is in the paper.
In the paper
“Our eight control donors provided a unique opportunity to examine regional differences in the astrocyte transcriptome in the normal aging brain because these donors had essentially no 3D6-positive Aβ plaques across the five brain regions and very low pTau/tau ratios except for the EC”
§ Astrocyte transcriptomic changes along the spatiotemporal progression of Alzheimer’s disease > Results > Regional heterogeneity of astrocyte transcriptome in the normal aging brain
plainn = 8- Asserted: passes — The authors put it forward as true.
- Checkable: passes — It can be checked against evidence.
- Load-bearing: passes — The paper’s conclusions depend on it.
- Based: passes — The paper gives a reason why it holds.
It may state two separate claims as one.
A result the paper reports from its own data — it cites no other source for it, so there is none to check. The quote shows it is in the paper.
In the paper
“Two spatial gene sets changed their expression level monotonically along the network, either decreasing from EC to V1 (gene set 1) or increasing from EC to V1 (gene set 2).”
§ Astrocyte transcriptomic changes along the spatiotemporal progression of Alzheimer’s disease > Results > Astrocyte transcriptomic changes along the stereotypical spatial progression of AD
plaincorrelationaln = 32- Asserted: passes — The authors put it forward as true.
- Checkable: passes — It can be checked against evidence.
- Load-bearing: passes — The paper’s conclusions depend on it.
- Based: passes — The paper gives a reason why it holds.
It may state two separate claims as one.
A result the paper reports from its own data — it cites no other source for it, so there is none to check. The quote shows it is in the paper.
In the paper
“By contrast, the pTau/tau ratio was highest in EC and demonstrated the expected pattern EC > ITG > PFC > V2 > V1 across all stages”
§ Astrocyte transcriptomic changes along the spatiotemporal progression of Alzheimer’s disease > Results > A molecular survey of astrocytes in five brain regions affected stereotypically in AD
boostedcorrelational- Asserted: passes — The authors put it forward as true.
- Checkable: passes — It can be checked against evidence.
- Load-bearing: unclear — It is unclear whether the paper’s conclusions depend on it.
- Based: passes — The paper gives a reason why it holds.
It may state two separate claims as one.
A result the paper reports from its own data — it cites no other source for it, so there is none to check. The quote shows it is in the paper.
In the paper
“This gene set was enriched in synapse-associated (DISC1, GRIA4, GRID2 and SYNDIG1), cell–cell communication (APBB1IP, EFNA5, EPHA6 and SPP1) and cytoskeletal (SYNM and FMN1) genes that were distinct from those associated with the pTau/tau ratio (Fig. 3c).”
§ Astrocyte transcriptomic changes along the spatiotemporal progression of Alzheimer’s disease > Results > Astrocyte transcriptomic changes along the stereotypical spatial progression of AD
plain- Asserted: passes — The authors put it forward as true.
- Checkable: passes — It can be checked against evidence.
- Load-bearing: unclear — It is unclear whether the paper’s conclusions depend on it.
- Based: passes — The paper gives a reason why it holds.
It may state two separate claims as one.
A result the paper reports from its own data — it cites no other source for it, so there is none to check. The quote shows it is in the paper.
In the paper
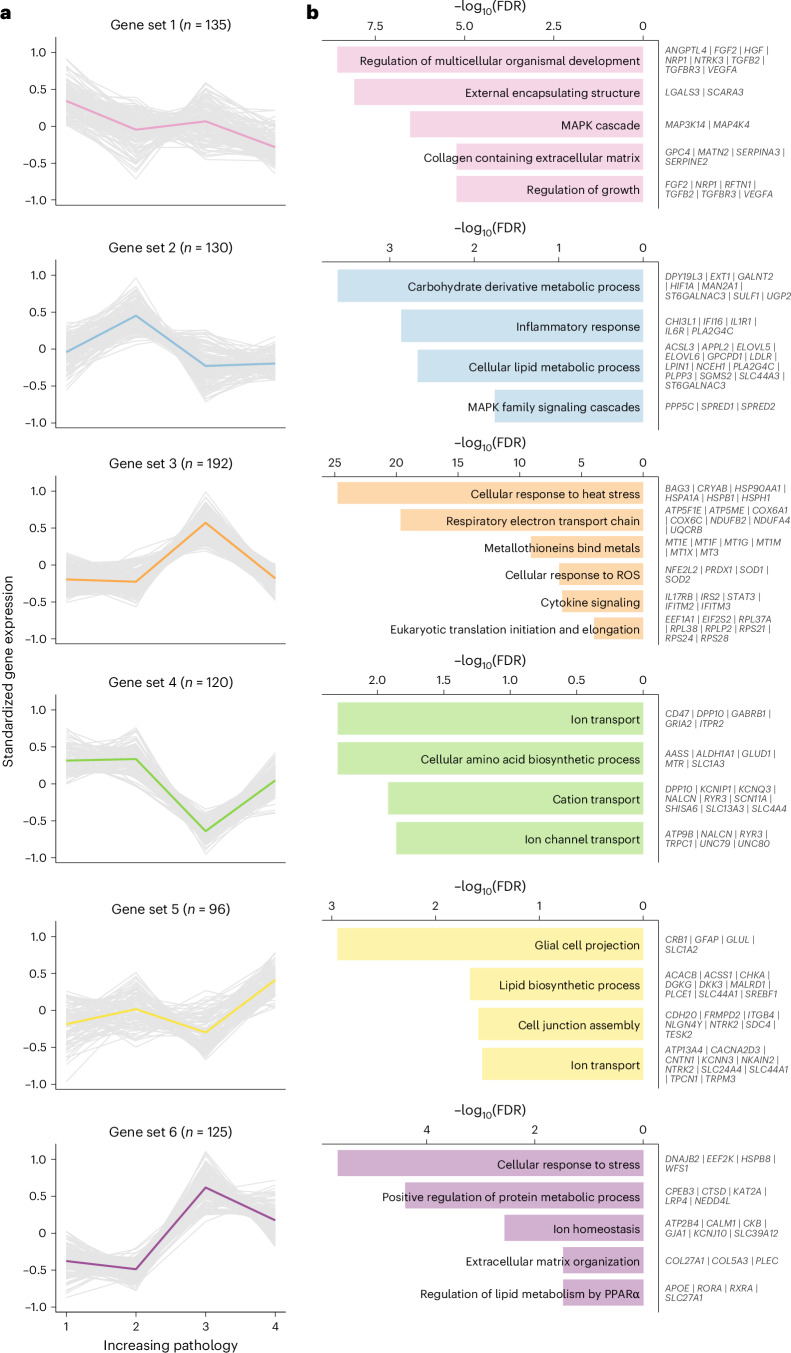
“The upregulated late gene program comprised genes involved in proteostasis/response to heat stress (AHSA1, BAG3, CCT4, CRYAB, DNAJA1, DNAJB1, DNAJB6, HSP90AA1, HSP90AB1, HSPA1A, HSPA1B, HSPA4, HSPA4L, HSPA8, HSPA9, HSPB1, HSPD1, HSPE1, HSPH1, MIB1, OTUD7B, SQSTM1, ST13, UBB, UBC, UBE2B and UBE2E2), protein translation (EEF1A1, EIF1, EIF2S2, RPL37A, RPL38, RPLP2, RPS21, RPS24 and RPS28), energy”
§ Astrocyte transcriptomic changes along the spatiotemporal progression of Alzheimer’s disease > Results > Astrocyte transcriptomic changes along the temporal progression of AD
plain- Asserted: passes — The authors put it forward as true.
- Checkable: passes — It can be checked against evidence.
- Load-bearing: passes — The paper’s conclusions depend on it.
- Based: passes — The paper gives a reason why it holds.
The quote only partly states this claim.
A result the paper reports from its own data — it cites no other source for it, so there is none to check. The quote shows it is in the paper.
In the paper
“Two small clusters had genes typically found in other cell types, specifically neurons (astNeu) and microglia (astMic), and were considered hybrids or doublets (although their estimated doublet score was very low).”
§ Astrocyte transcriptomic changes along the spatiotemporal progression of Alzheimer’s disease > Results > Astrocyte clustering analysis reveals diverse transcriptomic programs across brain regions and pathology stages
hedged- Asserted: passes — The authors put it forward as true.
- Checkable: passes — It can be checked against evidence.
- Load-bearing: unclear — It is unclear whether the paper’s conclusions depend on it.
- Based: passes — The paper gives a reason why it holds.
It may state two separate claims as one.
A result the paper reports from its own data — it cites no other source for it, so there is none to check. The quote shows it is in the paper.
In the paper
“another sizable gene set (gene set 4, n = 120), characterized by its lack of correlation with either Aβ or pTau levels and highest expression levels in the EC and V1, was composed of genes related to the cytoskeleton (including GFAP), lipid metabolism (including APOE and CLU), calcium homeostasis, extracellular matrix, heat-shock proteins and antioxidant defense (for example, metallothioneins)”
§ Astrocyte transcriptomic changes along the spatiotemporal progression of Alzheimer’s disease > Discussion
plain- Asserted: passes — The authors put it forward as true.
- Checkable: passes — It can be checked against evidence.
- Load-bearing: unclear — It is unclear whether the paper’s conclusions depend on it.
- Based: passes — The paper gives a reason why it holds.
It may state two separate claims as one.
A result the paper reports from its own data — it cites no other source for it, so there is none to check. The quote shows it is in the paper.
In the paper
“These 798 DEGs were grouped into six different temporal gene sets with distinct temporal trajectories and variable strength of association with the local Aβ and pTau levels (Fig. 4 and Supplementary Data 5).”
§ Astrocyte transcriptomic changes along the spatiotemporal progression of Alzheimer’s disease > Results > Astrocyte transcriptomic changes along the temporal progression of AD
plaincorrelational- Asserted: passes — The authors put it forward as true.
- Checkable: passes — It can be checked against evidence.
- Load-bearing: passes — The paper’s conclusions depend on it.
- Based: passes — The paper gives a reason why it holds.
It may state two separate claims as one.
- Rests on an assumption: The four pathology stages, based on cross-sectional CERAD NP scores and Braak NFT stages, represent the temporal progression of ADNC within a brain region.
A result the paper reports from its own data — it cites no other source for it, so there is none to check. The quote shows it is in the paper.
In the paper
“Finally, gene set 6 had low expression at early and intermediate stages, peaked at the late stage and decreased at the end stage without returning to baseline”
§ Astrocyte transcriptomic changes along the spatiotemporal progression of Alzheimer’s disease > Results > Astrocyte transcriptomic changes along the temporal progression of AD
plaincorrelational- Asserted: passes — The authors put it forward as true.
- Checkable: passes — It can be checked against evidence.
- Load-bearing: unclear — It is unclear whether the paper’s conclusions depend on it.
- Based: passes — The paper gives a reason why it holds.
It may state two separate claims as one.
- Rests on an assumption: The four pathology stages, based on cross-sectional CERAD NP scores and Braak NFT stages, represent the temporal progression of ADNC within a brain region.
A result the paper reports from its own data — it cites no other source for it, so there is none to check. The quote shows it is in the paper.
In the paper
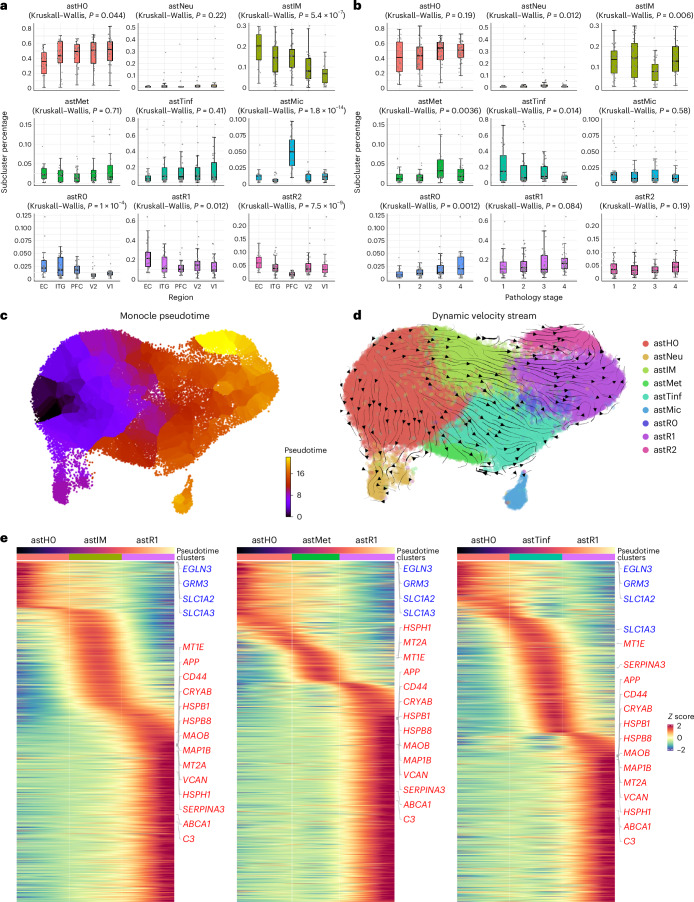
“The proportion of homeostatic, intermediate and reactive astrocytes changed only along the spatial axis, whereas two other subclusters changed along the temporal axis.”
§ Astrocyte transcriptomic changes along the spatiotemporal progression of Alzheimer’s disease > Abstract
plaincorrelationaln = 32- Asserted: passes — The authors put it forward as true.
- Checkable: passes — It can be checked against evidence.
- Load-bearing: passes — The paper’s conclusions depend on it.
- Based: passes — The paper gives a reason why it holds.
It may state two separate claims as one.
A result the paper reports from its own data — it cites no other source for it, so there is none to check. The quote shows it is in the paper.
In the paper
“This gene set included many trophic factors and their receptors (ANGPTL4, APC, EGLN3, FGF2, GFRA1, HGF, IGF1R, NRP1, NTRK3, TGFB2, TGFBR3 and VEGFA), extracellular matrix (GPC4, MATN2, SERPINA3, SERPINE2 and SPOCK1), cytoskeleton (ACTN1, FIGN, MACF1, MAPRE2, MAST4 and MYH9) and some metal binding (CP, FTL and MT2A), antioxidant (MGST1 and MSRA) but also pro-oxidant enzymes (MAOB), neuroin”
§ Astrocyte transcriptomic changes along the spatiotemporal progression of Alzheimer’s disease > Results > Astrocyte transcriptomic changes along the temporal progression of AD
plain- Asserted: passes — The authors put it forward as true.
- Checkable: passes — It can be checked against evidence.
- Load-bearing: passes — The paper’s conclusions depend on it.
- Based: passes — The paper gives a reason why it holds.
It may state two separate claims as one.
A result the paper reports from its own data — it cites no other source for it, so there is none to check. The quote shows it is in the paper.
In the paper
“This early gene program included trophic and survival factors (FGF1, FGF14, HIF1A and NRP2), extracellular matrix (GPC6, KAZN, LAMA4 and TNC), cytoskeleton (ABI1, CLIP1, MYO1E and VCL) and neuroinflammation (CHI3L1, IFI16, IL1R1, IL6R and RCAN1) genes, which differ from those predominant in the early ADNC stage. It also encompassed genes involved in lipid metabolism (ACSL3, ELOVL5, ELOVL6, LDLR, L”
§ Astrocyte transcriptomic changes along the spatiotemporal progression of Alzheimer’s disease > Results > Astrocyte transcriptomic changes along the temporal progression of AD
plain- Asserted: passes — The authors put it forward as true.
- Checkable: passes — It can be checked against evidence.
- Load-bearing: unclear — It is unclear whether the paper’s conclusions depend on it.
- Based: passes — The paper gives a reason why it holds.
It may state two separate claims as one.
A result the paper reports from its own data — it cites no other source for it, so there is none to check. The quote shows it is in the paper.
In the paper
“While some of the subclusters were associated with age, the effect sizes were very small (β = −0.008 to 0.004).”
§ Astrocyte transcriptomic changes along the spatiotemporal progression of Alzheimer’s disease > Results > Dynamic transcriptomic changes in astrocyte subclusters along AD progression
plaincorrelational- Asserted: passes — The authors put it forward as true.
- Checkable: passes — It can be checked against evidence.
- Load-bearing: fails — The paper’s conclusions may not depend on it.
- Based: passes — The paper gives a reason why it holds.
Probably not a substantial claim. The paper’s conclusions may not depend on it. It may state two separate claims as one.
A result the paper reports from its own data — it cites no other source for it, so there is none to check. The quote shows it is in the paper.
In the paper
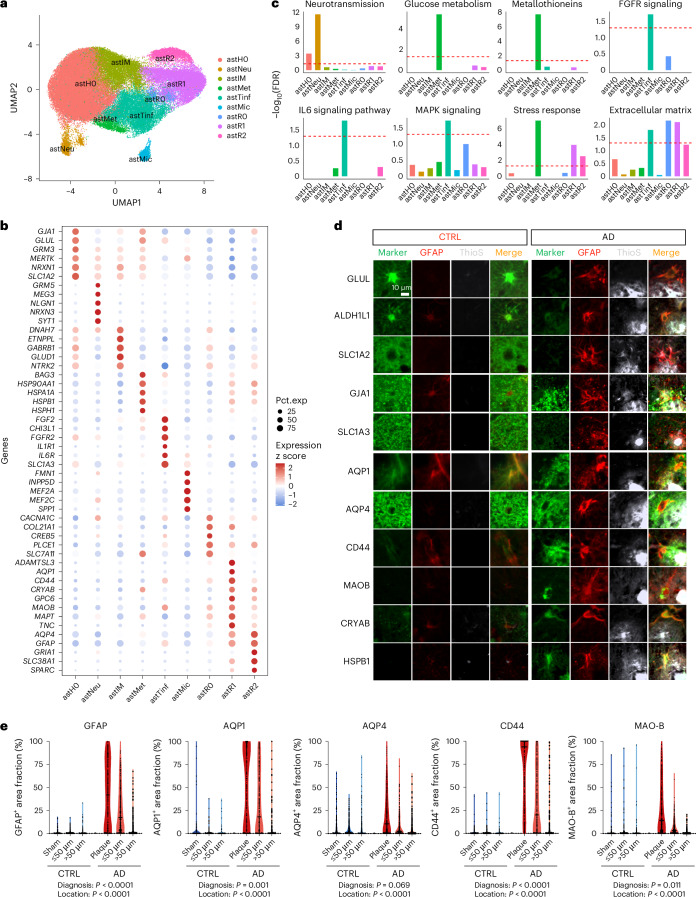
“a spatial quantitative analysis centered in thioflavin-S-positive dense-core Aβ plaques demonstrated a gradient of expression of the reactive markers from the plaque to the peri-plaque halo (≤50 μm) to areas distant (>50 μm) from plaques in the AD cortex, whereas no effect of sham plaques was observed in control cortex”
§ Astrocyte transcriptomic changes along the spatiotemporal progression of Alzheimer’s disease > Results > Astrocyte clustering analysis reveals diverse transcriptomic programs across brain regions and pathology stages
boostedcorrelational- Asserted: passes — The authors put it forward as true.
- Checkable: passes — It can be checked against evidence.
- Load-bearing: passes — The paper’s conclusions depend on it.
- Based: passes — The paper gives a reason why it holds.
It may state two separate claims as one.
A result the paper reports from its own data — it cites no other source for it, so there is none to check. The quote shows it is in the paper.
In the paper
“only astMet was significantly associated with sex (higher frequency in female donors, P < 0.005), but the effect size was small (β = 0.046).”
§ Astrocyte transcriptomic changes along the spatiotemporal progression of Alzheimer’s disease > Results > Dynamic transcriptomic changes in astrocyte subclusters along AD progression
plaincorrelational- Asserted: passes — The authors put it forward as true.
- Checkable: passes — It can be checked against evidence.
- Load-bearing: fails — The paper’s conclusions may not depend on it.
- Based: passes — The paper gives a reason why it holds.
Probably not a substantial claim. The paper’s conclusions may not depend on it. It may state two separate claims as one.
A result the paper reports from its own data — it cites no other source for it, so there is none to check. The quote shows it is in the paper.
In the paper
“While this gene set was negatively correlated with both Aβ plaque burden and pTau/tau ratio, the statistical significance was lost after controlling for brain region.”
§ Astrocyte transcriptomic changes along the spatiotemporal progression of Alzheimer’s disease > Results > Astrocyte transcriptomic changes along the stereotypical spatial progression of AD
plaincorrelational- Asserted: passes — The authors put it forward as true.
- Checkable: passes — It can be checked against evidence.
- Load-bearing: unclear — It is unclear whether the paper’s conclusions depend on it.
- Based: passes — The paper gives a reason why it holds.
It may state two separate claims as one.
A result the paper reports from its own data — it cites no other source for it, so there is none to check. The quote shows it is in the paper.
In the paper
“confirmed the highest expression in stage 3 and very low expression in stage 4”
§ Astrocyte transcriptomic changes along the spatiotemporal progression of Alzheimer’s disease > Results > Dynamic transcriptomic changes in astrocyte subclusters along AD progression
boostedcorrelational- Asserted: passes — The authors put it forward as true.
- Checkable: passes — It can be checked against evidence.
- Load-bearing: unclear — It is unclear whether the paper’s conclusions depend on it.
- Based: passes — The paper gives a reason why it holds.
It may state two separate claims as one.
A result the paper reports from its own data — it cites no other source for it, so there is none to check. The quote shows it is in the paper.
In the paper
“the proportion of homeostatic astH0 astrocytes was significantly reduced in EC versus all other regions but did not change with pathology stages”
§ Astrocyte transcriptomic changes along the spatiotemporal progression of Alzheimer’s disease > Results > Dynamic transcriptomic changes in astrocyte subclusters along AD progression
plain- Asserted: passes — The authors put it forward as true.
- Checkable: passes — It can be checked against evidence.
- Load-bearing: passes — The paper’s conclusions depend on it.
- Based: passes — The paper gives a reason why it holds.
It may state two separate claims as one.
A result the paper reports from its own data — it cites no other source for it, so there is none to check. The quote shows it is in the paper.
In the paper
“astR1 and astR2 were enriched in GFAP, S100B, HSF1-mediated stress response (CRYAB, HSPA1B, HSPB8 and UBC), extracellular matrix (CD44, COL21A1, GPC6, LAMA4, SERPINA3, TNC and VCAN) and oxidative stress (MAOB), but differed in some other marker genes”
§ Astrocyte transcriptomic changes along the spatiotemporal progression of Alzheimer’s disease > Results > Astrocyte clustering analysis reveals diverse transcriptomic programs across brain regions and pathology stages
plaincorrelational- Asserted: passes — The authors put it forward as true.
- Checkable: passes — It can be checked against evidence.
- Load-bearing: passes — The paper’s conclusions depend on it.
- Based: passes — The paper gives a reason why it holds.
It may state two separate claims as one.
A result the paper reports from its own data — it cites no other source for it, so there is none to check. The quote shows it is in the paper.
In the paper
“astMet exhibited a positive enrichment in temporal gene set 3 (characterized by upregulation of proteostasis, mitochondrial electron transport chain and metallothioneins in pathology stage 3 and normalization in pathology stage 4) and a negative enrichment of temporal gene set 4”
§ Astrocyte transcriptomic changes along the spatiotemporal progression of Alzheimer’s disease > Results > Dynamic transcriptomic changes in astrocyte subclusters along AD progression
plaincorrelational- Asserted: passes — The authors put it forward as true.
- Checkable: passes — It can be checked against evidence.
- Load-bearing: passes — The paper’s conclusions depend on it.
- Based: passes — The paper gives a reason why it holds.
It may state two separate claims as one.
A result the paper reports from its own data — it cites no other source for it, so there is none to check. The quote shows it is in the paper.
In the paper
“the significantly increased frequency of astMet in pathology stage 3 relative to pathology stages 1 and 2, with a subsequent decrease in pathology stage 4”
§ Astrocyte transcriptomic changes along the spatiotemporal progression of Alzheimer’s disease > Results > Dynamic transcriptomic changes in astrocyte subclusters along AD progression
plaincorrelational- Asserted: passes — The authors put it forward as true.
- Checkable: passes — It can be checked against evidence.
- Load-bearing: passes — The paper’s conclusions depend on it.
- Based: passes — The paper gives a reason why it holds.
It may state two separate claims as one.
A result the paper reports from its own data — it cites no other source for it, so there is none to check. The quote shows it is in the paper.
In the paper
“The gene set with relatively stable expression in EC through PFC and lower expression in V2 and V1 (gene set 5) was enriched in EC-low and V1-low genes, and the gene set with stable levels in EC through PFC but increase in V2 and V1 (gene set 6) was expectedly enriched in V1-high genes (Fig. 3b).”
§ Astrocyte transcriptomic changes along the spatiotemporal progression of Alzheimer’s disease > Results > Astrocyte transcriptomic changes along the stereotypical spatial progression of AD
plaincorrelational- Asserted: passes — The authors put it forward as true.
- Checkable: passes — It can be checked against evidence.
- Load-bearing: unclear — It is unclear whether the paper’s conclusions depend on it.
- Based: passes — The paper gives a reason why it holds.
It may state two separate claims as one.
A result the paper reports from its own data — it cites no other source for it, so there is none to check. The quote shows it is in the paper.
In the paper
“we identified an EC-specific astrocyte signature, which included changes in genes relevant to AD pathophysiology such as an upregulation of APP and APOE and a downregulation of SLC1A2 (encoding the glutamate transporter EAAT2, a.k.a. GLT-1) and MAPT (encoding the microtubule-associated protein tau) relative to other cortical regions”
§ Astrocyte transcriptomic changes along the spatiotemporal progression of Alzheimer’s disease > Discussion
plaincorrelational- Asserted: passes — The authors put it forward as true.
- Checkable: passes — It can be checked against evidence.
- Load-bearing: passes — The paper’s conclusions depend on it.
- Based: passes — The paper gives a reason why it holds.
It may state two separate claims as one.
A result the paper reports from its own data — it cites no other source for it, so there is none to check. The quote shows it is in the paper.
In the paper
“Finally, spatial gene set 5 was positively correlated with both pTau/tau ratio and Aβ plaque burden, whereas gene set 6 was negatively correlated with both measures”
§ Astrocyte transcriptomic changes along the spatiotemporal progression of Alzheimer’s disease > Results > Astrocyte transcriptomic changes along the stereotypical spatial progression of AD
plaincorrelational- Asserted: passes — The authors put it forward as true.
- Checkable: passes — It can be checked against evidence.
- Load-bearing: passes — The paper’s conclusions depend on it.
- Based: passes — The paper gives a reason why it holds.
It may state two separate claims as one.
- Rests on an assumption: The local Aβ plaque load and pTau/tau ratio measured in adjacent tissue samples reflect the local ADNC burden experienced by the astrocytes sequenced from the same brain region.
A result the paper reports from its own data — it cites no other source for it, so there is none to check. The quote shows it is in the paper.
In the paper
“both astR1 and astR2 reactive astrocytes were more frequent in EC and ITG, and the frequency of astR1 tended to increase with pathology stages”
§ Astrocyte transcriptomic changes along the spatiotemporal progression of Alzheimer’s disease > Results > Dynamic transcriptomic changes in astrocyte subclusters along AD progression
plaincorrelational- Asserted: passes — The authors put it forward as true.
- Checkable: passes — It can be checked against evidence.
- Load-bearing: passes — The paper’s conclusions depend on it.
- Based: passes — The paper gives a reason why it holds.
It may state two separate claims as one.
A result the paper reports from its own data — it cites no other source for it, so there is none to check. The quote shows it is in the paper.
In the paper
“The gene set specifically upregulated in PFC (gene set 3) was not enriched in either EC or V1 signatures, whereas the gene set specifically downregulated in PFC was enriched in EC-high and V1-high genes.”
§ Astrocyte transcriptomic changes along the spatiotemporal progression of Alzheimer’s disease > Results > Astrocyte transcriptomic changes along the stereotypical spatial progression of AD
plain- Asserted: passes — The authors put it forward as true.
- Checkable: passes — It can be checked against evidence.
- Load-bearing: unclear — It is unclear whether the paper’s conclusions depend on it.
- Based: passes — The paper gives a reason why it holds.
It may state two separate claims as one.
A result the paper reports from its own data — it cites no other source for it, so there is none to check. The quote shows it is in the paper.
In the paper
“Subcluster astR0 also exhibited a reactive phenotype and was further enriched in extracellular matrix genes (COL21A1, COL24A1, COLGAT and LAMA2).”
§ Astrocyte transcriptomic changes along the spatiotemporal progression of Alzheimer’s disease > Results > Astrocyte clustering analysis reveals diverse transcriptomic programs across brain regions and pathology stages
plaincorrelational- Asserted: passes — The authors put it forward as true.
- Checkable: passes — It can be checked against evidence.
- Load-bearing: unclear — It is unclear whether the paper’s conclusions depend on it.
- Based: passes — The paper gives a reason why it holds.
It may state two separate claims as one.
A result the paper reports from its own data — it cites no other source for it, so there is none to check. The quote shows it is in the paper.
In the paper
“Two other temporal gene sets either peaked (gene set 3) or dropped (gene set 4) at the late stage (moderate/frequent NPs, Braak NFT stage V) but surprisingly returned to near baseline at end stage (moderate/frequent NPs, Braak NFT stage VI)”
§ Astrocyte transcriptomic changes along the spatiotemporal progression of Alzheimer’s disease > Results > Astrocyte transcriptomic changes along the temporal progression of AD
plaincorrelational- Asserted: passes — The authors put it forward as true.
- Checkable: passes — It can be checked against evidence.
- Load-bearing: passes — The paper’s conclusions depend on it.
- Based: passes — The paper gives a reason why it holds.
It may state two separate claims as one.
- Rests on an assumption: The four pathology stages, based on cross-sectional CERAD NP scores and Braak NFT stages, represent the temporal progression of ADNC within a brain region.
A result the paper reports from its own data — it cites no other source for it, so there is none to check. The quote shows it is in the paper.
In the paper
“The proportion of reactive astR0 astrocytes increased in parallel with pathology stages and decreased along brain regions from EC to V1.”
§ Astrocyte transcriptomic changes along the spatiotemporal progression of Alzheimer’s disease > Results > Dynamic transcriptomic changes in astrocyte subclusters along AD progression
plaindirect- Asserted: passes — The authors put it forward as true.
- Checkable: passes — It can be checked against evidence.
- Load-bearing: passes — The paper’s conclusions depend on it.
- Based: passes — The paper gives a reason why it holds.
It may state two separate claims as one.
A result the paper reports from its own data — it cites no other source for it, so there is none to check. The quote shows it is in the paper.
In the paper
“Specifically, the gene set with monotonic decrease from EC to V1 (gene set 1) was significantly enriched in EC-high and V1-low genes, whereas the gene set with monotonic increase from EC to V1 (gene set 2) was significantly enriched in EC-low and V1-high genes.”
§ Astrocyte transcriptomic changes along the spatiotemporal progression of Alzheimer’s disease > Results > Astrocyte transcriptomic changes along the stereotypical spatial progression of AD
plaincorrelational- Asserted: passes — The authors put it forward as true.
- Checkable: passes — It can be checked against evidence.
- Load-bearing: passes — The paper’s conclusions depend on it.
- Based: passes — The paper gives a reason why it holds.
It may state two separate claims as one.
A result the paper reports from its own data — it cites no other source for it, so there is none to check. The quote shows it is in the paper.
In the paper
“the reactive subclusters had a positive enrichment score for spatial gene set 1 (positively correlated with pTau) as well as spatial gene set 4 (stress chaperones/heat-shock response genes) and a negative enrichment score for spatial gene set 2 (negatively correlated with pTau), whereas the homeostatic subcluster astH0 demonstrated the opposite effects”
§ Astrocyte transcriptomic changes along the spatiotemporal progression of Alzheimer’s disease > Results > Dynamic transcriptomic changes in astrocyte subclusters along AD progression
plaincorrelational- Asserted: passes — The authors put it forward as true.
- Checkable: passes — It can be checked against evidence.
- Load-bearing: passes — The paper’s conclusions depend on it.
- Based: passes — The paper gives a reason why it holds.
It may state two separate claims as one.
A result the paper reports from its own data — it cites no other source for it, so there is none to check. The quote shows it is in the paper.
In the paper
“the frequency of astIM declined along the spatial axis but was reduced only in pathology stage 3”
§ Astrocyte transcriptomic changes along the spatiotemporal progression of Alzheimer’s disease > Results > Dynamic transcriptomic changes in astrocyte subclusters along AD progression
plaincorrelational- Asserted: passes — The authors put it forward as true.
- Checkable: passes — It can be checked against evidence.
- Load-bearing: unclear — It is unclear whether the paper’s conclusions depend on it.
- Based: passes — The paper gives a reason why it holds.
It may state two separate claims as one.
A result the paper reports from its own data — it cites no other source for it, so there is none to check. The quote shows it is in the paper.
In the paper
“the homeostatic astH0 astrocytes also transitioned to astMet and astTinf, which appeared to be terminal states with no further progression into the reactive subclusters”
§ Astrocyte transcriptomic changes along the spatiotemporal progression of Alzheimer’s disease > Results > Dynamic transcriptomic changes in astrocyte subclusters along AD progression
hedgeddirect- Asserted: passes — The authors put it forward as true.
- Checkable: passes — It can be checked against evidence.
- Load-bearing: passes — The paper’s conclusions depend on it.
- Based: passes — The paper gives a reason why it holds.
It may state two separate claims as one.
A result the paper reports from its own data — it cites no other source for it, so there is none to check. The quote shows it is in the paper.
In the paper
“reactive astrocytes represent less than 25% of all astrocyte nuclei and express higher levels of aquaporins, heat-shock proteins, extracellular matrix and cytoskeletal genes”
§ Astrocyte transcriptomic changes along the spatiotemporal progression of Alzheimer’s disease > Discussion
plaincorrelational- Asserted: passes — The authors put it forward as true.
- Checkable: passes — It can be checked against evidence.
- Load-bearing: passes — The paper’s conclusions depend on it.
- Based: passes — The paper gives a reason why it holds.
It may state two separate claims as one.
A result the paper reports from its own data — it cites no other source for it, so there is none to check. The quote shows it is in the paper.
In the paper
“homeostatic astrocytes constitute the majority of the astrocyte population, regardless of the severity of AD pathology, and express higher levels of typical homeostatic genes such as glutamate metabolism-related genes”
§ Astrocyte transcriptomic changes along the spatiotemporal progression of Alzheimer’s disease > Discussion
plain- Asserted: passes — The authors put it forward as true.
- Checkable: passes — It can be checked against evidence.
- Load-bearing: passes — The paper’s conclusions depend on it.
- Based: passes — The paper gives a reason why it holds.
It may state two separate claims as one.
A conclusion the paper draws from its own results — it cites no other source for it, so there is none to check. The quote shows it is in the paper.
In the paper
“these results could be indicating that astrocytes, as part of the tripartite excitatory synapses, have a key role in synaptic dysfunction and the trans-synaptic propagation of pTau between excitatory neurons along vulnerable AD neural networks”
§ Astrocyte transcriptomic changes along the spatiotemporal progression of Alzheimer’s disease > Discussion
hedgedconditional- Asserted: passes — The authors put it forward as true.
- Checkable: passes — It can be checked against evidence.
- Load-bearing: passes — The paper’s conclusions depend on it.
- Based: passes — The paper gives a reason why it holds.
It may state two separate claims as one.
A conclusion the paper draws from its own results — it cites no other source for it, so there is none to check. The quote shows it is in the paper.
In the paper
“astMet and astTinf are distinct subclusters that deviate from the prototypical homeostatic-to-reactive transition path”
§ Astrocyte transcriptomic changes along the spatiotemporal progression of Alzheimer’s disease > Results > Dynamic transcriptomic changes in astrocyte subclusters along AD progression
plain- Asserted: passes — The authors put it forward as true.
- Checkable: passes — It can be checked against evidence.
- Load-bearing: passes — The paper’s conclusions depend on it.
- Based: passes — The paper gives a reason why it holds.
It may state two separate claims as one.
A conclusion the paper draws from its own results — it cites no other source for it, so there is none to check. The quote shows it is in the paper.
In the paper
“these data suggest that astMet are undergoing exhaustion, that is, failure in proteostasis and energy metabolism, after prolonged exposure to ADNC (Braak stage VI).”
§ Astrocyte transcriptomic changes along the spatiotemporal progression of Alzheimer’s disease > Results > Dynamic transcriptomic changes in astrocyte subclusters along AD progression
hedgeddirect- Asserted: passes — The authors put it forward as true.
- Checkable: passes — It can be checked against evidence.
- Load-bearing: passes — The paper’s conclusions depend on it.
- Based: passes — The paper gives a reason why it holds.
It may state two separate claims as one.
A conclusion the paper draws from its own results — it cites no other source for it, so there is none to check. The quote shows it is in the paper.
In the paper
“Our data confirm that astrocytes, in addition to neurons, suffer mitochondrial dysfunction and energy deficits that contribute to these observed bulk RNA changes and could also potentially contribute to clinical progression.”
§ Astrocyte transcriptomic changes along the spatiotemporal progression of Alzheimer’s disease > Discussion
hedgedconditional- Asserted: passes — The authors put it forward as true.
- Checkable: passes — It can be checked against evidence.
- Load-bearing: passes — The paper’s conclusions depend on it.
- Based: passes — The paper gives a reason why it holds.
It may state two separate claims as one.
A conclusion the paper draws from its own results — it cites no other source for it, so there is none to check. The quote shows it is in the paper.
In the paper
“possibly reflecting differences in the duration of each stage across donors.”
§ Astrocyte transcriptomic changes along the spatiotemporal progression of Alzheimer’s disease > Results > Astrocyte transcriptomic changes along the temporal progression of AD
hedgedconditional- Asserted: passes — The authors put it forward as true.
- Checkable: passes — It can be checked against evidence.
- Load-bearing: fails — The paper’s conclusions may not depend on it.
- Based: passes — The paper gives a reason why it holds.
Probably not a substantial claim. The paper’s conclusions may not depend on it.
A conclusion the paper draws from its own results — it cites no other source for it, so there is none to check. The quote shows it is in the paper.
In the paper
“reactive astrocytes may initially increase their metabolic rate but finally fail to meet their energy needs and contribute to the typical bilateral temporoparietal hypometabolism observed in AD”
§ Astrocyte transcriptomic changes along the spatiotemporal progression of Alzheimer’s disease > Discussion
hedgedconditional- Asserted: passes — The authors put it forward as true.
- Checkable: passes — It can be checked against evidence.
- Load-bearing: unclear — It is unclear whether the paper’s conclusions depend on it.
- Based: passes — The paper gives a reason why it holds.
It may state two separate claims as one.
A conclusion the paper draws from its own results — it cites no other source for it, so there is none to check. The quote shows it is in the paper.
In the paper
“Together, these results underscore the dynamic, complex and nonlinear pattern of astrocyte transcriptomic changes along AD progression”
§ Astrocyte transcriptomic changes along the spatiotemporal progression of Alzheimer’s disease > Results > Comparison with other human snRNA-seq datasets
plaincorrelational- Asserted: passes — The authors put it forward as true.
- Checkable: passes — It can be checked against evidence.
- Load-bearing: passes — The paper’s conclusions depend on it.
- Based: passes — The paper gives a reason why it holds.
It may state two separate claims as one.
A conclusion the paper draws from its own results — it cites no other source for it, so there is none to check. The quote shows it is in the paper.
In the paper
“These findings indicate that astMet and astTinf are unique terminal subclusters with a complex, stage-dependent response to ADNC”
§ Astrocyte transcriptomic changes along the spatiotemporal progression of Alzheimer’s disease > Results > Dynamic transcriptomic changes in astrocyte subclusters along AD progression
hedgedcorrelational- Asserted: passes — The authors put it forward as true.
- Checkable: passes — It can be checked against evidence.
- Load-bearing: passes — The paper’s conclusions depend on it.
- Based: passes — The paper gives a reason why it holds.
It may state two separate claims as one.
A conclusion the paper draws from its own results — it cites no other source for it, so there is none to check. The quote shows it is in the paper.
In the paper
“likely representing ADNC-associated pan-reactive upregulated and downregulated signatures, respectively.”
§ Astrocyte transcriptomic changes along the spatiotemporal progression of Alzheimer’s disease > Results > Astrocyte transcriptomic changes along the stereotypical spatial progression of AD
hedgedcorrelational- Asserted: passes — The authors put it forward as true.
- Checkable: passes — It can be checked against evidence.
- Load-bearing: passes — The paper’s conclusions depend on it.
- Based: passes — The paper gives a reason why it holds.
It may state two separate claims as one.
A conclusion the paper draws from its own results — it cites no other source for it, so there is none to check. The quote shows it is in the paper.
In the paper
“uncovering two terminal states that are off-pathway the prototypical astrocyte reactivity, including a previously unrecognized exhausted state”
§ Astrocyte transcriptomic changes along the spatiotemporal progression of Alzheimer’s disease > Results > Comparison with other human snRNA-seq datasets
plain- Asserted: passes — The authors put it forward as true.
- Checkable: passes — It can be checked against evidence.
- Load-bearing: passes — The paper’s conclusions depend on it.
- Based: passes — The paper gives a reason why it holds.
It may state two separate claims as one.
A conclusion the paper draws from its own results — it cites no other source for it, so there is none to check. The quote shows it is in the paper.
In the paper
“and suggest that these astrocyte transcriptomic changes are partly associated with the local levels of Aβ plaques and/or pTau and partly explained by region-specific microenvironmental factors.”
§ Astrocyte transcriptomic changes along the spatiotemporal progression of Alzheimer’s disease > Results > Astrocyte transcriptomic changes along the stereotypical spatial progression of AD
hedgedcorrelational- Asserted: passes — The authors put it forward as true.
- Checkable: passes — It can be checked against evidence.
- Load-bearing: passes — The paper’s conclusions depend on it.
- Based: passes — The paper gives a reason why it holds.
It may state two separate claims as one.
What the paper did — it cites no source for this, so there is none to check. The quote shows it is in the paper.
In the paper
“Data were analyzed running mixed-effects models with diagnosis and location as fixed effects and donor ID as random effect to account for within-donor correlation.”
§ Astrocyte transcriptomic changes along the spatiotemporal progression of Alzheimer’s disease > Results > Astrocyte clustering analysis reveals diverse transcriptomic programs across brain regions and pathology stages
plain- Asserted: passes — The authors put it forward as true.
- Checkable: passes — It can be checked against evidence.
- Load-bearing: passes — The paper’s conclusions depend on it.
- Based: passes — The paper gives a reason why it holds.
Probably not a substantial claim.
What the paper did — it cites no source for this, so there is none to check. The quote shows it is in the paper.
In the paper
“Batch effects due to technical variation were corrected using the RunHarmony function in Harmony (v.0.1.1) package64, with the top 20 principal components as input.”
§ Astrocyte transcriptomic changes along the spatiotemporal progression of Alzheimer’s disease > Methods > Bioinformatics analyses
plaindirect- Asserted: passes — The authors put it forward as true.
- Checkable: passes — It can be checked against evidence.
- Load-bearing: passes — The paper’s conclusions depend on it.
- Based: passes — The paper gives a reason why it holds.
Probably not a substantial claim.
What the paper did — it cites no source for this, so there is none to check. The quote shows it is in the paper.
In the paper
“in each AD donor, n = 50 Thioflavin-S-positive dense-core plaques were randomly selected and outlined throughout all layers of the cortical ribbon in the green channel being blindfolded to the expression level of the reactive astrocyte marker of interest in the red channel.”
§ Astrocyte transcriptomic changes along the spatiotemporal progression of Alzheimer’s disease > Methods > Immunohistochemistry and quantitative analyses on postmortem brain sections
plain- Asserted: passes — The authors put it forward as true.
- Checkable: passes — It can be checked against evidence.
- Load-bearing: passes — The paper’s conclusions depend on it.
- Based: passes — The paper gives a reason why it holds.
Probably not a substantial claim.
What the paper did — it cites no source for this, so there is none to check. The quote shows it is in the paper.
In the paper
“For each brain region, we removed cells with fewer than 200 genes, greater than 20,000 unique molecular identifiers (UMIs) and/or greater than 15% mitochondrial genes”
§ Astrocyte transcriptomic changes along the spatiotemporal progression of Alzheimer’s disease > Methods > Bioinformatics analyses
plain- Asserted: passes — The authors put it forward as true.
- Checkable: passes — It can be checked against evidence.
- Load-bearing: passes — The paper’s conclusions depend on it.
- Based: passes — The paper gives a reason why it holds.
Probably not a substantial claim.
What the paper did — it cites no source for this, so there is none to check. The quote shows it is in the paper.
In the paper
“After filtering, a second round of integration was performed via canonical correlation analysis to regress out donor-specific effects as well as the percentage of mitochondrial genes.”
§ Astrocyte transcriptomic changes along the spatiotemporal progression of Alzheimer’s disease > Methods > Bioinformatics analyses
plaindirect- Asserted: passes — The authors put it forward as true.
- Checkable: passes — It can be checked against evidence.
- Load-bearing: passes — The paper’s conclusions depend on it.
- Based: passes — The paper gives a reason why it holds.
Probably not a substantial claim.
What the paper did — it cites no source for this, so there is none to check. The quote shows it is in the paper.
In the paper
“no randomization was performed”
§ Astrocyte transcriptomic changes along the spatiotemporal progression of Alzheimer’s disease > Methods > Human specimens
plain- Asserted: passes — The authors put it forward as true.
- Checkable: passes — It can be checked against evidence.
- Load-bearing: fails — The paper’s conclusions may not depend on it.
- Based: passes — The paper gives a reason why it holds.
Probably not a substantial claim. The paper’s conclusions may not depend on it.
What the paper did — it cites no source for this, so there is none to check. The quote shows it is in the paper.
In the paper
“RIN value was measured from 130 donors, of which 83 met the selected cut-off of RIN ≥ 5.”
§ Astrocyte transcriptomic changes along the spatiotemporal progression of Alzheimer’s disease > Methods > Human specimens
plainn = 83- Asserted: passes — The authors put it forward as true.
- Checkable: passes — It can be checked against evidence.
- Load-bearing: passes — The paper’s conclusions depend on it.
- Based: passes — The paper gives a reason why it holds.
Probably not a substantial claim.
What the paper did — it cites no source for this, so there is none to check. The quote shows it is in the paper.
In the paper
“Statistical analyses were conducted with mixed-effects models with area fraction of the reactive marker as the dependent variable, diagnosis (control versus AD) and location (sham or Thioflavin-S-positive plaque, ≤50 μm halo, or >50 μm) as fixed effects and controlling for donor ID (random effect).”
§ Astrocyte transcriptomic changes along the spatiotemporal progression of Alzheimer’s disease > Methods > Immunohistochemistry and quantitative analyses on postmortem brain sections
plain- Asserted: passes — The authors put it forward as true.
- Checkable: passes — It can be checked against evidence.
- Load-bearing: passes — The paper’s conclusions depend on it.
- Based: passes — The paper gives a reason why it holds.
Probably not a substantial claim.
A conclusion the paper draws from its own results — it cites no other source for it, so there is none to check. The quote shows it is in the paper.
In the paper
“corresponds to the exhausted astrocytes whose proportion and gene expression program peak in AD late stage (Braak stage V) and normalize in end stage (Braak stage VI)”
§ Astrocyte transcriptomic changes along the spatiotemporal progression of Alzheimer’s disease > Discussion
plaincorrelational- Asserted: passes — The authors put it forward as true.
- Checkable: passes — It can be checked against evidence.
- Load-bearing: passes — The paper’s conclusions depend on it.
- Based: passes — The paper gives a reason why it holds.
It may state two separate claims as one.
What the paper did — it cites no source for this, so there is none to check. The quote shows it is in the paper.
In the paper
“Data collection and analysis were not performed blind to neuropathological diagnosis.”
§ Astrocyte transcriptomic changes along the spatiotemporal progression of Alzheimer’s disease > Methods > Human specimens
plain- Asserted: passes — The authors put it forward as true.
- Checkable: passes — It can be checked against evidence.
- Load-bearing: fails — The paper’s conclusions may not depend on it.
- Based: passes — The paper gives a reason why it holds.
Probably not a substantial claim. The paper’s conclusions may not depend on it.
What the paper did — it cites no source for this, so there is none to check. The quote shows it is in the paper.
In the paper
“No donors or samples were excluded from the analysis.”
§ Astrocyte transcriptomic changes along the spatiotemporal progression of Alzheimer’s disease > Methods > Human specimens
plain- Asserted: passes — The authors put it forward as true.
- Checkable: passes — It can be checked against evidence.
- Load-bearing: fails — The paper’s conclusions may not depend on it.
- Based: passes — The paper gives a reason why it holds.
Probably not a substantial claim. The paper’s conclusions may not depend on it.
What the paper did — it cites no source for this, so there is none to check. The quote shows it is in the paper.
In the paper
“Astrocyte nuclei were identified by their high expression of ADGRV1, ALDH1L1, AQP4 and GFAP.”
§ Astrocyte transcriptomic changes along the spatiotemporal progression of Alzheimer’s disease > Methods > Bioinformatics analyses
plaincorrelational- Asserted: passes — The authors put it forward as true.
- Checkable: passes — It can be checked against evidence.
- Load-bearing: passes — The paper’s conclusions depend on it.
- Based: passes — The paper gives a reason why it holds.
Probably not a substantial claim.
What the paper did — it cites no source for this, so there is none to check. The quote shows it is in the paper.
In the paper
“No statistical methods were used to predetermine sample sizes”
§ Astrocyte transcriptomic changes along the spatiotemporal progression of Alzheimer’s disease > Methods > Human specimens
plain- Asserted: passes — The authors put it forward as true.
- Checkable: passes — It can be checked against evidence.
- Load-bearing: fails — The paper’s conclusions may not depend on it.
- Based: passes — The paper gives a reason why it holds.
Probably not a substantial claim. The paper’s conclusions may not depend on it.
What the paper did — it cites no source for this, so there is none to check. The quote shows it is in the paper.
In the paper
“Significance was evaluated by a two-sided Welch’s t test. P values were adjusted using the Benjamini–Hochberg method to correct for multiple comparisons when two or more comparisons were conducted within studies.”
§ Astrocyte transcriptomic changes along the spatiotemporal progression of Alzheimer’s disease > Results > Comparison with other human snRNA-seq datasets
plain- Asserted: passes — The authors put it forward as true.
- Checkable: passes — It can be checked against evidence.
- Load-bearing: passes — The paper’s conclusions depend on it.
- Based: passes — The paper gives a reason why it holds.
Probably not a substantial claim. It may state two separate claims as one.
What the paper did — it cites no source for this, so there is none to check. The quote shows it is in the paper.
In the paper
“Donors were selected based on their global AD neuropathological burden”
§ Astrocyte transcriptomic changes along the spatiotemporal progression of Alzheimer’s disease > Methods > Human specimens
plainn = 32- Asserted: passes — The authors put it forward as true.
- Checkable: passes — It can be checked against evidence.
- Load-bearing: passes — The paper’s conclusions depend on it.
- Based: passes — The paper gives a reason why it holds.
Probably not a substantial claim.
What the paper did — it cites no source for this, so there is none to check. The quote shows it is in the paper.
In the paper
“used reciprocal principal component analysis (rPCA) integration based on the top 2,000 highly variable genes (HVGs) to remove donor-specific effects using the Seurat R package (v.4.3.0)60.”
§ Astrocyte transcriptomic changes along the spatiotemporal progression of Alzheimer’s disease > Methods > Bioinformatics analyses
plaindirect- Asserted: passes — The authors put it forward as true.
- Checkable: passes — It can be checked against evidence.
- Load-bearing: passes — The paper’s conclusions depend on it.
- Based: passes — The paper gives a reason why it holds.
Probably not a substantial claim.
What the paper did — it cites no source for this, so there is none to check. The quote shows it is in the paper.
In the paper
“Multiplex fluorescence immunohistochemistry images in Figs. 2c and 5d as well as Supplementary Figs. 5, 6 and 7 have the same display settings across brain regions and diagnoses.”
§ Astrocyte transcriptomic changes along the spatiotemporal progression of Alzheimer’s disease > Methods > Immunohistochemistry and quantitative analyses on postmortem brain sections
plain- Asserted: passes — The authors put it forward as true.
- Checkable: passes — It can be checked against evidence.
- Load-bearing: fails — The paper’s conclusions may not depend on it.
- Based: passes — The paper gives a reason why it holds.
Probably not a substantial claim. The paper’s conclusions may not depend on it.
What the paper did — it cites no source for this, so there is none to check. The quote shows it is in the paper.
In the paper
“The effects of factors such as age and sex on cell subcluster frequency across samples were modeled using multiple linear regression with the formula: frequency ~1 + pTau/tau + region + sex + age + pTau/tau × sex + pTau/tau × region.”
§ Astrocyte transcriptomic changes along the spatiotemporal progression of Alzheimer’s disease > Methods > Bioinformatics analyses
plaincorrelational- Asserted: passes — The authors put it forward as true.
- Checkable: passes — It can be checked against evidence.
- Load-bearing: fails — The paper’s conclusions may not depend on it.
- Based: passes — The paper gives a reason why it holds.
Probably not a substantial claim. The paper’s conclusions may not depend on it.
The paper relies on this without support.
The four pathology stages, based on cross-sectional CERAD NP scores and Braak NFT stages, represent the temporal progression of ADNC within a brain region.
“To reflect the progression of ADNC, we then grouped the 32 donors into four pathology stages based on their global semiquantitative measures of neuritic plaques (Consortium to Establish a Registry for Alzheimer’s Disease (CERAD) neuritic plaque (NP) score) and NFTs (Braak NFT stages) complemented with these immunohistochemical and biochemical quantitative measures of local Aβ and pTau burdens.”
The paper relies on this without support.
The local Aβ plaque load and pTau/tau ratio measured in adjacent tissue samples reflect the local ADNC burden experienced by the astrocytes sequenced from the same brain region.
“Because astrocyte morphology changes near Aβ plaques and pTau NFTs23,24, we quantified the local burden of ADNC in adjacent tissue samples by measuring the 3D6-positive Aβ-immunoreactive percentage area fraction via immunohistochemistry and the pTau/total tau ratio via ELISA.”
The paper relies on this without support.
Single-nucleus RNA sequencing of astrocyte nuclei accurately reflects the astrocyte transcriptome.
“Astrocyte nuclei were identified by the expression levels of the marker genes ADGRV1 (refs. 13,22), ALDH1L1, aquaporin-4 (AQP4) and GFAP (Fig. 1c)”
The authors state this as an assumption.
Autopsy findings of ADNC severity can be temporally ordered.
“Assuming that autopsy findings of ADNC severity can be temporally ordered, which is well supported by the PET imaging biomarker literature”
The paper relies on this without support.
The five brain regions can be rank ordered along a spatial axis following the typical hierarchical progression of AD.
“When we rank ordered the five brain regions along a spatial axis following the typical hierarchical progression of AD”
The paper relies on this without support.
Cross-sectional Braak NFT stages in donor brains can be interpreted as a temporal progression of ADNC exposure.
“our five-region snRNA-seq study of astrocytes from 32 donors spanning the normal aging-severe AD continuum”
The paper relies on this without support.
snRNA-seq clusters and pseudotime/RNA velocity trajectories correspond to actual astrocyte state transitions in vivo.
“uncovers the existence of intermediate states that appear to be transitional between homeostatic and reactive astrocytes”
The paper relies on this without support.
Postmortem brain tissue transcriptomes reflect antemortem astrocyte biology.
“Frozen (−80 °C) brain specimens from 32 participants were obtained from the Massachusetts Alzheimer’s Disease Research Center (MADRC) Brain Bank”
Claims other papers make about this one
Each is checked against this paper’s own text: does it say what the citing paper says it does?
The source backs part of the claim, not all of it — or backs it for a different population, condition or comparison.
In the citing paper
“This subcluster was enriched for genes involved in extracellular matrix organization [102, 135, 136], metabolic support [135, 137], and inflammatory modulation [138–141].”
From Tau Ablation Rewires Brain Cell Programs in Health and Restores Function in Disease (2026) · cites this paper as [135]
Experimental — accuracy not yet measured
Self-check
Percentages, sums and reported differences re-computed from the paper’s own numbers.
Each contradiction between two passages listed here was confirmed by an independent check.
Rated major: it would touch a result — a value a result rests on, reported and recomputed p-values on opposite sides of the significance level, two passages that conflict with no sign which is right, or a cited work retracted before this paper was published.
In the paper
§ Astrocyte transcriptomic changes along the spatiotemporal progression of Alzheimer’s disease > Abstract
“The proportion of homeostatic, intermediate and reactive astrocytes changed only along the spatial axis, whereas two other subclusters changed along the temporal axis.”
§ Astrocyte transcriptomic changes along the spatiotemporal progression of Alzheimer’s disease > Results > Dynamic transcriptomic changes in astrocyte subclusters along AD progression
“The proportion of reactive astR0 astrocytes increased in parallel with pathology stages and decreased along brain regions from EC to V1. Similarly, the frequency of astIM declined along the spatial axis but was reduced only in pathology stage 3.”
Rated minor: it would not touch a result — a value no result rests on, a p-value that stays on the same side of the significance level, or a conflict that is clerical, resolved elsewhere in the paper, or outside its own findings.
In the paper
§ Astrocyte transcriptomic changes along the spatiotemporal progression of Alzheimer’s disease > Results > A molecular survey of astrocytes in five brain regions affected stereotypically in AD
“the pTau/tau ratio was highest in EC and demonstrated the expected pattern EC > ITG > PFC > V2 > V1 across all stages”
§ Astrocyte transcriptomic changes along the spatiotemporal progression of Alzheimer’s disease > Results > A molecular survey of astrocytes in five brain regions affected stereotypically in AD
“| ITG | 0.343 ± 0.043 | 0.347 ± 0.056 | 0.494 ± 0.104 | 0.547 ± 0.162 | | PFC | 0.348 ± 0.021 | 0.333 ± 0.058 | 0.383 ± 0.124 | 0.505 ± 0.152 |”
Rated minor: it would not touch a result — a value no result rests on, a p-value that stays on the same side of the significance level, or a conflict that is clerical, resolved elsewhere in the paper, or outside its own findings.
In the paper
§ Astrocyte transcriptomic changes along the spatiotemporal progression of Alzheimer’s disease > Results > Astrocyte clustering analysis reveals diverse transcriptomic programs across brain regions and pathology stages
“integrated and clustered these nuclei into nine distinct astrocyte subclusters”
§ Astrocyte transcriptomic changes along the spatiotemporal progression of Alzheimer’s disease > Results > Astrocyte clustering analysis reveals diverse transcriptomic programs across brain regions and pathology stages
“a, UMAP plot of a subsample of 500 astrocyte nuclei from each donor and region, with the colors representing each of the ten astrocyte subclusters resulting from the clustering.”
Rated minor: it would not touch a result — a value no result rests on, a p-value that stays on the same side of the significance level, or a conflict that is clerical, resolved elsewhere in the paper, or outside its own findings.
In the paper
§ Astrocyte transcriptomic changes along the spatiotemporal progression of Alzheimer’s disease > Results > A molecular survey of astrocytes in five brain regions affected stereotypically in AD
“| Braak NFT stages | 0/I/II | II/III | V | VI |”
§ Astrocyte transcriptomic changes along the spatiotemporal progression of Alzheimer’s disease > Results > Comparison with other human snRNA-seq datasets
“Present study—n = 30 Braak stages 0–II, n = 39 Braak stages III–IV, n = 36 Braak stage V and n = 39 Braak stage VI”
Citations
Cites
Neuropathological stageing of Alzheimer-related changes.
Braak, H., & Braak, E. (1991) · Acta Neuropathologica · doi:10.1007/bf00308809 · Cited by 16,123
Integrated analysis of multimodal single-cell data
Hao, Y., Hao, S., Andersen-Nissen, E., Mauck, W. M., Zheng, S., Butler, A., Lee, M. J., Wilk, A. J., Darby, C., Zagar, M., et al. (2020) · doi:10.1101/2020.10.12.335331 · Cited by 15,508
Fast, sensitive and accurate integration of single-cell data with Harmony
Korsunsky, I., Millard, N., Fan, J., Slowikowski, K., Zhang, F., Wei, K., Baglaenko, Y., Brenner, M., Loh, P.-R., & Raychaudhuri, S. (2019) · Nature Methods · doi:10.1038/s41592-019-0619-0 · Cited by 10,488
QuPath: Open source software for digital pathology image analysis
Bankhead, P., Loughrey, M. B., Fernández, J. A., Dombrowski, Y., McArt, D. G., Dunne, P. D., McQuaid, S., Gray, R. T., Murray, L. J., Coleman, H. G., et al. (2017) · Scientific Reports · doi:10.1038/s41598-017-17204-5 · Cited by 8,908
SCANPY: large-scale single-cell gene expression data analysis
Wolf, F. A., Angerer, P., & Theis, F. J. (2018) · Genome Biology · doi:10.1186/s13059-017-1382-0 · Cited by 8,881
Molecular signatures database (MSigDB) 3.0
Liberzon, A., Subramanian, A., Pinchback, R., Thorvaldsdóttir, H., Tamayo, P., & Mesirov, J. P. (2011) · Bioinformatics · doi:10.1093/bioinformatics/btr260 · Cited by 7,111
La Manno, G., Soldatov, R., Zeisel, A., Braun, E., Hochgerner, H., Petukhov, V., Lidschreiber, K., Kastriti, M. E., Lönnerberg, P., Furlan, A., et al. (2018) · Nature · doi:10.1038/s41586-018-0414-6 · Cited by 4,118
Braak, H., Alafuzoff, I., Arzberger, T., Kretzschmar, H., & Del Tredici, K. (2006) · Acta Neuropathologica · doi:10.1007/s00401-006-0127-z · Cited by 3,172
Finak, G., McDavid, A., Yajima, M., Deng, J., Gersuk, V., Shalek, A. K., Slichter, C. K., Miller, H. W., McElrath, M. J., Prlic, M., et al. (2015) · Genome Biology · doi:10.1186/s13059-015-0844-5 · Cited by 3,159
Generalizing RNA velocity to transient cell states through dynamical modeling
Bergen, V., Lange, M., Peidli, S., Wolf, F. A., & Theis, F. J. (2020) · Nature Biotechnology · doi:10.1038/s41587-020-0591-3 · Cited by 2,951
Cited by
Sorted by citations
Molecular and metabolic heterogeneity of astrocytes and microglia
Hasel, P., Aisenberg, W. H., Bennett, F. C., & Liddelow, S. A. (2023) · Cell Metabolism · doi:10.1016/j.cmet.2023.03.006 · Cited by 135
Bryant, A. G., Li, Z., Jayakumar, R., Serrano‐Pozo, A., Woost, B., Hu, M., Woodbury, M. E., Wachter, A., Lin, G., Kwon, T., et al. (2023) · Journal of Neuroscience · doi:10.1523/jneurosci.0237-23.2023 · Cited by 84
Self-citationChen, H., Li, N., Liu, N., Zhu, H., Ma, C., Ye, Y., Shi, X., Luo, G., Dong, X., Tan, T., et al. (2025) · Alzheimer s Research & Therapy · doi:10.1186/s13195-025-01714-w · Cited by 49
“The presence of lesions in the brain can lead to astrocy-tosis and the occurrence of a reactive inflammatory state [39, 40].”
Microglia modulate Aβ-dependent astrocyte reactivity in Alzheimer’s disease
Ferrari‐Souza, J. P., Povala, G., Rahmouni, N., Bellaver, B., Ferreira, P. C. L., Bastiani, M. A. D., Leffa, D. T., Lussier, F. Z., Aguzzoli, C. S., Brum, W. S., et al. (2025) · Nature Neuroscience · doi:10.1038/s41593-025-02103-0 · Cited by 46
“https://doi.org/10.1038/s41593-025-02103-0 regional heterogeneity of glial cells in aging and disease 20,21 contributes to explaining the mismatch across some cortical brain areas.”
InfluentialEarly microglial and astrocyte reactivity in preclinical Alzheimer's disease
Fernández‐Matarrubia, M., Barrero, A. V., Renuncio‐García, M., Aguilella, M., Lage, C., López‐García, S., Ocejo-Vinyals, J. G., Martínez‐Dubarbie, F., Molfetta, G. D., Pozueta‐Cantudo, A., et al. (2025) · Alzheimer s & Dementia · doi:10.1002/alz.70502 · Cited by 37
Metadata
- Authors
- Serrano-Pozo, A., Li, H., Li, Z., Muñoz-Castro, C., Jaisa-aad, M., Healey, M. A., Welikovitch, L. A., Jayakumar, R., Bryant, A. G., Noori, A., Connors, T. R., Hu, M., Zhao, K., Liao, F., Lin, G., Pastika, T., Tamm, J., Abdourahman, A., Kwon, T., Bennett, R. E., Woodbury, M. E., Wachter, A., Talanian, R. V., Biber, K., Karran, E. H., Hyman, B. T., & Das, S.
- Affiliations
- Harvard University (US)
- Massachusetts General Hospital (US)
- AbbVie (United States) (US)
- AbbVie (Germany) (DE)
- Corresponding author
- Das, Sudeshna
- ORCID
- Serrano-Pozo, Alberto
- Li, Huan
- Li, Zhaozhi
- Muñoz-Castro, Clara
- Jaisa-aad, Methasit
- Healey, Molly A.
- Welikovitch, Lindsay A.
- Jayakumar, Rojashree
- Bryant, Annie G.
- Noori, Ayush
- Connors, Theresa R.
- Hu, Miwei
- Liao, Fan
- Lin, Gen
- Tamm, Joseph
- Bennett, Rachel E.
- Woodbury, Maya E.
- Wachter, Astrid
- Talanian, Robert V.
- Karran, Eric H.
- Hyman, Bradley T.
- Das, Sudeshna
- Venue
- Nature Neuroscience
- Published
- 2024-11-11
- Volume
- 27
- Issue
- 12
- Pages
- 2384-2400
- ISSN
- 1097-6256 (ISSN-L)
- 1546-1726
- PMC
- PMC11614739
- OpenAlex
- W4404224839
- Cited by
- 140
- References
- 77
- Citations by year
- 2026: 87 · 2025: 51
- FWCI
- 32.04
- Type
- journal article
- Language
- en
- Open access
- hybrid
- doi.org
- Licence
- Locations
- Nature Neuroscience (publishedVersion, cc-by-nc-nd)
- Research Square (acceptedVersion, cc-by)
- PubMed (publishedVersion)
- PubMed Central (submittedVersion, cc-by-nc-nd)
- Funders
- Massachusetts Life Sciences Center (Neuroscience Consortium award)
- Alzheimer’s Association (AACF-17-524184, AACF-17-524184-RAPID)
- Topics
- Life Sciences › Neuroscience › Cellular and Molecular Neuroscience › Alzheimer's disease research and treatments
- Life Sciences › Neuroscience › Neurology › Neuroinflammation and Neurodegeneration Mechanisms
- Life Sciences › Biochemistry, Genetics and Molecular Biology › Molecular Biology › Single-cell and spatial transcriptomics
- Keywords
- astrocytes, Alzheimer's disease, single-nucleus RNA sequencing, reactive astrocytes, brain regions, neuropathology, transcriptional programs
- MeSH terms
- Aged, Aged, 80 and over, Alzheimer Disease, Astrocytes, Brain, Female, Humans, Male, Middle Aged, Disease Progression, Transcriptome
About these checks
Registry, retraction, Cites and statistics results are computed, not judged, with one exception: a printed reference that no index lists is read once by a model before it counts as a citation error. Claims are extracted by a model and kept only when their quote appears verbatim in the text; each cited source is then checked, with a model’s help, for whether it says what the claim relies on. Those verdicts can be wrong — read the claim’s quote and the cited source before relying on one.
A language model drew the claims from the paper on 2026-10-27, under version 3 of the claim definition (model deepseek-v4.1-flash, prompt extract-v3).
A second model labelled each claim on 2026-10-27 (model jev-1.13-20260917, definition revision gold-guideline-v0.2).
Cited sources are checked with a language model’s help (gpt-6-sol).
Statistics and arithmetic are recomputed, not judged.
Confidence bands are shown only for fields calibrated on our annotated test set. None is calibrated yet, so no band is shown.
What counts as a claim ›How we measure confidence ›How we check this ›
Are you an author, or do you see a problem with this page? Request a review
