

The DOI matches its Crossref record; 49 of the 49 references it cites were found in a registry or an index.
A Comprehensive Mouse Transcriptomic BodyMap across 17 Tissues by RNA-seq
Open accessAbstract
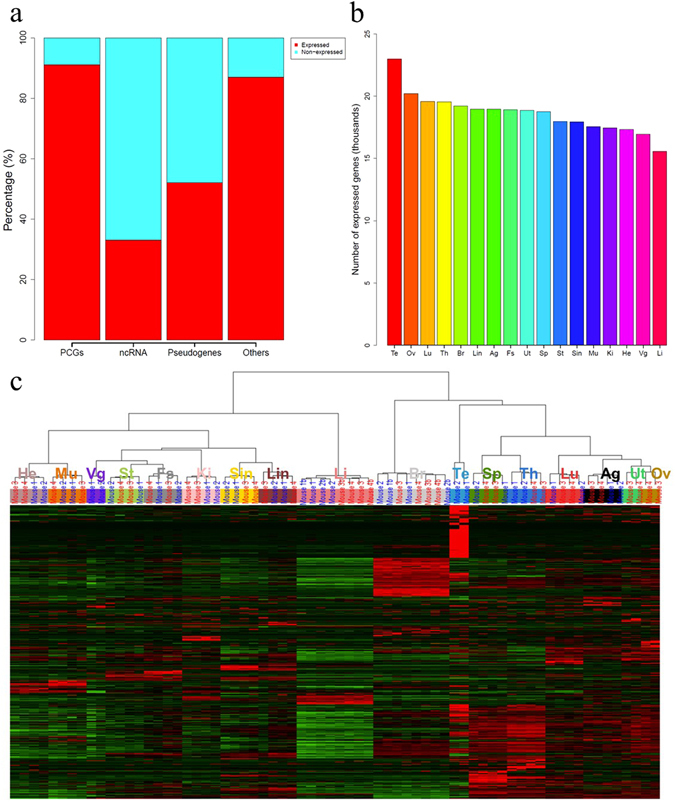
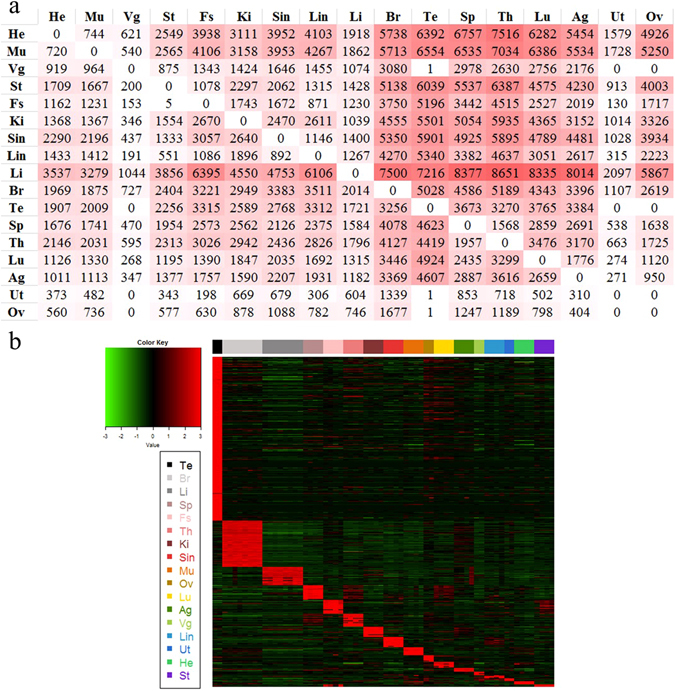
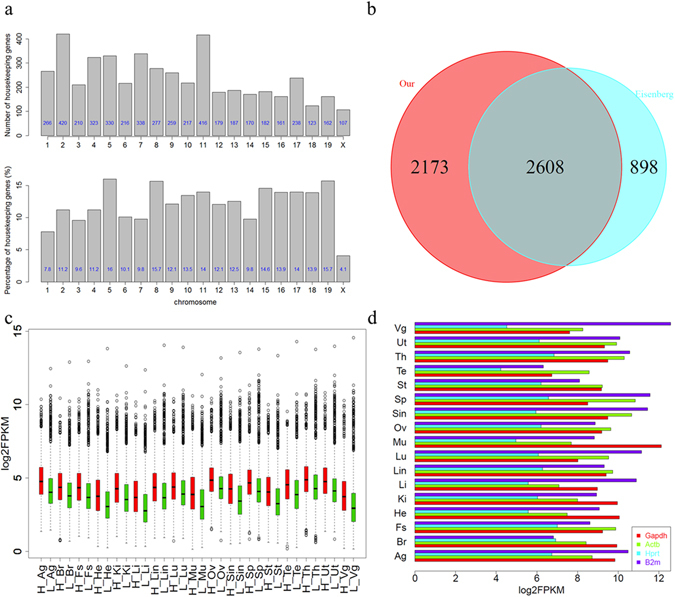
The mouse has been widely used as a model organism for studying human diseases and for evaluating drug safety and efficacy. Many diseases and drug effects exhibit tissue specificity that may be reflected by tissue-specific gene-expression profiles. Here we construct a comprehensive mouse transcriptomic BodyMap across 17 tissues of six-weeks old C57BL/6JJcl mice using RNA-seq. We find different expression patterns between protein-coding and non-coding genes. Liver expressed the least complex transcriptomes, that is, the smallest number of genes detected in liver across all 17 tissues, whereas testis and ovary harbor more complex transcriptomes than other tissues. We report a comprehensive list of tissue-specific genes across 17 tissues, along with a list of 4,781 housekeeping genes in mouse. In addition, we propose a list of 27 consistently and highly expressed genes that can be used as reference controls in expression-profiling analysis. Our study provides a unique resource of mouse gene-expression profiles, which is helpful for further biomedical research.
Overview
The claims and statistics of this paper haven’t been checked yet.
Run the check — free, no account needed. It reads the open-access text and checks the sources it cites.
Integrity signals
Registry
Cites
Statistics
Figures
Verification
Claims the paper makes
The claims and statistics of this paper haven’t been checked yet.
Run the check — free, no account needed. It reads the open-access text and checks the sources it cites.
Claims other papers make about this one
Each is checked against this paper’s own text: does it say what the citing paper says it does?
In the citing paper
“we found that the kidney and submandibular gland had higher expression of endogenous acidic β-gal”
From Elimination of senescent cells by β-galactosidase-targeted prodrug attenuates inflammation and restores physical function in aged mice (2020) · cites this paper as [51]
Self-check
Percentages, sums and reported differences re-computed from the paper’s own numbers.
The self-check needs the paper’s full text.
Citations
Cites
Trimmomatic: a flexible trimmer for Illumina sequence data
Bolger, A. M., Lohse, M., & Usadel, B. (2014) · Bioinformatics · doi:10.1093/bioinformatics/btu170 · Cited by 65,548
Fast gapped-read alignment with Bowtie 2
Langmead, B., & Salzberg, S. L. (2012) · Nature Methods · doi:10.1038/nmeth.1923 · Cited by 56,400
KEGG: Kyoto Encyclopedia of Genes and Genomes
Kanehisa, M. (2000) · Nucleic Acids Research · doi:10.1093/nar/28.1.27 · Cited by 37,077
KEGG: Kyoto Encyclopedia of Genes and Genomes
Ogata, H., Goto, S., Sato, K., Fujibuchi, W., Bono, H., & Kanehisa, M. (1999) · Nucleic Acids Research · doi:10.1093/nar/27.1.29 · Cited by 31,232
BEDTools: a flexible suite of utilities for comparing genomic features
Quinlan, A. R., & Hall, I. M. (2010) · Bioinformatics · doi:10.1093/bioinformatics/btq033 · Cited by 27,437
An integrated encyclopedia of DNA elements in the human genome
The ENCODE Project Consortium (2012) · Nature · doi:10.1038/nature11247 · Cited by 18,072
Trapnell, C., Williams, B. A., Pertea, G., Mortazavi, A., Kwan, G., van Baren, M. J., Salzberg, S. L., Wold, B. J., & Pachter, L. (2010) · Nature Biotechnology · doi:10.1038/nbt.1621 · Cited by 15,556
Mapping and quantifying mammalian transcriptomes by RNA-Seq
Mortazavi, A., Williams, B. A., McCue, K., Schaeffer, L., & Wold, B. (2008) · Nature Methods · doi:10.1038/nmeth.1226 · Cited by 13,696
A scaling normalization method for differential expression analysis of RNA-seq data
Robinson, M. D., & Oshlack, A. (2010) · Genome Biology · doi:10.1186/gb-2010-11-3-r25 · Cited by 7,876
Initial sequencing and comparative analysis of the mouse genome
Mouse Genome Sequencing Consortium (2002) · Nature · doi:10.1038/nature01262 · Cited by 7,187
Cited by
Sorted by citations
Activity-by-contact model of enhancer–promoter regulation from thousands of CRISPR perturbations
Fulco, C. P., Nasser, J., Jones, T. R., Munson, G., Bergman, D. T., Subramanian, V., Grossman, S. R., Anyoha, R., Doughty, B. R., Patwardhan, T. A., et al. (2019) · Nature Genetics · doi:10.1038/s41588-019-0538-0 · Cited by 1,111
Functional genomic landscape of cancer-intrinsic evasion of killing by T cells
Lawson, K. A., Sousa, C. M., Zhang, X., Kim, E., Akthar, R., Caumanns, J. J., Yao, Y., Mikolajewicz, N., Ross, C., Brown, K. R., et al. (2020) · Nature · doi:10.1038/s41586-020-2746-2 · Cited by 443
LRRC15(+) myofibroblasts dictate the stromal setpoint to suppress tumour immunity
Krishnamurty, A. T., Shyer, J. A., Thai, M., Gandham, V., Buechler, M. B., Yang, Y. A., Pradhan, R. N., Wang, A. W., Sanchez, P. L., Qu, Y., et al. (2022) · Nature · doi:10.1038/s41586-022-05272-1 · Cited by 436
Structural cells are key regulators of organ-specific immune responses
Krausgruber, T., Fortelny, N., Fife-Gernedl, V., Senekowitsch, M., Schuster, L. C., Lercher, A., Nemc, A., Schmidl, C., Rendeiro, A. F., Bergthaler, A., et al. (2020) · Nature · doi:10.1038/s41586-020-2424-4 · Cited by 434
Cai, Y., Zhou, H., Zhu, Y., Sun, Q., Ji, Y., Xue, A., Wang, Y., Chen, W., Yu, X., Wang, L., et al. (2020) · Cell Research · doi:10.1038/s41422-020-0314-9 · Cited by 397
Chromatin structure dynamics during the mitosis-to-G1 phase transition
Zhang, H., Emerson, D. J., Gilgenast, T. G., Titus, K. R., Lan, Y., Huang, P., Zhang, D., Wang, H., Keller, C. A., Giardine, B., et al. (2019) · Nature · doi:10.1038/s41586-019-1778-y · Cited by 271
Conservation, acquisition, and functional impact of sex-biased gene expression in mammals
Naqvi, S., Godfrey, A. K., Hughes, J. F., Goodheart, M. L., Mitchell, R. N., & Page, D. C. (2019) · Science · doi:10.1126/science.aaw7317 · Cited by 261
Targeted tissue delivery of RNA therapeutics using antibody–oligonucleotide conjugates (AOCs)
Malecová, B., Burke, R. S., Cochran, M., Hood, M. D., Johns, R. E., Kovach, P., Doppalapudi, V. R., Erdogan, G., Arias, J. D., Darimont, B. D., et al. (2023) · Nucleic Acids Research · doi:10.1093/nar/gkad415 · Cited by 164
Shortage of Cellular ATP as a Cause of Diseases and Strategies to Enhance ATP
Johnson, T. A., Jinnah, H. A., & Kamatani, N. (2019) · Frontiers in Pharmacology · doi:10.3389/fphar.2019.00098 · Cited by 151
A male germ-cell-specific ribosome controls male fertility
Li, H., Huo, Y., He, X., Yao, L., Zhang, H., Cui, Y., Xiao, H., Xie, W., Zhang, D., Wang, Y., et al. (2022) · Nature · doi:10.1038/s41586-022-05508-0 · Cited by 128
Regulation of CHD2 expression by the Chaserr long noncoding RNA gene is essential for viability
Rom, A., Melamed, L., Gil, N., Goldrich, M. J., Kadir, R., Golan, M., Biton, I. E., Perry, R. B., & Ulitsky, I. (2019) · Nature Communications · doi:10.1038/s41467-019-13075-8 · Cited by 125
Starks, R. R., Biswas, A., Jain, A., & Tuteja, G. (2019) · Epigenetics & Chromatin · doi:10.1186/s13072-019-0260-2 · Cited by 100
Cuadrado, A., Giménez-Llorente, D., Kojic, A., Rodríguez-Corsino, M., Cuartero, Y., Martín‐Serrano, G., Goméz-López, G., Martı́-Renom, M. A., & Losada, A. (2019) · Cell Reports · doi:10.1016/j.celrep.2019.05.078 · Cited by 105
Landscape of adenosine-to-inosine RNA recoding across human tissues
Gabay, O., Shoshan, Y., Kopel, E., Ben-Zvi, U., Mann, T. D., Bressler, N., Cohen‐Fultheim, R., Schaffer, A., Roth, S. H., Tzur, Z., et al. (2022) · Nature Communications · doi:10.1038/s41467-022-28841-4 · Cited by 99
PUMILIO hyperactivity drives premature aging of Norad-deficient mice
Kopp, F. B., YALVAÇ, M. E., Chen, B., Zhang, H., 이성율, Gillett, F. A., Elguindy, M. M., Sivakumar, S., Yu, H., Xie, Y., et al. (2019) · eLife · doi:10.7554/elife.42650 · Cited by 94
Integrative analyses of the RNA modification machinery reveal tissue- and cancer-specific signatures
Begik, O., Lucas, M. C., Liu, H., Ramírez, J. M., Mattick, J. S., & Novoa, E. M. (2020) · Genome biology · doi:10.1186/s13059-020-02009-z · Cited by 90
GNN-based embedding for clustering scRNA-seq data
Ciortan, M., & Defrance, M. (2021) · Bioinformatics · doi:10.1093/bioinformatics/btab787 · Cited by 88
The Ly6/uPAR protein Bouncer is necessary and sufficient for species-specific fertilization
Herberg, S., Gert, K. R., Schleiffer, A., & Pauli, A. (2018) · Science · doi:10.1126/science.aat7113 · Cited by 87
Epigenetic activation of a RAS/MYC axis in H3.3K27M-driven cancer
Pajovic, S., Siddaway, R., Bridge, T., Sheth, J., Rakopoulos, P., Kim, B., Ryall, S. T., Agnihotri, S., Phillips, L., Yu, M., et al. (2020) · Nature Communications · doi:10.1038/s41467-020-19972-7 · Cited by 70
Beato, M., & Sharma, P. (2020) · International Journal of Molecular Sciences · doi:10.3390/ijms21041351 · Cited by 61
Li, Y., Merkel, C. D., Zeng, X., Heier, J. A., Cantrell, P. S., Sun, M., Stolz, D. B., Watkins, S. C., Yates, N. A., & Kwiatkowski, A. V. (2019) · Journal of Cell Science · doi:10.1242/jcs.221606 · Cited by 58
Minakhina, S., Bansal, S., Zhang, A., Brotherton, M., Janodia, R., Oliveira, V. D., Tadepalli, S., & Wondisford, F. E. (2020) · Thyroid · doi:10.1089/thy.2019.0763 · Cited by 58
Monin, L., Ushakov, D. S., Arnesen, H., Bah, N. K., Jandke, A., Muñoz‐Ruiz, M., Carvalho, J., Joseph, S., Almeida, B., Green, M. J., et al. (2020) · Mucosal Immunology · doi:10.1038/s41385-020-0305-7 · Cited by 59
Zheng, M., Lü, J., & Zhao, D. (2017) · The Science of The Total Environment · doi:10.1016/j.scitotenv.2017.12.018 · Cited by 56
Fujihara, Y., Herberg, S., Blaha, A., Panser, K., Kobayashi, K., Larasati, T., Novatchkova, M., Theussl, H., Olszanska, O., Ikawa, M., et al. (2021) · Proceedings of the National Academy of Sciences · doi:10.1073/pnas.2108777118 · Cited by 56
Liu, J., Wen, T., Dong, K., He, X., Zhou, H., Shen, J., Fu, Z., Hu, G., Ma, W., Li, J., et al. (2021) · Cell Death and Differentiation · doi:10.1038/s41418-020-00732-5 · Cited by 54
A framework for developing sex-specific engineered heart models
Lock, R., Al Asafen, H., Fleischer, S., Tamargo, M., Zhao, Y., Radisic, M., & Vunjak-Novakovic, G. (2021) · Nature Reviews Materials · doi:10.1038/s41578-021-00381-1 · Cited by 50
The developmental origins of sex-biased expression in cardiac development
Deegan, D. F., Karbalaei, R., Madžo, J., Kulathinal, R. J., & Engel, N. (2019) · Biology of Sex Differences · doi:10.1186/s13293-019-0259-1 · Cited by 55
X-chromosome upregulation is driven by increased burst frequency
Larsson, A. J. M., Coucoravas, C., Sandberg, R., & Reinius, B. (2019) · Nature Structural & Molecular Biology · doi:10.1038/s41594-019-0306-y · Cited by 52
Enhancers Facilitate the Birth of De Novo Genes and Gene Integration into Regulatory Networks
Majic, P., & Payne, J. L. (2019) · Molecular Biology and Evolution · doi:10.1093/molbev/msz300 · Cited by 51
Nanovesicle-Mediated Delivery Systems for CRISPR/Cas Genome Editing
Kim, D., Le, Q., Wu, Y., Park, J.-W., & Oh, Y. (2020) · Pharmaceutics · doi:10.3390/pharmaceutics12121233 · Cited by 51
Lu, T., & Mar, J. C. (2020) · Biology of Sex Differences · doi:10.1186/s13293-020-00335-2 · Cited by 52
Dual histone methyl reader ZCWPW1 facilitates repair of meiotic double strand breaks in male mice
Mahgoub, M., Paiano, J., Bruno, M., Wu, W., Pathuri, S., Zhang, X., Ralls, S., Cheng, X., Nussenzweig, A., & Macfarlan, T. S. (2020) · eLife · doi:10.7554/elife.53360 · Cited by 53
Airn Regulates Igf2bp2 Translation in Cardiomyocytes
Hosen, M. R., Militello, G., Weirick, T., Ponomareva, Y., Dassanayaka, S., Moore, J. B., Döring, C., Wysoczynski, M., Jones, S. P., Dimmeler, S., et al. (2018) · Circulation Research · doi:10.1161/circresaha.117.312215 · Cited by 46
Gao, X., Oei, M. S., Ovitt, C. E., Sincan, M., & Melvin, J. E. (2018) · Physiological Genomics · doi:10.1152/physiolgenomics.00124.2017 · Cited by 45
Naro, C., Pellegrini, L., Jolly, A., Farini, D., Cesari, E., Bielli, P., de la Grange, P., & Sette, C. (2019) · Cell Reports · doi:10.1016/j.celrep.2019.02.058 · Cited by 47
Kopf, A., Fortuin, V., Somnath, V. R., & Claassen, M. (2021) · PLoS Computational Biology · doi:10.1371/journal.pcbi.1009086 · Cited by 50
Genome access is transcription factor-specific and defined by nucleosome position
Grand, R. S., Pregnolato, M., Baumgartner, L., Hoerner, L., Burger, L., & Schübeler, D. (2024) · Molecular Cell · doi:10.1016/j.molcel.2024.08.009 · Cited by 49
The landscape of RNA binding proteins in mammalian spermatogenesis
Li, Y., wang, Y., Tan, Y., Yue, Q., Guo, Y., Yan, R., Meng, L., Zhai, H., Tong, L., Yuan, Z., et al. (2024) · Science · doi:10.1126/science.adj8172 · Cited by 45
Goering, R., Engel, K. L., Gillen, A. E., Fong, N., Bentley, D. L., & Taliaferro, J. M. (2021) · BMC Genomics · doi:10.1186/s12864-021-07781-1 · Cited by 45
Higa, T., Okita, Y., Matsumoto, A., Nakayama, S., Oka, T., Sugahara, O., Koga, D., Takeishi, S., Nakatsumi, H., Hosen, N., et al. (2022) · Nature Communications · doi:10.1038/s41467-022-29165-z · Cited by 45
Histone H1 facilitates restoration of H3K27me3 during DNA replication by chromatin compaction
Liu, C., Yu, J., Song, A., Wang, M., Hu, J., Chen, P., Zhao, J., & Li, G. (2023) · Nature Communications · doi:10.1038/s41467-023-39846-y · Cited by 44
Islet Long Noncoding RNAs: A Playbook for Discovery and Characterization
Singer, R. A., & Sussel, L. (2018) · Diabetes · doi:10.2337/dbi18-0001 · Cited by 40
Revisiting the expression of BDNF and its receptors in mammalian development
Esvald, E., Tuvikene, J., Kiir, C. S., Avarlaid, A., Tamberg, L., Sirp, A., Shubina, A., Cabrera-Cabrera, F., Pihlak, A., Koppel, I., et al. (2023) · Frontiers in Molecular Neuroscience · doi:10.3389/fnmol.2023.1182499 · Cited by 43
Zahaf, A., Kassoussi, A., Hutteau-Hamel, T., Mellouk, A., Marie, C., Zoupi, L., Tsouki, F., Mattern, C., Bobé, P., Schumacher, M., et al. (2023) · Nature Communications · doi:10.1038/s41467-023-36846-w · Cited by 37
Zhang, X., Zhou, J., Li, L., Huang, W., Ahmad, H. I., Li, H., Jiang, H., & Chen, J. (2020) · Frontiers in Zoology · doi:10.1186/s12983-020-00355-z · Cited by 35
Transcriptional bursts explain autosomal random monoallelic expression and affect allelic imbalance
Larsson, A. J. M., Ziegenhain, C., Hagemann-Jensen, M., Reinius, B., Jacob, T., Dalessandri, T., Hendriks, G., Kasper, M., & Sandberg, R. (2021) · PLoS Computational Biology · doi:10.1371/journal.pcbi.1008772 · Cited by 37
Cardiac β3‐adrenoceptors—A role in human pathophysiology?
Arioglu‐Inan, E., Kayki‐Mutlu, G., & Michel, M. C. (2019) · British Journal of Pharmacology · doi:10.1111/bph.14635 · Cited by 32
Proteogenomics reveals sex-biased aging genes and coordinated splicing in cardiac aging
Han, Y., Wennersten, S. A., Wright, J. M., Ludwig, R. W., Lau, E., & Lam, M. P. Y. (2022) · American Journal of Physiology-Heart and Circulatory Physiology · doi:10.1152/ajpheart.00244.2022 · Cited by 31
Capturing the primordial Kras mutation initiating urethane carcinogenesis
Li, S., MacAlpine, D. M., & Counter, C. M. (2020) · Nature Communications · doi:10.1038/s41467-020-15660-8 · Cited by 28
Ma, Q., Tao, H., Li, Q., Zhai, Z., Zhang, X., Lin, Z., Kuang, N., & Pan, J. (2022) · Nucleic Acids Research · doi:10.1093/nar/gkac942 · Cited by 27
González-Prendes, R., Mármol‐Sánchez, E., Quintanilla, R., Castelló, A., Zidi, A., Ramayo‐Caldas, Y., Cardoso, T. F., Manunza, A., Cánovas, Á., & Amills, M. (2019) · BMC Genomics · doi:10.1186/s12864-019-5889-5 · Cited by 25
Grecco, G. G., Haggerty, D. L., Doud, E. H., Fritz, B. M., Yin, F., Hoffman, H., Mosley, A. L., Simpson, E. R., Liu, Y., Baucum, A. J., et al. (2020) · Journal of Neurochemistry · doi:10.1111/jnc.15226 · Cited by 25
Sex-chromosome mechanisms in cardiac development and disease
Conlon, F. L., & Arnold, A. P. (2023) · Nature Cardiovascular Research · doi:10.1038/s44161-023-00256-4 · Cited by 27
Germ cell-specific eIF4E1b regulates maternal mRNA translation to ensure zygotic genome activation
Yang, G., Xin, Q., Feng, I., Wu, D., & Dean, J. (2023) · Genes & Development · doi:10.1101/gad.350400.123 · Cited by 25
Etxaniz, U., Marks, I. M., Albin, T. J., Diaz, M., Bhardwaj, R., Anderson, A., Tyaglo, O., Hoang, T., Missinato, M. A., Svensson, K., et al. (2025) · Nucleic Acids Research · doi:10.1093/nar/gkaf241 · Cited by 24
Tissue-Characteristic Expression of Mouse Proteome
Lu, T., Qian, L., Xie, Y., Zhang, Q., Liu, W., Ge, W., Zhu, Y., Ma, L., Zhang, C., & Guo, T. (2022) · Molecular & Cellular Proteomics · doi:10.1016/j.mcpro.2022.100408 · Cited by 24
Lusk, R., Stene, E., Banaei‐Kashani, F., Tabakoff, B., Kechris, K. J., & Saba, L. M. (2021) · Nature Communications · doi:10.1038/s41467-021-21894-x · Cited by 23
Puttabyatappa, M., Saadat, N., Elangovan, V. R., Dou, J., Bakulski, K. M., & Padmanabhan, V. (2022) · Toxicology and Applied Pharmacology · doi:10.1016/j.taap.2022.116161 · Cited by 21
Identification of MRAP protein family as broad‐spectrum GPCR modulators
Wang, M., Wang, X., Jiang, B., Zhai, Y., Zheng, J., Liu, Y., Tai, X., Li, Y., Fu, S., Xu, J., et al. (2022) · Clinical and Translational Medicine · doi:10.1002/ctm2.1091 · Cited by 19
Sirp, A., Shubina, A., Tuvikene, J., Tamberg, L., Kiir, C. S., Kranich, L., & Timmusk, T. (2022) · Frontiers in Molecular Neuroscience · doi:10.3389/fnmol.2022.1033224 · Cited by 19
Preclinical species gene expression database: Development and meta-analysis
Krause, C., Suwada, K., Blomme, E. A. G., Kowalkowski, K. L., Liguori, M. J., Mahalingaiah, P. K. S., Mittelstadt, S. W., Peterson, R., Rendino, L., Vo, A. H., et al. (2023) · Frontiers in Genetics · doi:10.3389/fgene.2022.1078050 · Cited by 20
Schneor, L., Kaltenbach, S., Friedman, S., Tussia-Cohen, D., Nissan, Y., Shuler, G., Fraimovitch, E., Kolodziejczyk, A. A., Weinberg, M., Donati, G., et al. (2023) · iScience · doi:10.1016/j.isci.2023.107435 · Cited by 20
Single-cell analysis reveals X upregulation is not global in pre-gastrulation embryos
Naik, H. C., Hari, K., Chandel, D., Jolly, M. K., & Gayen, S. (2022) · iScience · doi:10.1016/j.isci.2022.104465 · Cited by 19
Soma‐to‐germline transformation in chromatin‐linked neurodevelopmental disorders?
Bonefas, K. M., & Iwase, S. (2021) · FEBS Journal · doi:10.1111/febs.16196 · Cited by 18
Genomic expansion of Aldh1a1 protects beavers against high metabolic aldehydes from lipid oxidation
Zhang, Q., Tombline, G., Ablaeva, J., Zhang, L., Zhou, X., Smith, Z., Zhao, Y., Xiaoli, A. M., Wang, Z., Lin, J.-R., et al. (2021) · Cell Reports · doi:10.1016/j.celrep.2021.109965 · Cited by 18
Multiple Lesions Contribute to Infertility in Males Lacking Autoimmune Regulator
Warren, B. D., Ahn, S. H., Brittain, K., Nanjappa, M. K., Wang, H., Wang, J., Blanco, G. V., Sánchez, G., Fan, Y., Petroff, B. K., et al. (2021) · American Journal Of Pathology · doi:10.1016/j.ajpath.2021.05.021 · Cited by 17
TMPRSS12 Functions in Meiosis and Spermiogenesis and Is Required for Male Fertility in Mice
Zhang, J., Zhou, X., Wan, D., Li, Y., Xu, C., Tong, Y., Wu, Z., Zheng, M., Zhu, F., & Zhu, H. (2022) · Frontiers in Cell and Developmental Biology · doi:10.3389/fcell.2022.757042 · Cited by 17
Promoter evolution of mammalian gene duplicates
Fraimovitch, E., & Hagai, T. (2023) · BMC Biology · doi:10.1186/s12915-023-01590-6 · Cited by 17
Regulation of neuronal commitment in mouse embryonic stem cells by the Reno1/Bahcc1 locus
Hezroni, H., Perry, R. B., Gil, N., Degani, N., & Ulitsky, I. (2020) · EMBO Reports · doi:10.15252/embr.202051264 · Cited by 16
Zhao, H., Cheng, Y., Li, J., Zhou, J., Yang, H., Feng, Y., Yu, F., Khutsishvili, D., Wang, Z., Jiang, S., et al. (2022) · Fundamental Research · doi:10.1016/j.fmre.2022.05.018 · Cited by 15
Functional overlap between the mammalian Sar1a and Sar1b paralogs in vivo
Tang, V. T., Xiang, J., Chen, Z., McCormick, J., Abbineni, P. S., Chen, X., Hoenerhoff, M. J., Emmer, B. T., Khoriaty, R. N., Lin, J. D., et al. (2024) · Proceedings of the National Academy of Sciences · doi:10.1073/pnas.2322164121 · Cited by 17
Functional reciprocity of proteins involved in mitosis and endocytosis
Yu, H., Li, Y., Li, L., Huang, J., Wang, X., Tang, R., Jiang, Z., Lv, L., Chen, F., Yu, C., et al. (2020) · FEBS Journal · doi:10.1111/febs.15664 · Cited by 16
Sequence features of retrotransposons allow for epigenetic variability
Costello, K. R., Leung, A., Trac, C., Lee, M., Basam, M., Pospisilik, J. A., & Schones, D. E. (2021) · eLife · doi:10.7554/elife.71104 · Cited by 16
Pinto, B. J., O’Connor, B. D., Schatz, M. C., Zarate, S., & Wilson, M. A. (2023) · G3 Genes Genomes Genetics · doi:10.1093/g3journal/jkad169 · Cited by 17
Kopania, E. E. K., Thomas, G. W. C., Hutter, C. R., Mortimer, S. M. E., Callahan, C. M., Roycroft, E., Achmadi, A. S., Breed, W. G., Clark, N. L., Esselstyn, J. A., et al. (2024) · Evolution · doi:10.1093/evolut/qpae146 · Cited by 14
Tissue-specific mouse mRNA isoform networks
Kandoi, G., & Dickerson, J. A. (2019) · Scientific Reports · doi:10.1038/s41598-019-50119-x · Cited by 14
MeCP2 regulates Gdf11, a dosage-sensitive gene critical for neurological function
Bajikar, S. S., Anderson, A. G., Zhou, J., Durham, M. A., Trostle, A. J., Wan, Y., Liu, Z., & Zoghbi, H. Y. (2023) · eLife · doi:10.7554/elife.83806 · Cited by 14
Captivity induces a sweeping and sustained genomic response in a starfish
Morin, M., Jönsson, M., Wang, C. K. L., Craik, D. J., Degnan, B. M., & Degnan, B. M. (2023) · Molecular Ecology · doi:10.1111/mec.16947 · Cited by 14
Structure-guided design of a peripherally restricted chemogenetic system
Kang, H. J., Krumm, B. E., Tassou, A., Geron, M., DiBerto, J. F., Kapolka, N. J., Gumpper, R. H., Sakamoto, K., Koçak, D. D., Olsen, R. H. J., et al. (2024) · Cell · doi:10.1016/j.cell.2024.11.001 · Cited by 14
Nguinkal, J. A., Verleih, M., Ríos‐Pérez, L. D. L., Brunner, R. M., Sahm, A., Bej, S., Rebl, A., & Goldammer, T. (2021) · Cells · doi:10.3390/cells10092289 · Cited by 13
Chen, M., Yao, Y. L., Yang, Y., Zhu, M., Tang, Y., Liu, S., Li, K., & Tang, Z. (2019) · Frontiers in Genetics · doi:10.3389/fgene.2019.00756 · Cited by 13
Dnajb8, a target gene of SOX30, is dispensable for male fertility in mice
Wang, F., Kong, S., Hu, X., Li, X., Xu, B., Yue, Q., Fu, K., Ye, L., & Bai, S. (2020) · PeerJ · doi:10.7717/peerj.10582 · Cited by 13
Predicting gene expression state and prioritizing putative enhancers using 5hmC signal
González‐Avalos, E., Onodera, A., Samaniego‐Castruita, D., Rao, A., & Ay, F. (2024) · Genome biology · doi:10.1186/s13059-024-03273-z · Cited by 13
Samanta, S., Bagchi, D., & Bagchi, M. (2024) · Journal of Physiology and Biochemistry · doi:10.1007/s13105-024-01040-z · Cited by 18
Saadat, N., Puttabyatappa, M., Elangovan, V. R., Dou, J., Ciarelli, J. N., Thompson, R. C., Bakulski, K. M., & Padmanabhan, V. (2021) · Endocrinology · doi:10.1210/endocr/bqab225 · Cited by 12
Emergence of distinct syntenic density regimes is associated with early metazoan genomic transitions
Robert, N. S. M., Sarigol, F., Zimmermann, B., Meyer, A., Voolstra, C. R., & Simakov, O. (2022) · BMC Genomics · doi:10.1186/s12864-022-08304-2 · Cited by 12
Kaneda, Y., Miyata, H., Shimada, K., Oyama, Y., Iida‐Norita, R., & Ikawa, M. (2022) · Developmental Biology · doi:10.1016/j.ydbio.2022.05.011 · Cited by 12
Upregulation of β3-adrenoceptors—a general marker of and protective mechanism against hypoxia?
Monte, M. D., Evans, B. A., Arioglu‐Inan, E., & Michel, M. C. (2019) · Naunyn-Schmiedeberg s Archives of Pharmacology · doi:10.1007/s00210-019-01780-6 · Cited by 12
Pagenkopf, A. C., & Liang, Y. (2020) · FEBS Letters · doi:10.1002/1873-3468.13911 · Cited by 12
Multidimensional conservation analysis decodes the expression of conserved long noncoding RNAs
Zhou, Q., Jiang, Y., Cai, C., Li, W., Leow, M. K., Yang, Y., Liu, J., Xu, D., & Sun, L. (2023) · Life Science Alliance · doi:10.26508/lsa.202302002 · Cited by 10
A whole-tissue RNA-seq toolkit for organism-wide studies of gene expression with PME-seq
Pandey, S., Takahama, M., Gruenbaum, A., Zewde, M. G., Cheronis, K., & Chevrier, N. (2020) · Nature Protocols · doi:10.1038/s41596-019-0291-y · Cited by 11
Fu, Y., Yang, J. Y., Fan, S., Zhao, S., Shah, S. M. A., Akram, M., Rong, R., & Yang, Y. (2020) · BioMed Research International · doi:10.1155/2020/9075165 · Cited by 10
Transcriptome Profiling across Five Tissues of Giant Panda
Li, F., Wang, C., Xu, Z., Li, M., Deng, L., Wei, M., Zhang, H., Wu, K., Ning, R., Li, D., et al. (2020) · BioMed Research International · doi:10.1155/2020/3852586 · Cited by 11
Aire‐dependent transcripts escape Raver2‐induced splice‐event inclusion in the thymic epithelium
Padonou, F., Gonzalez, V., Provin, N., Yayilkan, S., Jmari, N., Maslovskaja, J., Kisand, K. E., Peterson, P., Irla, M., & Giraud, M. (2022) · EMBO Reports · doi:10.15252/embr.202153576 · Cited by 10
Dong, K., & Zhang, S. (2020) · Briefings in Bioinformatics · doi:10.1093/bib/bbaa120 · Cited by 11
Chen, Y., & Agellon, L. B. (2020) · Genes · doi:10.3390/genes11080943 · Cited by 10
Characterization of the hepatic transcriptome following phenobarbital induction in mice with AIP
Chen, B., Wang, M., Gan, L., Zhang, B., Desnick, R. J., & Yasuda, M. (2019) · Molecular Genetics and Metabolism · doi:10.1016/j.ymgme.2018.12.010 · Cited by 9
Metadata
- Authors
- Li, B., Qing, T., Zhu, J., Wen, Z., Yu, Y., Fukumura, R., Zheng, Y., Gondo, Y., & Shi, L.
- Affiliations
- Fudan University (CN)
- Sichuan University (CN)
- RIKEN BioResource Research Center (JP)
- Corresponding author
- Zheng, Yuanting
- Gondo, Yoichi
- Shi, Leming
- Venue
- Scientific Reports
- Published
- 2017-06-23
- Volume
- 7
- Issue
- 1
- Pages
- 4200-4200
- ISSN
- 2045-2322 (ISSN-L)
- PMC
- PMC5482823
- OpenAlex
- W2644618666
- Cited by
- 184
- References
- 49
- Citations by year
- 2026: 13 · 2025: 18 · 2024: 18 · 2023: 25 · 2022: 22 · 2021: 22 · 2020: 37 · 2019: 22 · 2018: 6 · 2017: 1
- FWCI
- 7.38
- Type
- journal article
- Language
- en
- Open access
- gold
- doi.org
- Locations
- Scientific Reports (publishedVersion, cc-by)
- Europe PMC (PubMed Central) (publishedVersion, cc-by)
- PubMed Central (publishedVersion, cc-by)
- PubMed (publishedVersion)
- DOAJ (DOAJ: Directory of Open Access Journals) (submittedVersion, cc-by-sa)
- Funders
- National Natural Science Foundation of China (111 Project, B13016, 31671368, 31471239, 31601085, 31471239, 31671368)
- Higher Education Discipline Innovation Project (B13016)
- Japan Society for the Promotion of Science (16H06279, 17H00789, 25241016)
- National Key Research and Development Program of China (2016YFC0901704)
- National Supercomputing Center, Korea Institute of Science and Technology Information
- Topics
- Life Sciences › Biochemistry, Genetics and Molecular Biology › Molecular Biology › Gene expression and cancer classification
- Life Sciences › Biochemistry, Genetics and Molecular Biology › Molecular Biology › Genomics and Phylogenetic Studies
- Life Sciences › Biochemistry, Genetics and Molecular Biology › Molecular Biology › Single-cell and spatial transcriptomics
- Keywords
- mouse transcriptome, tissue-specific gene expression, C57BL/6J mice, tissue-specific genes, housekeeping genes, non-coding RNA, liver transcriptome, tissue expression profiling
- MeSH terms
- Animals, Female, Male, Mice, Inbred C57BL, Organ Specificity, Sequence Analysis, RNA, Genes, Essential, Gene Expression Profiling, Transcriptome
About these checks
Registry, retraction, Cites and statistics results are computed, not judged, with one exception: a printed reference that no index lists is read once by a model before it counts as a citation error. Claims are extracted by a model and kept only when their quote appears verbatim in the text; each cited source is then checked, with a model’s help, for whether it says what the claim relies on. Those verdicts can be wrong — read the claim’s quote and the cited source before relying on one.
Statistics and arithmetic are recomputed, not judged.
Confidence bands are shown only for fields calibrated on our annotated test set. None is calibrated yet, so no band is shown.
What counts as a claim ›How we measure confidence ›How we check this ›
Are you an author, or do you see a problem with this page? Request a review
