

The DOI matches its Crossref record; 83 of the 83 references it cites were found in a registry or an index.
Gut microbiome alterations in Alzheimer’s disease
Open accessAbstract
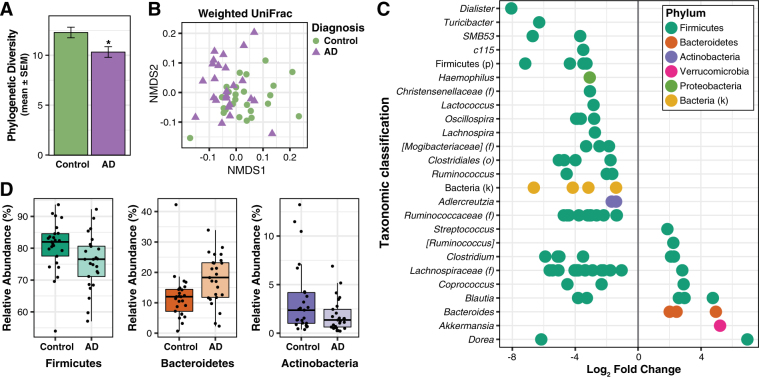
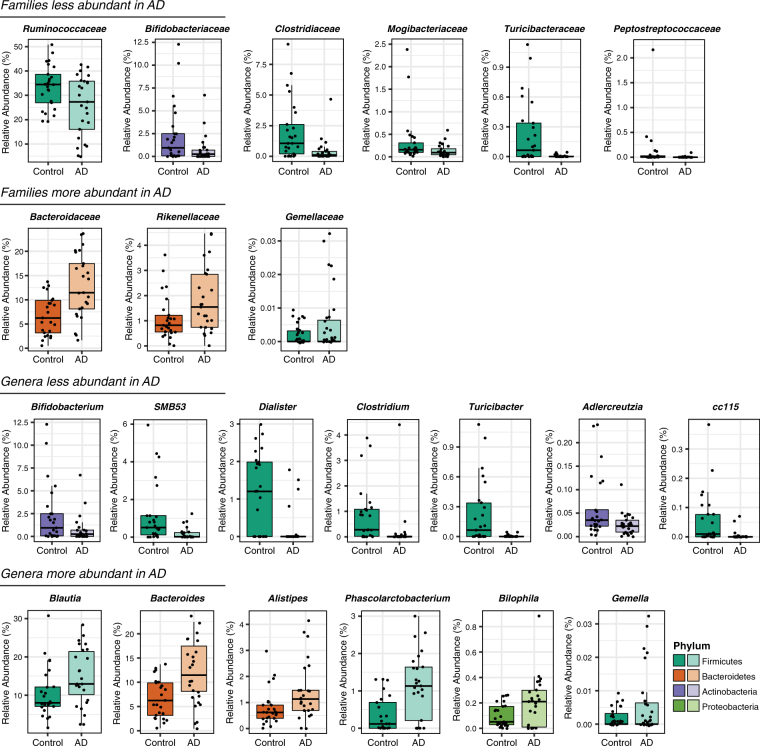
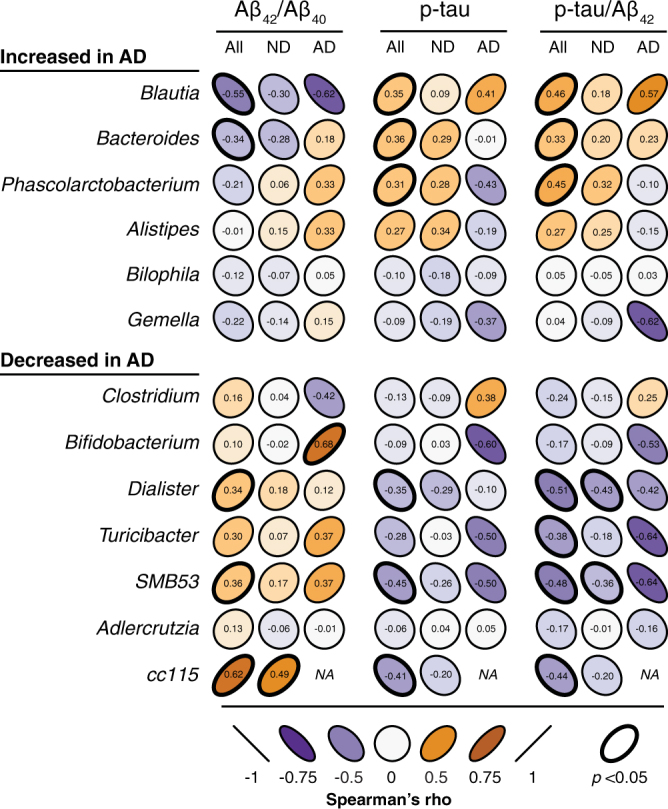
Alzheimer’s disease (AD) is the most common form of dementia. However, the etiopathogenesis of this devastating disease is not fully understood. Recent studies in rodents suggest that alterations in the gut microbiome may contribute to amyloid deposition, yet the microbial communities associated with AD have not been characterized in humans. Towards this end, we characterized the bacterial taxonomic composition of fecal samples from participants with and without a diagnosis of dementia due to AD. Our analyses revealed that the gut microbiome of AD participants has decreased microbial diversity and is compositionally distinct from control age- and sex-matched individuals. We identified phylum- through genus-wide differences in bacterial abundance including decreased Firmicutes, increased Bacteroidetes, and decreased Bifidobacterium in the microbiome of AD participants. Furthermore, we observed correlations between levels of differentially abundant genera and cerebrospinal fluid (CSF) biomarkers of AD. These findings add AD to the growing list of diseases associated with gut microbial alterations, as well as suggest that gut bacterial communities may be a target for therapeutic intervention.
Overview
The claims and statistics of this paper haven’t been checked yet.
Run the check — free, no account needed. It reads the open-access text and checks the sources it cites.
Integrity signals
Registry
Cites
Statistics
Figures
Verification
Claims the paper makes
The claims and statistics of this paper haven’t been checked yet.
Run the check — free, no account needed. It reads the open-access text and checks the sources it cites.
Claims other papers make about this one
Each is checked against this paper’s own text: does it say what the citing paper says it does?
The source backs part of the claim, not all of it — or backs it for a different population, condition or comparison.
In the citing paper
“A variety of genetic and environmental factors have been implicated in AD etiopathogenesis, including contributions from gut microbiota [13–15].”
From The gut microbiota-derived metabolite trimethylamine N-oxide is elevated in Alzheimer’s disease (2018) · cites this paper as [15]
Experimental — accuracy not yet measuredThe source backs part of the claim, not all of it — or backs it for a different population, condition or comparison.
In the citing paper
“Diseases of cognitive decline, such as Alzheimer's disease and vascular dementia, are associated with aberrant microbial compositions when compared with healthy controls (297).”
From Diet and the Microbiota–Gut–Brain Axis: Sowing the Seeds of Good Mental Health (2021) · cites this paper as [297]
Experimental — accuracy not yet measuredThe source backs part of the claim, not all of it — or backs it for a different population, condition or comparison.
In the citing paper
“These include reductions in beneficial genera such as Lactobacillus and Bifidobacterium, alongside increases in pro-inflammatory taxa like Enterobacteriaceae64.”
From Artificial intelligence-driven multi-omics approaches in Alzheimer's disease: Progress, challenges, and future directions (2025) · cites this paper as [64]
Experimental — accuracy not yet measuredThe source backs part of the claim, not all of it — or backs it for a different population, condition or comparison.
In the citing paper
“Studies using 16S rRNA gene sequencing and shotgun metagenomic sequencing have consistently identified significant changes in the gut microbiota composition of individuals with AD.”
From Artificial intelligence-driven multi-omics approaches in Alzheimer's disease: Progress, challenges, and future directions (2025) · cites this paper as [64]
Experimental — accuracy not yet measuredIn the citing paper
“Human studies show associations between gut microbiota and neurodegenerative diseases148.”
From Microglia in neurodegeneration (2018) · cites this paper as [148]
In the citing paper
“Human studies comparing the composition of the GM of elderly participants suffering from cognitive impairment with healthy individuals indicate significant changes in GM composition. Specifically, there is an increase in pro-inflammatory taxa and a reduction in anti-inflammatory taxa (104–109).”
From Signalling cognition: The gut microbiota and hypothalamic-pituitary-adrenal axis (2023) · cites this paper as [105]
In the citing paper
“Within the Firmicutes, the families Ruminococcaceae, Turicibacteraceae, and Clostridiaceae were all less abundant in AD patient (160).”
From The gut-brain axis: how microbiota and host inflammasome influence brain physiology and pathology (2020) · cites this paper as [160]
Self-check
Percentages, sums and reported differences re-computed from the paper’s own numbers.
The self-check needs the paper’s full text.
Citations
Cites
Moderated estimation of fold change and dispersion for RNA-seq data with DESeq2
Love, M. I., Huber, W., & Anders, S. (2014) · Genome Biology · doi:10.1186/s13059-014-0550-8 · Cited by 95,106
Schloss, P. D., Westcott, S. L., Ryabin, T., Hall, J. R., Hartmann, M., Hollister, E. B., Lesniewski, R. A., Oakley, B. B., Parks, D. H., Robinson, C. J., et al. (2009) · Applied and Environmental Microbiology · doi:10.1128/aem.01541-09 · Cited by 19,549
McKhann, G. M., Knopman, D. S., Chertkow, H., Hyman, B. T., Jack, C. R., Kawas, C. H., Klunk, W. E., Koroshetz, W. J., Manly, J. J., Mayeux, R., et al. (2011) · Alzheimer's & Dementia · doi:10.1016/j.jalz.2011.03.005 · Cited by 18,657
Metagenomic biomarker discovery and explanation
Segata, N., Izard, J., Waldron, L., Gevers, D., Miropolsky, L., Garrett, W. S., & Huttenhower, C. (2011) · Genome Biology · doi:10.1186/gb-2011-12-6-r60 · Cited by 16,192
Structure, function and diversity of the healthy human microbiome
The Human Microbiome Project Consortium (2012) · Nature · doi:10.1038/nature11234 · Cited by 11,726
Predictive functional profiling of microbial communities using 16S rRNA marker gene sequences
Langille, M. G. I., Zaneveld, J., Caporaso, J. G., McDonald, D., Knights, D., Reyes, J. A., Clemente, J. C., Burkepile, D. E., Vega Thurber, R. L., Knight, R., et al. (2013) · Nature Biotechnology · doi:10.1038/nbt.2676 · Cited by 9,116
A core gut microbiome in obese and lean twins
Turnbaugh, P. J., Hamady, M., Yatsunenko, T., Cantarel, B. L., Duncan, A., Ley, R. E., Sogin, M. L., Jones, W. J., Roe, B. A., Affourtit, J. P., et al. (2009) · Nature · doi:10.1038/nature07540 · Cited by 7,823
Kozich, J. J., Westcott, S. L., Baxter, N. T., Highlander, S. K., & Schloss, P. D. (2013) · Applied and Environmental Microbiology · doi:10.1128/aem.01043-13 · Cited by 7,246
Metabolic Endotoxemia Initiates Obesity and Insulin Resistance
Cani, P. D., Amar, J., Iglesias, M. A., Poggi, M., Knauf, C., Bastelica, D., Neyrinck, A. M., Fava, F., Tuohy, K. M., Chabo, C., et al. (2007) · Diabetes · doi:10.2337/db06-1491 · Cited by 6,638
Obesity alters gut microbial ecology
Ley, R. E., Bäckhed, F., Turnbaugh, P., Lozupone, C. A., Knight, R. D., & Gordon, J. I. (2005) · Proceedings of the National Academy of Sciences · doi:10.1073/pnas.0504978102 · Cited by 6,176
Cited by
Sorted by citations
Items 201–300 of 1,007
Gut microbiota–driven brain Aβ amyloidosis in mice requires microglia
Dodiya, H. B., Lutz, H. L., Weigle, I. Q., Patel, P., Michalkiewicz, J., Roman-Santiago, C. J., Zhang, C. M., Liang, Y., Srinath, A., Zhang, X., et al. (2022) · Journal of Experimental Medicine · doi:10.1084/jem.20200895 · Cited by 120
Gut microbiome-mediated regulation of neuroinflammation
Bostick, J. W., Schonhoff, A. M., & Mazmanian, S. K. (2022) · Current Opinion in Immunology · doi:10.1016/j.coi.2022.102177 · Cited by 120
Implications of Diet and The Gut Microbiome in Neuroinflammatory and Neurodegenerative Diseases
Hirschberg, S., Gisevius, B., Duscha, A., & Haghikia, A. (2019) · International Journal of Molecular Sciences · doi:10.3390/ijms20123109 · Cited by 120
Hagerty, S. L., Hutchison, K. E., Lowry, C. A., & Bryan, A. D. (2020) · PLoS ONE · doi:10.1371/journal.pone.0229204 · Cited by 118
Multi-pathogen infections and Alzheimer’s disease
Vigašová, D., Nemergut, M., Lišková, B., & Damborský, J. (2021) · Microbial Cell Factories · doi:10.1186/s12934-021-01520-7 · Cited by 117
Safety of pasteurised Akkermansia muciniphila as a novel food pursuant to Regulation (EU) 2015/2283
EFSA Panel on Nutrition, N. F. A. F. A. (., Turck, D., Bohn, T., Castenmiller, J. J. M., Henauw, S. D., Hirsch‐Ernst, K. I., Maciuk, A., Mangelsdorf, I., McArdle, H. J., Naska, A., et al. (2021) · EFSA Journal · doi:10.2903/j.efsa.2021.6780 · Cited by 117
The Role of Microbiome in Brain Development and Neurodegenerative Diseases
Nandwana, V., Nandwana, N. K., Das, Y., Saito, M., Panda, T., Das, S., Almaguel, F. A., Hosmane, N. S., & Das, B. C. (2022) · Molecules · doi:10.3390/molecules27113402 · Cited by 117
Microbial involvement in Alzheimer disease development and progression
Bulgart, H. R., Neczypor, E. W., Wold, L. E., & Mackos, A. R. (2020) · Molecular Neurodegeneration · doi:10.1186/s13024-020-00378-4 · Cited by 116
Vinuesa, Á., Pomilio, C. J., Gregosa, A., Bentivegna, M., Presa, J., Bellotto, M., Saravia, F., & Beauquis, J. (2021) · Frontiers in Neuroscience · doi:10.3389/fnins.2021.653651 · Cited by 117
Jang, J., Kim, S. R., Lee, J. E., Lee, S.-Y., Son, H. J., Choe, W., Yoon, K., Kim, S. S., Yeo, E., & Kang, I. (2023) · International Journal of Molecular Sciences · doi:10.3390/ijms25010124 · Cited by 116
Probiotics ameliorate intestinal pathophysiology in a mouse model of Alzheimer’s disease
Kaur, H., Nagamoto‐Combs, K., Golovko, S. A., Golovko, M. Y., Klug, M. G., & Combs, C. K. (2020) · Neurobiology of Aging · doi:10.1016/j.neurobiolaging.2020.04.009 · Cited by 115
Yu, J., Ning, J., Huang, S.-Y., Chen, S.-D., Huang, Y., & Dong, Q. (2022) · Journal of Alzheimer s Disease · doi:10.3233/jad-215411 · Cited by 115
Ma, X., Asif, H., Dai, L., He, Y., Zheng, W., Wang, D., Ren, H., Tang, J., Li, C., Jin, K., et al. (2020) · Journal of Psychiatric Research · doi:10.1016/j.jpsychires.2020.02.005 · Cited by 114
Bile acids as key modulators of the brain-Gut-Microbiota axis in alzheimer’s disease
Mulak, A. (2021) · Journal of Alzheimer s Disease · doi:10.3233/jad-210608 · Cited by 114
Parodi, B., & de Rosbo, N. K. (2021) · Frontiers in Immunology · doi:10.3389/fimmu.2021.718220 · Cited by 114
Borrego-Ruiz, A., & Borrego, J. J. (2023) · Progress in Neuro-Psychopharmacology and Biological Psychiatry · doi:10.1016/j.pnpbp.2023.110861 · Cited by 111
Heravi, F. S., Naseri, K., & Hu, H. (2023) · Nutrients · doi:10.3390/nu15204365 · Cited by 113
Gut Microbiota Interaction with the Central Nervous System throughout Life
Ojeda, J., Ávila, A., & Vidal, P. M. (2021) · Journal of Clinical Medicine · doi:10.3390/jcm10061299 · Cited by 112
Perov, S., Lidor, O., Salinas, N., Golan, N., Tayeb-Fligelman, E., Deshmukh, M. G., Willbold, D., & Landau, M. (2019) · PLoS Pathogens · doi:10.1371/journal.ppat.1007978 · Cited by 111
The roles of the gut microbiota–miRNA interaction in the host pathophysiology
Li, M., Chen, W., & Wang, Y. (2020) · Molecular Medicine · doi:10.1186/s10020-020-00234-7 · Cited by 111
Dysbiosis and Alzheimer’s Disease: A Role for Chronic Stress?
Sharma, V., Singh, T. G., Garg, N., Dhiman, S., Gupta, S., Rahman, M. H., Najda, A., Walasek-Janusz, M., Kamel, M. S., Albadrani, G. M., et al. (2021) · Biomolecules · doi:10.3390/biom11050678 · Cited by 111
Medina-Rodriguez, E. M., Madorma, D., O’Connor, G., Mason, B. L., Han, D., Deo, S. K., Oppenheimer, M., Nemeroff, C. B., Trivedi, M. H., Daunert, S., et al. (2020) · American Journal of Psychiatry · doi:10.1176/appi.ajp.2020.19090960 · Cited by 110
Analysis of Salivary Microbiome in Patients with Alzheimer’s Disease
Liu, X., Jiao, B., Liao, X., Guo, L., Yuan, Z., Wang, X., Xiao, X., Zhang, X., Tang, B., & Shen, L. H. (2019) · Journal of Alzheimer s Disease · doi:10.3233/jad-190587 · Cited by 110
Kong, G., Ellul, S., Narayana, V. K., Kanojia, K., Tran, H., Li, S., Renoir, T., Cao, K. L., & Hannan, A. J. (2020) · Neurobiology of Disease · doi:10.1016/j.nbd.2020.105199 · Cited by 111
Multiple roles of short-chain fatty acids in Alzheimer disease
Chen, H., Meng, L., & Shen, L. (2021) · Nutrition · doi:10.1016/j.nut.2021.111499 · Cited by 108
Ağagündüz, D., Bozkurt, B. K., Bozkurt, O., Sharma, H., Esposito, R., Özoğul, F., & Capasso, R. (2022) · Biomedicine & Pharmacotherapy · doi:10.1016/j.biopha.2022.113430 · Cited by 110
The gut microbiota–brain axis in neurological disorders
You, M., Chen, N., Yang, Y., Cheng, L., He, H., Cai, Y., Liu, Y., Liu, H., & Hong, G. (2024) · MedComm · doi:10.1002/mco2.656 · Cited by 113
Xia, Y., Xiao, Y., Wang, Z.-H., Liu, X., Alam, A. M., Haran, J. P., McCormick, B. A., Shu, X., Wang, X., & Ye, K. (2023) · Nature Communications · doi:10.1038/s41467-023-41283-w · Cited by 108
Seo, D.-O., & Holtzman, D. M. (2019) · The Journals of Gerontology Series A · doi:10.1093/gerona/glz262 · Cited by 109
Pan, R.-Y., Zhang, J., Wang, J., Wang, Y., Li, Z., Liao, Y., Liao, Y., Zhang, C., Liu, Z., Song, L., et al. (2022) · Nature Aging · doi:10.1038/s43587-022-00311-y · Cited by 107
Understanding the host-microbe interactions using metabolic modeling
Jansma, J., & Aidy, S. E. (2021) · Microbiome · doi:10.1186/s40168-020-00955-1 · Cited by 106
Xi, J., Ding, D., Zhu, H., Wang, R., Su, F., Wu, W., Xiao, Z., Liang, X., Zhao, Q., Hong, Z., et al. (2021) · BMC Microbiology · doi:10.1186/s12866-021-02286-z · Cited by 106
Conn, K. A., Borsom, E. M., & Cope, E. K. (2024) · Gut Microbes · doi:10.1080/19490976.2024.2371950 · Cited by 106
The Intestinal Barrier Dysfunction as Driving Factor of Inflammaging
Untersmayr, E., Brandt, A., Koidl, L., & Bergheim, I. (2022) · Nutrients · doi:10.3390/nu14050949 · Cited by 104
Yang, J., Liang, J., Hu, N., He, N., Liu, B., Liu, G., & Qin, Y. (2024) · CNS Neuroscience & Therapeutics · doi:10.1111/cns.70091 · Cited by 109
Gut microbiota development across the lifespan: Disease links and health‐promoting interventions
Schoultz, I., Claesson, M. J., Domínguez-Bello, M. G., Hållenius, F. F., Konturek, P. C., Korpela, K., Laursen, M. F., Penders, J., Roager, H. M., Vatanen, T., et al. (2025) · Journal of Internal Medicine · doi:10.1111/joim.20089 · Cited by 108
Li, H., Liu, C.-C., Zheng, H., & Huang, T. Y. (2018) · Translational Neurodegeneration · doi:10.1186/s40035-018-0139-3 · Cited by 103
Alterations in the Gut-Microbial-Inflammasome-Brain Axis in a Mouse Model of Alzheimer’s Disease
Shukla, P. K., Delotterie, D. F., Xiao, J., Pierre, J. F., Rao, R., McDonald, M. P., & Khan, M. M. (2021) · Cells · doi:10.3390/cells10040779 · Cited by 105
Hormetic Nutrition and Redox Regulation in Gut–Brain Axis Disorders
Scuto, M. C., Rampulla, F., Reali, G. M., Spanò, S. M., Salinaro, A. T., & Calabrese, V. (2024) · Antioxidants · doi:10.3390/antiox13040484 · Cited by 103
Intestinal pH: a major driver of human gut microbiota composition and metabolism
Brinck, J. E., Sinha, A. K., Laursen, M. F., Dragsted, L. O., Raes, J., Vazquez-Uribe, R., Walter, J., Roager, H. M., & Licht, T. R. (2025) · Nature Reviews Gastroenterology & Hepatology · doi:10.1038/s41575-025-01092-6 · Cited by 110
Interactions between central nervous system and peripheral metabolic organs
Zeng, W., Yang, F., Shen, W. L., Zhan, C., Zheng, P., & Hu, J. (2022) · Science China Life Sciences · doi:10.1007/s11427-021-2103-5 · Cited by 103
Multiomics technologies: role in disease biomarker discoveries and therapeutics
Dar, M. A., Arafah, A. M., Bhat, K. A., Khan, A., Khan, M. S., Ali, A., Ahmad, S. M., Rashid, S. M., & Rehman, M. U. (2022) · Briefings in Functional Genomics · doi:10.1093/bfgp/elac017 · Cited by 102
Das, T. K., & Ganesh, B. P. (2023) · Gut Microbes · doi:10.1080/19490976.2023.2206504 · Cited by 102
Li, B., Evivie, S. E., Lu, J., Jiao, Y., Wang, C., Li, Z., Liu, F., & Huo, G. (2018) · Food & Function · doi:10.1039/c8fo01768a · Cited by 101
Anesthesia and surgery induce age-dependent changes in behaviors and microbiota
Liufu, N., Liu, L., Shen, S., Jiang, Z., Dong, Y., Wang, Y., Culley, D. J., Crosby, G. J., Cao, M., Shen, Y., et al. (2020) · Aging · doi:10.18632/aging.102736 · Cited by 101
The Interaction of Polyphenols and the Gut Microbiota in Neurodegenerative Diseases
Zhang, Y., Yu, W., Zhang, L., Wang, M., & Chang, W. (2022) · Nutrients · doi:10.3390/nu14245373 · Cited by 101
Fermented Soy Products: Beneficial Potential in Neurodegenerative Diseases
Jang, C. H., Oh, J., Lim, J. S., Kim, H. J., & Kim, J.-S. (2021) · Foods · doi:10.3390/foods10030636 · Cited by 100
Anorexia nervosa: Gut microbiota-immune-brain interactions
Roubalová, R., Procházková, P., Papežová, H., Smitka, K., Bilej, M., & Tlaskalová‐Hogenová, H. (2019) · Clinical Nutrition · doi:10.1016/j.clnu.2019.03.023 · Cited by 100
Murray, E. R., Kemp, M., & Nguyen, T. T. (2022) · Archives of Clinical Neuropsychology · doi:10.1093/arclin/acac008 · Cited by 100
Contribution of Trimethylamine N-Oxide (TMAO) to Chronic Inflammatory and Degenerative Diseases
Constantino-Jonapa, L. A., Espinoza-Palacios, Y., Escalona‐Montaño, A. R., Hernández-Ruiz, P., Amezcua-Guerra, L. M., Amedei, A., & Aguirre‐García, M. M. (2023) · Biomedicines · doi:10.3390/biomedicines11020431 · Cited by 99
Gut Microbiota, an Additional Hallmark of Human Aging and Neurodegeneration
Molinero, N., Antón‐Fernández, A., Hernández, F., Ávila, J., Bartolomé, B., & Moreno-Arribas, M. V. (2023) · Neuroscience · doi:10.1016/j.neuroscience.2023.02.014 · Cited by 101
Alzheimer’s disease as type 3 diabetes: understanding the link and implications
Kciuk, M., Kruczkowska, W., Gałęziewska, J., Wanke, K., Kałuzińska-Kołat, Ż., Aleksandrowicz, M., & Kontek, R. (2024) · International Journal of Molecular Sciences · doi:10.3390/ijms252211955 · Cited by 98
McGovern, A. S., Hamlin, A. S., & Winter, G. (2019) · Australian & New Zealand Journal of Psychiatry · doi:10.1177/0004867419877954 · Cited by 98
Sun, Q., Cheng, L., Zeng, X., Zhang, X., Wu, Z., & Weng, P. (2020) · International Journal of Biological Macromolecules · doi:10.1016/j.ijbiomac.2020.07.208 · Cited by 98
Ren, F., Wei, J., Chen, Q., Hu, M., Yu, L., Mi, J., Zhou, X., Qin, D., Wu, J., & Wu, A. (2025) · Acta Pharmaceutica Sinica B · doi:10.1016/j.apsb.2025.07.030 · Cited by 97
Yan, L., Guo, M.-S., Zhang, Y., Yu, L., Wu, J.-M., Tang, Y., Ai, W., Zhu, F.-D., Law, B. Y.-K., Chen, Q., et al. (2022) · Oxidative Medicine and Cellular Longevity · doi:10.1155/2022/5288698 · Cited by 97
Butler, M., Mörkl, S., Sandhu, K. V., Cryan, J. F., & Dinan, T. G. (2019) · The Canadian Journal of Psychiatry · doi:10.1177/0706743719874168 · Cited by 100
Metaproteomics: A strategy to study the taxonomy and functionality of the gut microbiota
Wang, Y., Zhou, Y., Xiao, X., Zheng, J., & Zhou, H. (2020) · Journal of Proteomics · doi:10.1016/j.jprot.2020.103737 · Cited by 97
Saji, N., Murotani, K., Hisada, T., Kunihiro, T., Tsuduki, T., Sugimoto, T., Kimura, A., Niida, S., Toba, K., & Sakurai, T. (2020) · Scientific Reports · doi:10.1038/s41598-020-65196-6 · Cited by 97
Jones, J. C., Reinke, S. N., Alishum, A., Palmer, D. J., & Christophersen, C. T. (2021) · Scientific Reports · doi:10.1038/s41598-021-93031-z · Cited by 99
Zheng, M., Ye, H., Yang, X., Shen, L., Dang, X., Liu, X., Gong, Y., Wu, Q., Wang, L., Ge, X., et al. (2023) · Brain Behavior and Immunity · doi:10.1016/j.bbi.2023.11.016 · Cited by 98
A crosstalk between gut and brain in sepsis-induced cognitive decline
Giridharan, V. V., Generoso, J. S., Lence, L., Candiotto, G., STRECK, E. L., Petronilho, F. C., Pillai, A., Sharshar, T., Dal‐Pizzol, F., & Barichello, T. (2022) · Journal of Neuroinflammation · doi:10.1186/s12974-022-02472-4 · Cited by 96
Early life adversity as a risk factor for cognitive impairment and Alzheimer’s disease
Huang, Z., Jordan, J. D., & Zhang, Q. (2023) · Translational Neurodegeneration · doi:10.1186/s40035-023-00355-z · Cited by 98
Interactions between the microbiota and enteric nervous system during gut-brain disorders
Fried, S. G., Wemelle, E., Cani, P. D., & Knauf, C. (2021) · Neuropharmacology · doi:10.1016/j.neuropharm.2021.108721 · Cited by 95
Gut microbiome interventions in human health and diseases
Nie, P., Li, Z., Wang, Y., Zhang, Y., Zhao, M., Luo, J., Du, S., Deng, Z., Chen, J., Wang, Y., et al. (2019) · Medicinal Research Reviews · doi:10.1002/med.21584 · Cited by 94
Austad, S. N., Ballinger, S. W., Buford, T. W., Carter, C. S., Smith, D. L., Darley-Usmar, V. M., & Zhang, J. (2021) · Acta Pharmaceutica Sinica B · doi:10.1016/j.apsb.2021.06.014 · Cited by 94
Matheson, J.-A. T., & Holsinger, R. M. D. (2023) · International Journal of Molecular Sciences · doi:10.3390/ijms24021001 · Cited by 96
Park, S., Zhang, T., Wu, X., & Qiu, J. Y. (2020) · Journal of Clinical Biochemistry and Nutrition · doi:10.3164/jcbn.19-87 · Cited by 93
Translational Roadmap for the Organs-on-a-Chip Industry toward Broad Adoption
Allwardt, V., Ainscough, A. J., Viswanathan, P., Sherrod, S. D., MCLEAN, J. A. J., Haddrick, M., & Pensabene, V. (2020) · Bioengineering · doi:10.3390/bioengineering7030112 · Cited by 93
Lipocalin 2 as a link between ageing, risk factor conditions and age-related brain diseases
Dekens, D. W., Eisel, U. L. M., Gouweleeuw, L., Schoemaker, R. G., Deyn, P. P. D., & Naudé, P. J. W. (2021) · Ageing Research Reviews · doi:10.1016/j.arr.2021.101414 · Cited by 93
Fekete, M., Lehoczki, A., Major, D., Fazekas‐Pongor, V., Csípő, T., Tarantini, S., Csizmadia, Z., & Varga, J. T. (2024) · Nutrients · doi:10.3390/nu16060789 · Cited by 94
Of microbes and minds: A narrative review on the second brain aging
Calvani, R., Picca, A., Lo Monaco, M. R., Landi, F., Bernabei, R., & Marzetti, E. (2018) · Frontiers in Medicine · doi:10.3389/fmed.2018.00053 · Cited by 92
Tang, W., Meng, Z., Li, N., Liu, Y., Li, L., Chen, D., & Yang, Y. (2021) · Frontiers in Cellular and Infection Microbiology · doi:10.3389/fcimb.2020.611014 · Cited by 94
Zhu, G., Zhao, J., Zhang, H., Chen, W., & Wang, G. (2021) · Foods · doi:10.3390/foods10071672 · Cited by 93
The gut microbiome and Alzheimer’s disease: Complex and bidirectional interactions
Tarawneh, R. M., & Penhos, E. (2022) · Neuroscience & Biobehavioral Reviews · doi:10.1016/j.neubiorev.2022.104814 · Cited by 92
Zhao, J., Hu, Y., Qian, C., Hussain, M., Liu, S., Zhang, A., He, R., & Sun, P. (2023) · Biology · doi:10.3390/biology12010122 · Cited by 91
Chenghan, M., Li, W., Zhao, B., He, Y., Li, Q., Zhang, T., Xiaojie, L., Zhang, K., Yingqian, Z., & Zhong, Z. (2025) · Annals of the New York Academy of Sciences · doi:10.1111/nyas.15299 · Cited by 93
Wang, M., Cao, J., Gong, C., Amakye, W. K., Yao, M., & Ren, J. (2021) · Brain Behavior and Immunity · doi:10.1016/j.bbi.2021.06.003 · Cited by 90
The Influence of Nutrition on Intestinal Permeability and the Microbiome in Health and Disease
Inczefi, O., Bacsúr, P., Resál, T., Keresztes, C., & Molnár, T. (2022) · Frontiers in Nutrition · doi:10.3389/fnut.2022.718710 · Cited by 90
Mohammadi, S., Moosaie, F., & Aarabi, M. H. (2020) · Molecular Neurobiology · doi:10.1007/s12035-020-02094-y · Cited by 89
Zhu, G., Zhao, J., Zhang, H., Chen, W., & Wang, G. (2021) · Nutrients · doi:10.3390/nu13051602 · Cited by 89
The influence of gut microbiota alteration on age-related neuroinflammation and cognitive decline
Shah, Z., & Alsegiani, A. S. (2022) · Neural Regeneration Research · doi:10.4103/1673-5374.335837 · Cited by 89
Varesi, A., Campagnoli, L. I. M., Fahmideh, F., Pierella, E., Romeo, M., Ricevuti, G., Nicoletta, M., Chirumbolo, S., & Pascale, A. (2022) · International Journal of Molecular Sciences · doi:10.3390/ijms232012289 · Cited by 88
Jia, W., Rajani, C., Kaddurah‐Daouk, R., & Li, H. (2020) · Medicinal Research Reviews · doi:10.1002/med.21653 · Cited by 88
Alterations in the gut bacterial microbiome in fungal Keratitis patients
Chakravarthy, S. K., Jayasudha, R., Ranjith, K., Dutta, A., Pinna, N. K., Mande, S. S., Sharma, S., Garg, P., Murthy, S. I., & Shivaji, S. (2018) · PLoS ONE · doi:10.1371/journal.pone.0199640 · Cited by 88
Holmes, A., Finger, C. E., Morales‐Scheihing, D., Lee, J., & McCullough, L. D. (2020) · Translational research · doi:10.1016/j.trsl.2020.07.012 · Cited by 88
Materials Used for the Microencapsulation of Probiotic Bacteria in the Food Industry
Kowalska, E., Ziarno, M., Ekielski, A., & Żelaziński, T. (2022) · Molecules · doi:10.3390/molecules27103321 · Cited by 88
Liu, P., Jia, X., Chen, Y., Yu, Y., Zhang, K., Lin, Y., Wang, B., & Peng, G. (2021) · CNS Neuroscience & Therapeutics · doi:10.1111/cns.13451 · Cited by 87
Alzheimer’s disease: Neurotransmitters of the sleep-wake cycle
Erum, J. V., Dam, D. V., & Deyn, P. P. D. (2019) · Neuroscience & Biobehavioral Reviews · doi:10.1016/j.neubiorev.2019.07.019 · Cited by 87
Shining Light on Human Gut Bacteriophages
Guerin, E., & Hill, C. (2020) · Frontiers in Cellular and Infection Microbiology · doi:10.3389/fcimb.2020.00481 · Cited by 88
Ramos, C., Gibson, G. R., Walton, G., Magistro, D., Kinnear, W., & Hunter, K. A. (2022) · Nutrients · doi:10.3390/nu14030674 · Cited by 87
Sheng, C., Yang, K. Y., He, B., Du, W., Cai, Y., & Han, Y. (2022) · Alzheimer s Research & Therapy · doi:10.1186/s13195-022-00977-x · Cited by 87
Lombardi, V. C., Meirleir, K. L. D., Subramanian, K., Nourani, S. M., Dagda, R. K., Delaney, S. L., & Palotás, A. (2018) · The Journal of Nutritional Biochemistry · doi:10.1016/j.jnutbio.2018.04.004 · Cited by 87
Yanuck, S. F. (2019) · Frontiers in Psychiatry · doi:10.3389/fpsyt.2019.00712 · Cited by 88
Dodiya, H. B., Frith, M., Sidebottom, A. M., Cao, Y., Koval, J., Chang, E. B., & Sisodia, S. S. (2020) · Scientific Reports · doi:10.1038/s41598-020-64797-5 · Cited by 86
Citraro, R., Lembo, F., Caro, C. D., Tallarico, M., Coretti, L., Iannone, L. F., Leo, A., Palumbo, D., Cuomo, M., Buommino, E., et al. (2021) · Epilepsia · doi:10.1111/epi.16813 · Cited by 86
Sex Differences in the Gut-Brain Axis: Implications for Mental Health
Holingue, C., Budavari, A. C., Rodriguez, K. M., Zisman, C. R., Windheim, G., & Fallin, M. D. (2020) · Current Psychiatry Reports · doi:10.1007/s11920-020-01202-y · Cited by 85
Zhao, H., Zhou, X., Song, Y., Zhao, W., Sun, Z., Zhu, J., & Yu, Y. (2025) · Alzheimer s Research & Therapy · doi:10.1186/s13195-025-01683-0 · Cited by 85
Could Alzheimer’s Disease Originate in the Periphery and If So How So?
Morris, G., Berk, M., Maes, M. H. J., & Puri, B. K. (2018) · Molecular Neurobiology · doi:10.1007/s12035-018-1092-y · Cited by 86
Li, Y., Shao, L., Mou, Y., Zhang, Y., & Ping, Y. (2021) · Gut Microbes · doi:10.1080/19490976.2021.1957407 · Cited by 84
Metadata
- Authors
- Vogt, N. M., Kerby, R. L., Dill-McFarland, K. A., Harding, S. J., Merluzzi, A. P., Johnson, S. C., Carlsson, C. M., Asthana, S., Zetterberg, H., Blennow, K., Bendlin, B. B., & Rey, F. E.
- Affiliations
- University of Wisconsin–Madison (US)
- Sahlgrenska University Hospital (SE)
- Corresponding author
- Bendlin, Barbara B.
- Rey, Federico E.
- ORCID
- Venue
- Scientific Reports
- Published
- 2017-10-19
- Volume
- 7
- Issue
- 1
- Pages
- 13537-13537
- ISSN
- 2045-2322 (ISSN-L)
- PMC
- PMC5648830
- OpenAlex
- W2761210275
- Cited by
- 2,137
- References
- 83
- Citations by year
- 2026: 205 · 2025: 322 · 2024: 328 · 2023: 269 · 2022: 339 · 2021: 283 · 2020: 205 · 2019: 119 · 2018: 64 · 2017: 1
- FWCI
- 43.23
- Type
- journal article
- Language
- en
- Open access
- gold
- doi.org
- Locations
- Scientific Reports (publishedVersion, cc-by)
- PubMed Central (publishedVersion, cc-by)
- PubMed (publishedVersion)
- UCL Discovery (University College London) (submittedVersion, cc-by)
- DOAJ (DOAJ: Directory of Open Access Journals) (submittedVersion)
- Funders
- Alzheimer's Association (R01 AG027161, R01 AG037639, R01 AG021155)
- Torsten Söderbergs Stiftelse
- Rush University
- Georgia Clinical and Translational Science Alliance (UL1TR000427)
- Royal Swedish Academy of Sciences
- Vetenskapsrådet
- National Institutes of Health (UL1TR000427, NIH P50, AG027161, AG037639, NIH P50 AG033514, AG033514)
- Institute for Clinical and Translational Research, University of Wisconsin, Madison (UL1TR000427)
- National Institute on Aging (RF1AG027161, R01AG037639, P50AG033514, R01AG021155, R01AG027161, R56AG037639)
- National Institute of General Medical Sciences (T32GM008692)
- National Center for Advancing Translational Sciences
- Topics
- Life Sciences › Biochemistry, Genetics and Molecular Biology › Molecular Biology › Gut microbiota and health
- Life Sciences › Neuroscience › Cellular and Molecular Neuroscience › Alzheimer's disease research and treatments
- Health Sciences › Medicine › Psychiatry and Mental health › Dementia and Cognitive Impairment Research
- Keywords
- Alzheimer's disease, gut microbiota, dementia, fecal microbiota, microbial diversity, Firmicutes, Bacteroidetes, Bifidobacterium, cerebrospinal fluid biomarkers, amyloid deposition, gut-brain axis, therapeutic target
- MeSH terms
- Bacillota, Gastrointestinal Microbiome, Aged, Alzheimer Disease, Bifidobacterium, Feces, Female, Humans, Male, Biomarkers, Case-Control Studies, tau Proteins, Bacteroidetes
About these checks
Registry, retraction, Cites and statistics results are computed, not judged, with one exception: a printed reference that no index lists is read once by a model before it counts as a citation error. Claims are extracted by a model and kept only when their quote appears verbatim in the text; each cited source is then checked, with a model’s help, for whether it says what the claim relies on. Those verdicts can be wrong — read the claim’s quote and the cited source before relying on one.
Statistics and arithmetic are recomputed, not judged.
Confidence bands are shown only for fields calibrated on our annotated test set. None is calibrated yet, so no band is shown.
What counts as a claim ›How we measure confidence ›How we check this ›
Are you an author, or do you see a problem with this page? Request a review
