

A flexible organic reflectance oximeter array
Open accessThe DOI matches its Crossref record; 38 of the 38 references it cites were found in a registry or an index.
Abstract
Significance: The optical method to determine oxygen saturation in blood is limited to only tissues that can be transilluminated. The status quo provides a single-point measurement and lacks 2D oxygenation mapping capability. We use organic printed optoelectronics in a flexible array configuration that senses reflected light from tissue. Our reflectance oximeter is used beyond conventional sensing locations and accurately measures oxygen saturation on the forehead. In a full system implementation, coupled with a mathematical model, we create 2D oxygenation maps of adult forearms under pressure-cuff–induced ischemia. Our skin-like flexible sensor system has the potential to transform oxygenation monitoring of tissues, wounds, skin grafts, and transplanted organs.
Overview
The claims and statistics of this paper haven’t been checked yet.
Free: it reads the open-access text and checks the first 5 claims that cite a source we can check. Create a free account to check every claim.
Integrity signals
Registry
Cites
Statistics
Figures


Verification
Claims the paper makes
The claims and statistics of this paper haven’t been checked yet.
Free: it reads the open-access text and checks the first 5 claims that cite a source we can check. Create a free account to check every claim.
Claims other papers make about this one
Each is checked against this paper’s own text: does it say what the citing paper says it does?
The source backs part of the claim, not all of it — or backs it for a different population, condition or comparison.
In the citing paper
“A racial discrepancy has been established in pulse oximeters, which rely on transmission PPG, a slightly different form of the technology.”
From Accuracy of heart rate measurement with wrist-worn wearable devices in various skin tones: a systematic review (2023) · cites this paper as [5]
Experimental — accuracy not yet measuredThe source backs part of the claim, not all of it — or backs it for a different population, condition or comparison.
In the citing paper
“The first presented device (Figure 1c) is an ultra-thin flexible oximeter array with silicon-integrated circuits that can monitor a pulsatile arterial blood signal [14].”
From The Current State of Optical Sensors in Medical Wearables (2022) · cites this paper as [14]
Experimental — accuracy not yet measuredThe cited source says what the claim attributes to it.
In the citing paper
“PPG uses optical differences between the vascular and other tissues or oxygenated and deoxygenated hemoglobin to measure heart rate,[263] blood oxygen,[267] and other in-depth cardiovascular information.[268]”
From Flexible Electronics and Devices as Human–Machine Interfaces for Medical Robotics (2022) · cites this paper as [267]
In the citing paper
“Instead of photodetectors measuring reflected light, they measure LED light that shines through the tissue to the opposite side, restricting it to locations that can be transilluminated, such as the earlobes and fingers [5].”
From Accuracy of heart rate measurement with wrist-worn wearable devices in various skin tones: a systematic review (2023) · cites this paper as [5]
Self-check
Percentages, sums and reported differences re-computed from the paper’s own numbers.
The self-check needs the paper’s full text.
Citations
Cites
Fully integrated wearable sensor arrays for multiplexed in situ perspiration analysis
Gao, W., Emaminejad, S., Nyein, H. Y. Y., Challa, S., Chen, K., Peck, A., Fahad, H. M., Ota, H., Shiraki, H., Kiriya, D., et al. (2016) · Nature · doi:10.1038/nature16521 · Cited by 5,087
Trung, T. Q., & Lee, N. (2016) · Advanced Materials · doi:10.1002/adma.201504244 · Cited by 2,160
The rise of plastic bioelectronics
Someya, T., Bao, Z., & Malliaras, G. G. (2016) · Nature · doi:10.1038/nature21004 · Cited by 1,884 · cited 2×
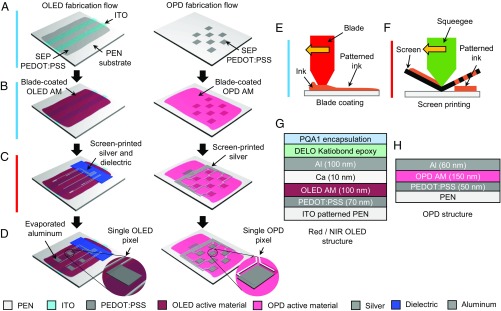
“(A) Three layers of optoelectronics - (1) OPD array layer, (2) NIR OLED array layer, and (3) Red OLED array layer are fabricated on separate substrates.”
BackgroundRecent Advances in Flexible and Stretchable Bio‐Electronic Devices Integrated with Nanomaterials
Choi, S., Lee, H., Ghaffari, R., Hyeon, T., & Kim, D. (2016) · Advanced Materials · doi:10.1002/adma.201504150 · Cited by 1,104 · cited 1×
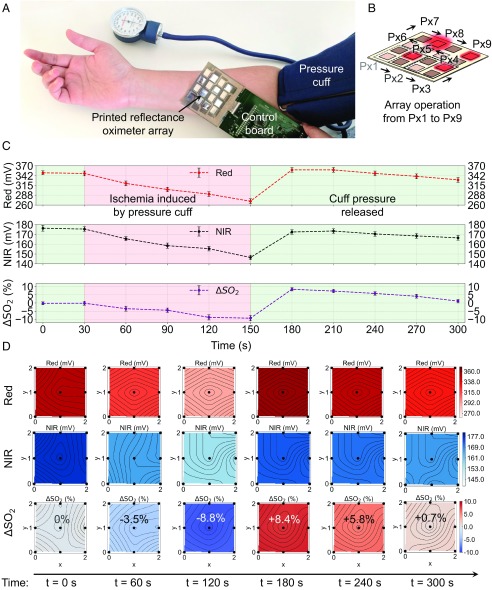
“(B) Similar to A, stationary (dc) signal magnitude for red (4) and NIR ( ) channels.”
BackgroundUltraflexible organic photonic skin
Yokota, T., Zalar, P., Kaltenbrunner, M., Jinno, H., Matsuhisa, N., Kitanosako, H., Tachibana, Y., Yukita, W., Koizumi, M., & Someya, T. (2016) · Science Advances · doi:10.1126/sciadv.1501856 · Cited by 1,024
A skin-inspired organic digital mechanoreceptor
Tee, B. C.-K., Chortos, A., Berndt, A., Nguyen, A. K., Tom, A., McGuire, A., Lin, Z. C., Tien, K., Bae, W.-G., Wang, H., et al. (2015) · Science · doi:10.1126/science.aaa9306 · Cited by 882
All-organic optoelectronic sensor for pulse oximetry
Lochner, C. M., Khan, Y., Pierre, A., & Arias, A. C. (2014) · Nature Communications · doi:10.1038/ncomms6745 · Cited by 726
Self-citationWound healing essentials: Let there be oxygen
Sen, C. K. (2009) · Wound Repair and Regeneration · doi:10.1111/j.1524-475x.2008.00436.x · Cited by 713
Graphene Electronic Tattoo Sensors
Kabiri Ameri, S., Ho, R., Jang, H., Tao, L., Wang, Y., Wang, L., Schnyer, D. M., Akinwande, D., & Lu, N. (2017) · ACS Nano · doi:10.1021/acsnano.7b02182 · Cited by 669
Duncan, A., Meek, J. H., Clemence, M., Elwell, C. E., Tyszczuk, L., Cope, M., & Delpy, D. (1995) · Physics in Medicine and Biology · doi:10.1088/0031-9155/40/2/007 · Cited by 649
Research works printed but not linked: 1
- S Nakajimi, H Hirai, H Takase, A Kuze, S Aoyagi, New pulsed-type earpiece oximeter. Respiration Circ 23, 709–713 (1975).
Cited by
Bio-Integrated Wearable Systems: A Comprehensive Review
Ray, T. R., Choi, J., Bandodkar, A. J., Krishnan, S., Gutruf, P., Tian, L., Ghaffari, R., & Rogers, J. A. (2019) · Chemical Reviews · doi:10.1021/acs.chemrev.8b00573 · Cited by 1,350
Lim, H., Kim, H. S., Qazi, R., Kwon, Y., Jeong, J., & Yeo, W. (2020) · Advanced Materials · doi:10.1002/adma.201901924 · Cited by 1,002
A New Frontier of Printed Electronics: Flexible Hybrid Electronics
Khan, Y., Thielens, A., Muin, S., Ting, J., Baumbauer, C., & Arias, A. C. (2020) · Advanced Materials · doi:10.1002/adma.201905279 · Cited by 891
Self-citationOrganic Photodetectors for Next‐Generation Wearable Electronics
Chow, P. C. Y., & Someya, T. (2020) · Advanced Materials · doi:10.1002/adma.201902045 · Cited by 779
A wearable biosensing system with in-sensor adaptive machine learning for hand gesture recognition
Moin, A., Zhou, A., Rahimi, A., Menon, A., Benatti, S., Alexandrov, G., Tamakloe, S., Ting, J., Yamamoto, N., Khan, Y., et al. (2020) · Nature Electronics · doi:10.1038/s41928-020-00510-8 · Cited by 680
Self-citation
Metadata
- Authors
- Khan, Y., Han, D., Pierre, A., Ting, J., Wang, X., Lochner, C. M., Bovo, G., Yaacobi-Gross, N., Newsome, C., Wilson, R., & Arias, A. C.
- Affiliations
- University of California, Berkeley (US)
- Cambridge Display Technology (United Kingdom) (GB)
- Cambridge Display Technology Limited, Godmanchester, Cambridgeshire, PE29 2XG, United Kingdom
- Corresponding author
- Khan, Yasser
- Arias, Ana C.
- Venue
- Proceedings of the National Academy of Sciences
- Publisher
- National Academy of Sciences
- Published
- 2018-11-07
- Volume
- 115
- Issue
- 47
- Pages
- E11015-E11024
- ISSN
- 0027-8424 (ISSN-L)
- 1091-6490
- PMC
- PMC6255203
- OpenAlex
- W2899609120
- Cited by
- 278
- References
- 38
- Citations by year
- 2026: 18 · 2025: 29 · 2024: 33 · 2023: 38 · 2022: 44 · 2021: 52 · 2020: 39 · 2019: 25
- FWCI
- 11.59
- Type
- journal article
- Language
- en
- Open access
- hybrid
- doi.org
- Licence
- Locations
- Proceedings of the National Academy of Sciences (publishedVersion, cc-by-nc-nd)
- Europe PMC (PubMed Central) (publishedVersion, cc-by-nc-nd)
- PubMed Central (publishedVersion, cc-by-nc-nd)
- PubMed (publishedVersion)
- eScholarship (California Digital Library) (submittedVersion)
- eScholarship (California Digital Library) (submittedVersion, cc-by-nc-nd)
- Funders
- Intel Corporation (Semiconductor Research Corporation Grant No. 2014-IN-2571)
- Topics
- Physical Sciences › Engineering › Biomedical Engineering › Non-Invasive Vital Sign Monitoring
- Physical Sciences › Chemistry › Analytical Chemistry › Analytical Chemistry and Sensors
- Health Sciences › Medicine › Radiology, Nuclear Medicine and Imaging › Optical Imaging and Spectroscopy Techniques
- Keywords
- pulse oximetry, organic light-emitting diodes, organic photodiodes, flexible sensors, oxygen saturation, ischemia, arterial pulsation, tissue oxygenation
- MeSH terms
- Adult, Equipment Design, Forearm, Forehead, Humans, Ischemia, Models, Theoretical, Oximetry, Oxygen, Oxyhemoglobins
About these checks
Registry, retraction, Cites and statistics results are computed, not judged, with one exception: a printed reference that no index lists is read once by a model before it counts as a citation error. Claims are extracted by a model and kept only when their quote appears verbatim in the text; each cited source is then checked, with a model’s help, for whether it says what the claim relies on. Those verdicts can be wrong — read the claim’s quote and the cited source before relying on one.
Statistics and arithmetic are recomputed, not judged.
Confidence bands are shown only for fields calibrated on our annotated test set. None is calibrated yet, so no band is shown.
What counts as a claim ›How we measure confidence ›How we check this ›
Are you an author, or do you see a problem with this page? Request a review
How to cite
Cite CoChat for the checks on this page, and the paper for its own findings.
- This page
- CoChat. (2026). Citation check: A flexible organic reflectance oximeter array. https://app.cochat.ai/papers/10.1073/pnas.1813053115
- The paper
- Khan, Y., Han, D., Pierre, A., Ting, J., Wang, X., Lochner, C. M., Bovo, G., Yaacobi-Gross, N., Newsome, C., Wilson, R., & Arias, A. C. (2018). A flexible organic reflectance oximeter array. Proceedings of the National Academy of Sciences. https://doi.org/10.1073/pnas.1813053115
Data sources
Bibliographic data: Semantic Scholar, OpenAlex, Crossref.
Contains information from the Semantic Scholar Academic Graph Datasets, made available under the ODC Attribution License (ODC-BY 1.0).
Semantic Scholar’s data is described in: Kinney, R., et al. (2023). The Semantic Scholar Open Data Platform. arXiv:2301.10140.
