

The DOI matches its Crossref record; 51 of the 51 references it cites were found in a registry or an index.
Single-cell transcriptomics reveals expansion of cytotoxic CD4 T cells in supercentenarians
Open accessPublished version of a preprint
Abstract
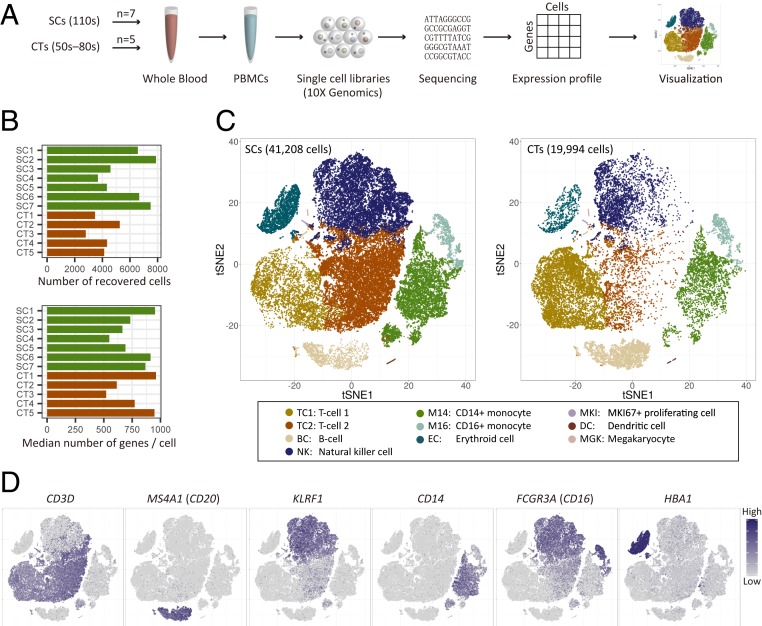
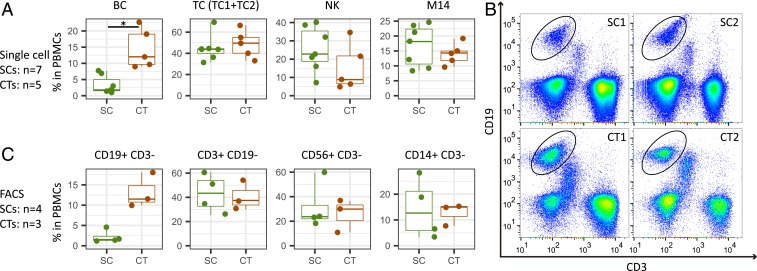
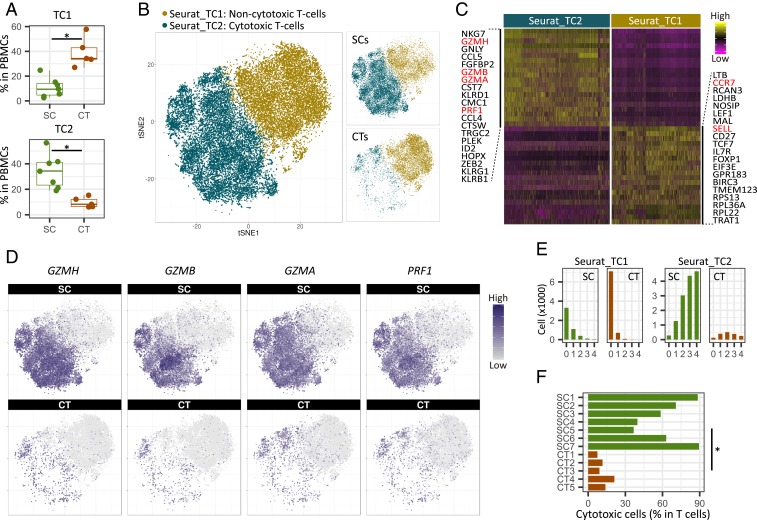
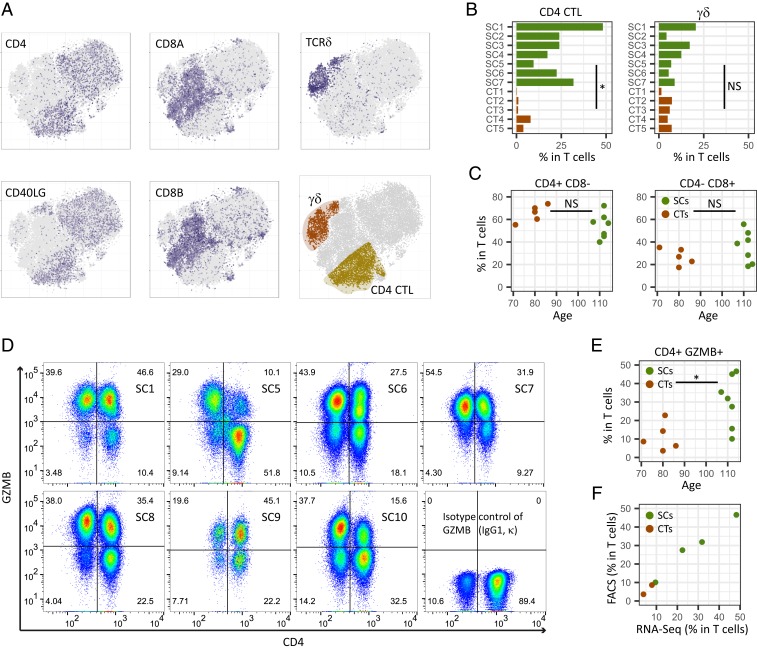
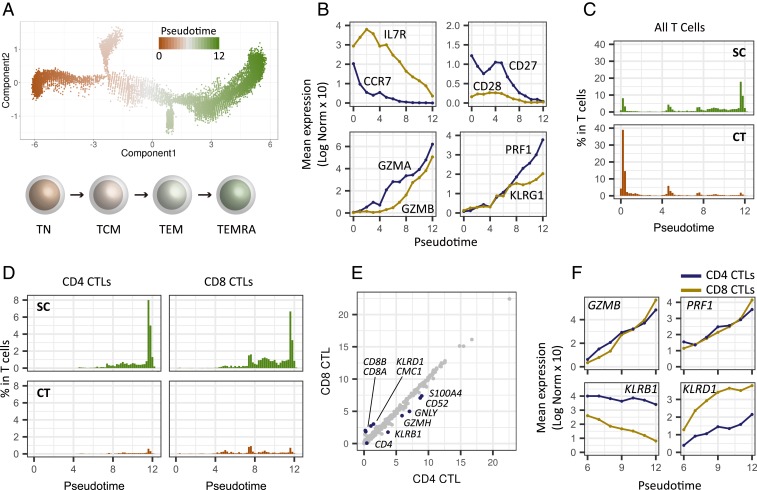
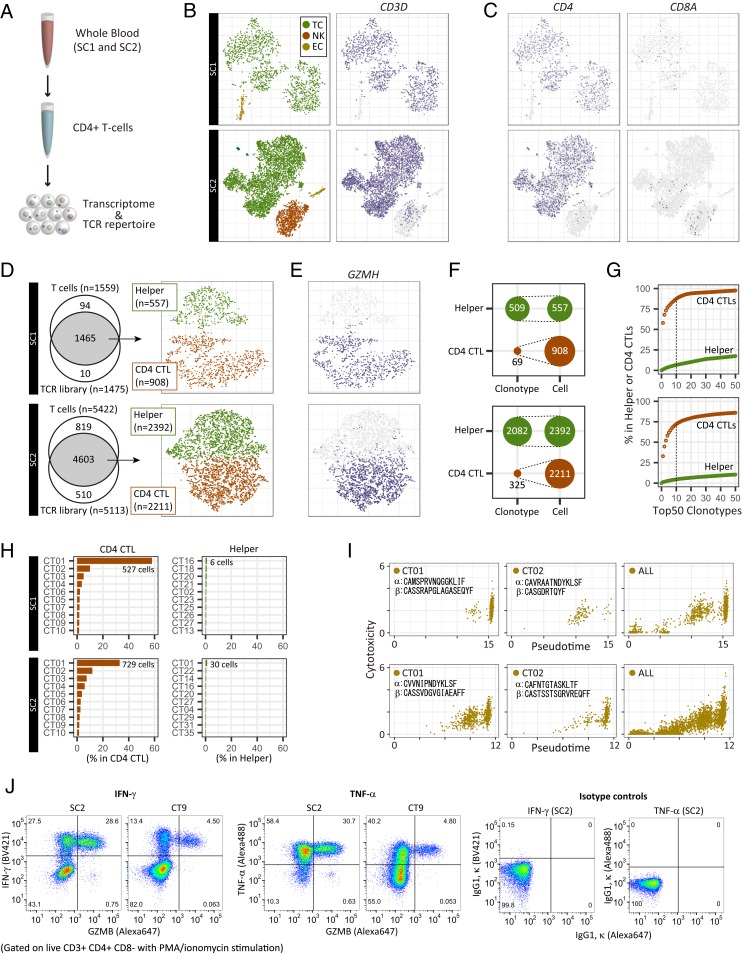
Supercentenarians, people who have reached 110 y of age, are a great model of healthy aging. Their characteristics of delayed onset of age-related diseases and compression of morbidity imply that their immune system remains functional. Here we performed single-cell transcriptome analysis of 61,202 peripheral blood mononuclear cells (PBMCs), derived from 7 supercentenarians and 5 younger controls. We identified a marked increase of cytotoxic CD4 T cells (CD4 cytotoxic T lymphocytes [CTLs]) as a signature of supercentenarians. Furthermore, single-cell T cell receptor sequencing of 2 supercentenarians revealed that CD4 CTLs had accumulated through massive clonal expansion, with the most frequent clonotypes accounting for 15 to 35% of the entire CD4 T cell population. The CD4 CTLs exhibited substantial heterogeneity in their degree of cytotoxicity as well as a nearly identical transcriptome to that of CD8 CTLs. This indicates that CD4 CTLs utilize the transcriptional program of the CD8 lineage while retaining CD4 expression. Indeed, CD4 CTLs extracted from supercentenarians produced IFN-γ and TNF-α upon ex vivo stimulation. Our study reveals that supercentenarians have unique characteristics in their circulating lymphocytes, which may represent an essential adaptation to achieve exceptional longevity by sustaining immune responses to infections and diseases.
Overview
The claims and statistics of this paper haven’t been checked yet.
Run the check — free, no account needed. It reads the open-access text and checks the sources it cites.
Integrity signals
Registry
Cites
Statistics
Figures
Verification
Claims the paper makes
The claims and statistics of this paper haven’t been checked yet.
Run the check — free, no account needed. It reads the open-access text and checks the sources it cites.
Claims other papers make about this one
Each is checked against this paper’s own text: does it say what the citing paper says it does?
The cited source says what the claim attributes to it.
In the citing paper
“Studies have shown lower levels of B cells, similar numbers of T cells, and a higher percentage of cytotoxic T cells in the peripheral blood of supercentenarians.318”
From Inflammation and aging: signaling pathways and intervention therapies (2023) · cites this paper as [318]
In the citing paper
“CD8+ cytotoxic T cells directly eradicate target cells using cytotoxic molecules via recognizing MHC I molecules within nearly all cells [127].”
From Immune Clearance of Senescent Cells to Combat Ageing and Chronic Diseases (2020) · cites this paper as [127]
Self-check
Percentages, sums and reported differences re-computed from the paper’s own numbers.
The self-check needs the paper’s full text.
Citations
Cites
STAR: ultrafast universal RNA-seq aligner
Dobin, A., Davis, C. A., Schlesinger, F., Drenkow, J., Zaleski, C., Jha, S., Batut, P., Chaisson, M., & Gingeras, T. R. (2013) · Bioinformatics · doi:10.1093/bioinformatics/bts635 · Cited by 51,709
Integrating single-cell transcriptomic data across different conditions, technologies, and species
Butler, A., Hoffman, P., Smibert, P., Papalexi, E., & Satija, R. (2018) · Nature Biotechnology · doi:10.1038/nbt.4096 · Cited by 13,174
Massively parallel digital transcriptional profiling of single cells
Zheng, G. X. Y., Terry, J. M., Belgrader, P., Ryvkin, P., Bent, Z. W., Wilson, R., Ziraldo, S. B., Wheeler, T. D., McDermott, G. P., Zhu, J., et al. (2017) · Nature Communications · doi:10.1038/ncomms14049 · Cited by 7,353
Landscape of Infiltrating T Cells in Liver Cancer Revealed by Single-Cell Sequencing
Zheng, C., Zheng, L., Yoo, J.-K., Guo, H., Zhang, Y., Guo, X., Kang, B., Hu, R., Huang, J. Y., Zhang, Q., et al. (2017) · Cell · doi:10.1016/j.cell.2017.05.035 · Cited by 2,152
Single-cell mRNA quantification and differential analysis with Census
Qiu, X., Hill, A. J., Packer, J. S., Lin, D., Ma, Y.-A., & Trapnell, C. (2017) · Nature Methods · doi:10.1038/nmeth.4150 · Cited by 1,904
Single-cell RNA sequencing to explore immune cell heterogeneity
Papalexi, E., & Satija, R. (2018) · Nature Reviews Immunology · doi:10.1038/nri.2017.76 · Cited by 1,806
HIV Infection, Inflammation, Immunosenescence, and Aging
Deeks, S. G. (2011) · Annual Review of Medicine · doi:10.1146/annurev-med-042909-093756 · Cited by 1,349
Cell intrinsic alterations underlie hematopoietic stem cell aging
Rossi, D. J., Bryder, D., Zahn, J. M., Ahlenius, H., Sonu, R., Wagers, A. J., & Weissman, I. L. (2005) · Proceedings of the National Academy of Sciences · doi:10.1073/pnas.0503280102 · Cited by 1,152 · cited 1×
“5 stem cells in bone marrow exhibit a myeloid-biased differentiation potential (12, 13), which 70 causes changes in the cell population of peripheral blood.”
BackgroundSingle-cell RNA-seq enables comprehensive tumour and immune cell profiling in primary breast cancer
Chung, W., Eum, H. H., Lee, H.-O., Lee, K.-M., Lee, H.-B., Kim, K.-T., Ryu, H. S., Kim, S., Lee, J. E., Park, Y. H., et al. (2017) · Nature Communications · doi:10.1038/ncomms15081 · Cited by 992 · cited 1×
“These methods have been applied to various subjects such as finding signatures of aging in the human pancreas (22), observing infiltrating T cells in tumors (23, 24), and characterizing diversity of cell types during brain development (25).”
MethodHuman bone marrow hematopoietic stem cells are increased in frequency and myeloid-biased with age
Pang, W. W., Price, E. A., Sahoo, D., Beerman, I., Maloney, W. J., Rossi, D. J., Schrier, S. L., & Weissman, I. L. (2011) · Proceedings of the National Academy of Sciences · doi:10.1073/pnas.1116110108 · Cited by 991
Cited by
Sorted by citations
Cells of the adult human heart
Litviňuková, M., Talavera-López, C., Maatz, H., Reichart, D., Worth, C. L., Lindberg, E. L., Kanda, M., Polanski, K., Heinig, M., Lee, M., et al. (2020) · Nature · doi:10.1038/s41586-020-2797-4 · Cited by 1,729
Inflammation and aging: signaling pathways and intervention therapies
Li, X., Li, C., Zhang, W., Wang, Y., Qian, P., & Huang, H. (2023) · Signal Transduction and Targeted Therapy · doi:10.1038/s41392-023-01502-8 · Cited by 1,443
“Studies have shown lower levels of B cells, similar numbers of T cells, and a higher percentage of cytotoxic T cells in the peripheral blood of supercentenarians.(318) Compared with animal models, the centenarian model can more realistically reflect the changes in human organs as well as peripheral blood components an…”
ResultWhy does COVID-19 disproportionately affect older people?
Mueller, A. L., McNamara, M. S., & Sinclair, D. A. (2020) · Aging · doi:10.18632/aging.103344 · Cited by 1,128
Sun, L., Su, Y., Jiao, A., Wang, X., & Zhang, B. (2023) · Signal Transduction and Targeted Therapy · doi:10.1038/s41392-023-01471-y · Cited by 1,153
Confronting false discoveries in single-cell differential expression
Squair, J. W., Gautier, M., Kathe, C., Anderson, M. A., James, N. D., Hutson, T. H., Hudelle, R., Qaiser, T., Matson, K. J. E., Barraud, Q., et al. (2021) · doi:10.1101/2021.03.12.435024 · Cited by 1,086
Mittelbrunn, M., & Kroemer, G. (2021) · Nature Immunology · doi:10.1038/s41590-021-00927-z · Cited by 702
Mogilenko, D. A., Shpynov, O., Andhey, P. S., Arthur, L., Swain, A., Esaulova, E., Brioschi, S., Shchukina, I., Kerndl, M., Bambouskova, M., et al. (2021) · Immunity · doi:10.1016/j.immuni.2020.11.005 · Cited by 683
Blocking PD-L1–PD-1 improves senescence surveillance and ageing phenotypes
Wang, T.-W., Johmura, Y., Suzuki, N., Omori, S., Migita, T., Yamaguchi, K., Hatakeyama, S., Yamazaki, S., Shimizu, E., Imoto, S., et al. (2022) · Nature · doi:10.1038/s41586-022-05388-4 · Cited by 469
Cytotoxic CD4+ T cells in cancer: Expanding the immune effector toolbox
Oh, D. Y., & Fong, L. (2021) · Immunity · doi:10.1016/j.immuni.2021.11.015 · Cited by 467
Immune ageing at single-cell resolution
Mogilenko, D. A., Shchukina, I., & Artyomov, M. N. (2021) · Nature reviews. Immunology · doi:10.1038/s41577-021-00646-4 · Cited by 396
scCODA is a Bayesian model for compositional single-cell data analysis
Büttner, M., Ostner, J., Müller, C. L., Theis, F. J., & Schubert, B. (2021) · Nature Communications · doi:10.1038/s41467-021-27150-6 · Cited by 388
CD4 T Helper Cell Subsets and Related Human Immunological Disorders
Zhu, X., & Zhu, J. (2020) · International Journal of Molecular Sciences · doi:10.3390/ijms21218011 · Cited by 413
The role of T cells in age-related diseases
Carrasco, E., Heras, M. M. G. D. L., Gabandé‐Rodríguez, E., Desdín-Micó, G., Aranda, J. F., & Mittelbrunn, M. (2021) · Nature reviews. Immunology · doi:10.1038/s41577-021-00557-4 · Cited by 250
Allué‐Guardia, A., García, J. I., & Torrelles, J. B. (2021) · Frontiers in Microbiology · doi:10.3389/fmicb.2021.612675 · Cited by 233
Human immunology and immunotherapy: main achievements and challenges
Varadé, J., Magadán, S., & González‐Fernández, Á. (2020) · Cellular and Molecular Immunology · doi:10.1038/s41423-020-00530-6 · Cited by 228
Immunosenescence, aging and successful aging
Wang, Y., Chen, D., Han, Y., Gu, Z., & Sun, C. C. (2022) · Frontiers in Immunology · doi:10.3389/fimmu.2022.942796 · Cited by 237
Terekhova, M., Swain, A., Bohacova, P., Aladyeva, E., Arthur, L., Laha, A., Mogilenko, D. A., Burdess, S., Sukhov, V., Kleverov, D., et al. (2023) · Immunity · doi:10.1016/j.immuni.2023.10.013 · Cited by 199
Immune Clearance of Senescent Cells to Combat Ageing and Chronic Diseases
Song, P., An, J., & Zou, M.-H. (2020) · Cells · doi:10.3390/cells9030671 · Cited by 198
“However, the supercentenarians have a dramatic reduction of the B-cell number compared with controls [127].”
BackgroundSARS–CoV-2–specific T cell responses and correlations with COVID-19 patient predisposition
Sattler, A., Angermair, S., Stockmann, H., Heim, K. M., Khadzhynov, D., Treskatsch, S., Halleck, F., Kreis, M. E., & Kotsch, K. (2020) · Journal of Clinical Investigation · doi:10.1172/jci140965 · Cited by 196
Hallmarks of aging and immunosenescence: Connecting the dots
Rodrigues, L. P., Teixeira, V. R., Alencar‐Silva, T., Simonassi-Paiva, B., Pereira, R. W., Pogue, R. E., & Carvalho, J. L. (2021) · Cytokine & Growth Factor Reviews · doi:10.1016/j.cytogfr.2021.01.006 · Cited by 193
Aging and InflammationPreprint
Singh, A., Schurman, S. H., Bektas, A., Kaileh, M., Roy, R., Wilson, D. M., Sen, R., & Ferrucci, L. (2023) · Cold Spring Harbor Perspectives in Medicine · doi:10.1101/cshperspect.a041197 · Cited by 201
Generation of ovarian follicles from mouse pluripotent stem cells
Yoshino, T., Suzuki, T., Nagamatsu, G., Yabukami, H., Ikegaya, M., Kishima, M., Kita, H., Imamura, T., Nakashima, K., Nishinakamura, R., et al. (2021) · Science · doi:10.1126/science.abe0237 · Cited by 188
Self-citationThe Era of Cytotoxic CD4 T Cells
Cenerenti, M., Saillard, M., Romero, P. J., & Jandus, C. (2022) · Frontiers in Immunology · doi:10.3389/fimmu.2022.867189 · Cited by 184
Cytotoxic CD4 + T Cells Eliminate Senescent Cells by Targeting Commensal Cytomegalovirus Antigen
Hasegawa, T., Oka, T., Son, H. G., Oliver-Garcia, V. S., Azin, M., Eisenhaure, T., Lieb, D., Hacohen, N., & Demehri, S. (2022) · Cell · doi:10.1016/j.cell.2023.02.033 · Cited by 163
Luo, O. J., Lei, W., Zhu, G., Ren, Z., Xu, Y., Xiao, C., Zhang, H., Cai, J., Luo, Z., Gao, L., et al. (2022) · Nature Aging · doi:10.1038/s43587-022-00198-9 · Cited by 158
Zhu, H., Chen, J., Liu, K., Gao, L., Wu, H., Ma, L., Zhou, J., Liu, Z., & Han, J. J. (2023) · Science Advances · doi:10.1126/sciadv.abq7599 · Cited by 157
Hematopoietic aging promotes cancer by fueling IL-1⍺–driven emergency myelopoiesis
Park, M. D., Bérichel, J. L., Hamon, P., Wilk, C. M., Belabed, M., Yatim, N., Saffon, A., Boumelha, J., Falcomatà, C., Tepper, A., et al. (2024) · Science · doi:10.1126/science.adn0327 · Cited by 149
Wang, Y., Li, R., Tong, R., Chen, T., Sun, M., Luo, L., Li, Z., Chen, Y., Zhao, Y., Zhang, C., et al. (2025) · Nature Immunology · doi:10.1038/s41590-024-02059-6 · Cited by 149
Wang, P., Yao, L., Luo, M., Zhou, W., Jin, X., Xu, Z., Shi, Y., Li, Y., Xu, C., Cheng, R., et al. (2021) · Cell Discovery · doi:10.1038/s41421-021-00280-3 · Cited by 129
The Role of Immune Cells in Oxi-Inflamm-Aging
de Toda, I. M., Ceprián, N., Cerro, E. D., & la Fuente, M. D. (2021) · Cells · doi:10.3390/cells10112974 · Cited by 124
CTLs heterogeneity and plasticity: implications for cancer immunotherapy
Peng, S., Lin, A., Jiang, A., Zhang, C., Zhang, J., Cheng, Q., Luo, P., & Bai, Y. (2024) · Molecular Cancer · doi:10.1186/s12943-024-01972-6 · Cited by 114
Cellular senescence, DNA damage, and neuroinflammation in the aging brain
Zhang, W., Sun, H., Wang, X., Dumont, A. S., & Liu, Q. (2024) · Trends in Neurosciences · doi:10.1016/j.tins.2024.04.003 · Cited by 121
Nathan, A., Beynor, J. I., Baglaenko, Y., Suliman, S., Ishigaki, K., Asgari, S., Huang, C.-C., Luo, Y., Zhang, Z., Lopez, K., et al. (2021) · Nature Immunology · doi:10.1038/s41590-021-00933-1 · Cited by 103
Extremely Differentiated T Cell Subsets Contribute to Tissue Deterioration During Aging
Soto‐Heredero, G., Heras, M. M. G. D. L., Escrig-Larena, J. I., & Mittelbrunn, M. (2023) · Annual Review of Immunology · doi:10.1146/annurev-immunol-101721-064501 · Cited by 96
Wang, Y., Chen, Z., Wang, T., Guo, H., Liu, Y., Dang, N., Hu, S., Wu, L., Zhang, C., Ye, K., et al. (2021) · Cellular & Molecular Immunology · doi:10.1038/s41423-020-00615-2 · Cited by 82
Elyahu, Y., & Monsonego, A. (2020) · Ageing Research Reviews · doi:10.1016/j.arr.2020.101231 · Cited by 93
Karagiannis, T. T., Dowrey, T. W., Villacorta-Martín, C., Montano, M. A., Reed, E. R., Belkina, A. C., Andersen, S. L., Perls, T. T., Monti, S., Murphy, G. J., et al. (2023) · EBioMedicine · doi:10.1016/j.ebiom.2023.104514 · Cited by 88
Ma, J., Tibbitt, C. A., Georén, S. K., Christian, M., Murrell, B., Cardell, L., Bachert, C., & Coquet, J. M. (2021) · Science Immunology · doi:10.1126/sciimmunol.abg6356 · Cited by 82
Preglej, T., & Ellmeier, W. (2022) · Immunology Letters · doi:10.1016/j.imlet.2022.05.001 · Cited by 86
Immunology in the Era of Single-Cell Technologies
Efremova, M., Vento‐Tormo, R., Park, J.-E., Teichmann, S. A., & James, K. R. (2020) · Annual Review of Immunology · doi:10.1146/annurev-immunol-090419-020340 · Cited by 80
Estimation of tumor cell total mRNA expression in 15 cancer types predicts disease progression
Cao, S., Wang, J. R., Ji, S., Peng, Y., Dai, Y., Guo, S., Montierth, M. D., Shen, J. P., Zhao, X. H., Chen, J., et al. (2022) · Nature Biotechnology · doi:10.1038/s41587-022-01342-x · Cited by 81
Takahara, T., Nakamura, S., Tsuzuki, T., & Satou, A. (2023) · Cancers · doi:10.3390/cancers15030835 · Cited by 81
Asian diversity in human immune cells
Kock, K. H., Tan, L. M., Han, K. Y., Ando, Y., Jevapatarakul, D., Chatterjee, A., Lin, Q. X. X., Buyamin, E. V., Sonthalia, R., Rajagopalan, D., et al. (2025) · Cell · doi:10.1016/j.cell.2025.02.017 · Cited by 85
Self-citationWang, X., Shen, X., Chen, S., Liu, H., Hong, N., Zhong, H., Chen, X. X., & Jin, W. (2021) · The Journal of Immunology · doi:10.4049/jimmunol.2100581 · Cited by 67
Schinke, C., Poos, A. M., Bauer, M., John, L., Johnson, S., Deshpande, S., Carrillo, L. F., Alapat, D. V., Rasche, L., Thanendrarajan, S., et al. (2022) · Blood Advances · doi:10.1182/bloodadvances.2022007217 · Cited by 67
Khalil, R., Diab‐Assaf, M., & Lemaître, J.-M. (2023) · Cells · doi:10.3390/cells12060915 · Cited by 68
Fei, Q., Pan, Y., Lin, W., Zhou, Y., Yu, X., Hou, Z., Yu, X., Lin, X., Lin, R., Lu, F., et al. (2020) · Cell Death and Disease · doi:10.1038/s41419-020-02787-1 · Cited by 60
Valkiers, S., de Vrij, N., Gielis, S., Verbandt, S., Ogunjimi, B., Laukens, K., & Meysman, P. (2022) · ImmunoInformatics · doi:10.1016/j.immuno.2022.100009 · Cited by 56
Age-associated CD4 + T cells with B cell–promoting functions are regulated by ZEB2 in autoimmunity
Goto, M., Takahashi, H., Yoshida, R., Itamiya, T., Nakano, M., Nagafuchi, Y., Harada, H., Shimizu, T., Maeda, M. H., Kubota, A., et al. (2024) · Science Immunology · doi:10.1126/sciimmunol.adk1643 · Cited by 59
Zuroff, L. R., Rezk, A., Shinoda, K., Espinoza, D. A., Elyahu, Y., Zhang, B., Chen, A. A., Shinohara, R. T., Jacobs, D. A., Alcalay, R. N., et al. (2022) · EBioMedicine · doi:10.1016/j.ebiom.2022.104179 · Cited by 63
Inflammageing, a targetable pathway for preventing cardiovascular diseases
Aranda, J. F., Ramírez, C. M., & Mittelbrunn, M. (2024) · Cardiovascular Research · doi:10.1093/cvr/cvae240 · Cited by 64
Roadmap for alleviating the manifestations of ageing in the cardiovascular system
Liberale, L., Tual-Chalot, S., Sedej, S., Ministrini, S., Georgiopoulos, G., Grunewald, M., Bäck, M., Bochaton-Piallat, M.-L., Boon, R. A., Ramos, G. C., et al. (2025) · Nature Reviews Cardiology · doi:10.1038/s41569-025-01130-5 · Cited by 59
T Cells: A Growing Universe of Roles in Neurodegenerative Diseases
Dressman, D., & Elyaman, W. (2021) · The Neuroscientist · doi:10.1177/10738584211024907 · Cited by 60
Single-cell immune profiling reveals functional diversity of T cells in tuberculous pleural effusion
Cai, Y., Wang, Y., Shi, C., Dai, Y., Li, F., Xu, Y., Zhang, P., Kong, F., Deng, G., Wen, Z., et al. (2022) · The Journal of Experimental Medicine · doi:10.1084/jem.20211777 · Cited by 56
Cytotoxic CD4+ T cells in chronic viral infections and cancer
Malyshkina, A., Brüggemann, A., Paschen, A., & Dittmer, U. (2023) · Frontiers in Immunology · doi:10.3389/fimmu.2023.1271236 · Cited by 56
Immunotherapy in older patients with cancer
Granier, C., Gey, A., Roncelin, S., Weiss, L., Paillaud, É., & Tartour, É. (2020) · Biomedical Journal · doi:10.1016/j.bj.2020.07.009 · Cited by 58
T-Cell Aging-Associated Phenotypes in Autoimmune Disease
Zhao, T. V., Sato, Y., Goronzy, J. J., & Weyand, C. M. (2022) · Frontiers in Aging · doi:10.3389/fragi.2022.867950 · Cited by 50
Arthur, L., Esaulova, E., Mogilenko, D. A., Tsurinov, P., Burdess, S., Laha, A., Presti, R. M., Goetz, B. D., Watson, M. A., Goss, C. W., et al. (2021) · Nature Aging · doi:10.1038/s43587-021-00067-x · Cited by 49
Zhou, L., Ge, M., Zhang, Y., Wu, X., Leng, M., Gan, C., Mou, Y., Zhou, J., Valencia, C. A., Hao, Q., et al. (2022) · Frontiers in Pharmacology · doi:10.3389/fphar.2022.877709 · Cited by 53
Immune surveillance of senescence: potential application to age-related diseases
Wang, T., & Nakanishi, M. (2024) · Trends in Cell Biology · doi:10.1016/j.tcb.2024.06.007 · Cited by 49
Ligotti, M. E., Aiello, A., Accardi, G., Aprile, S., Bonura, F., Bulati, M., Gervasi, F., Giammanco, G. M., Pojero, F., Zareian, N., et al. (2021) · Clinical & Experimental Immunology · doi:10.1111/cei.13606 · Cited by 45
Sun, P.-Y., Liu, J., Hu, J.-N., Tu, Y.-F., Jiang, Q., Jia, Y.-J., Sun, H.-L., Chen, S.-H., Xin, J.-Y., Yu, Z.-Y., et al. (2024) · Science Advances · doi:10.1126/sciadv.adl1123 · Cited by 46
T cell aging as a risk factor for autoimmunity
Liu, Q., Zheng, Y., Goronzy, J. J., & Weyand, C. M. (2022) · Journal of Autoimmunity · doi:10.1016/j.jaut.2022.102947 · Cited by 48
van de Sandt, C. E., Nguyen, T. H. O., Gherardin, N. A., Crawford, J. C., Samir, J., Minervina, A. A., Pogorelyy, M. V., Rizzetto, S., Szeto, C. W., Kaur, J., et al. (2023) · Nature Immunology · doi:10.1038/s41590-023-01633-8 · Cited by 47
Baker, K. F., McDonald, D., Hulme, G., Hussain, R., Coxhead, J., Swan, D. J., Schulz, A. R., Mei, H. E., MacDonald, L., Pratt, A. G., et al. (2024) · Nature Communications · doi:10.1038/s41467-024-45213-2 · Cited by 48
Ramello, M. C., Núñez, N. G., Tosello, J., Bossio, S., Canale, F. P., Abrate, C., Ponce, N. E., del Castillo, A., Ledesma, M., Viel, S., et al. (2021) · Frontiers in Immunology · doi:10.3389/fimmu.2021.713132 · Cited by 46
Weymar, G. H. J., Bar‐On, Y., Oliveira, T. Y., Gaebler, C., Ramos, V., Hartweger, H., Breton, G., Caskey, M. F., Cohn, L. B., Janković, M., et al. (2022) · Cell Reports · doi:10.1016/j.celrep.2022.111311 · Cited by 42
Tian, H., Xing, J., Tang, X., Chi, H., Sheng, X., & Zhan, W. (2022) · Marine Life Science & Technology · doi:10.1007/s42995-022-00136-z · Cited by 46
Crossing borders in Alzheimer’s disease: A T cell’s perspective
van Olst, L., Coenen, L., Nieuwland, J. M., Rodriguez-Mogeda, C., de Wit, N. M., Kamermans, A., Middeldorp, J., & de Vries, H. E. (2022) · Advanced Drug Delivery Reviews · doi:10.1016/j.addr.2022.114398 · Cited by 45
When Helpers Go Above and Beyond: Development and Characterization of Cytotoxic CD4+ T Cells
Hoeks, C., Duran, G., Hellings, N., & Broux, B. (2022) · Frontiers in Immunology · doi:10.3389/fimmu.2022.951900 · Cited by 40
Koga, R., Maehara, T., Aoyagi, R., Munemura, R., Murakami, Y., Doi, A., Kono, M., Yamamoto, H., Niiro, H., Kiyoshima, T., et al. (2023) · Journal of Allergy and Clinical Immunology · doi:10.1016/j.jaci.2023.11.916 · Cited by 43
Clonal hematopoiesis and its impact on the aging osteo-hematopoietic niche
Winter, S., Götze, K. S. S., Hecker, J. S., Metzeler, K. H., Guezguez, B., Woods, K., Medyouf, H., Schäffer, A., Schmitz, M., Wehner, R., et al. (2024) · Leukemia · doi:10.1038/s41375-024-02226-6 · Cited by 46
de Toda, I. M., Vida, C., Cerro, E. D., & la Fuente, M. D. (2021) · The Journals of Gerontology Series A · doi:10.1093/gerona/glab136 · Cited by 41
Direct and indirect immune effects of CMP-001, a virus-like particle containing a TLR9 agonist
Sabree, S. A., Voigt, A. P., Blackwell, S. E., Vishwakarma, A., Chimenti, M. S., Salem, A. K., & Weiner, G. J. (2021) · Journal for ImmunoTherapy of Cancer · doi:10.1136/jitc-2021-002484 · Cited by 40
Lo, J. W., Cozzetto, D., Alexander, J. L., Danckert, N. P., Madgwick, M., Knox, N., Sieh, J. Y. X., Olbei, M. L., Liu, Z., Ibraheim, H., et al. (2023) · Nature Communications · doi:10.1038/s41467-023-41798-2 · Cited by 43
CD7-deleted hematopoietic stem cells can restore immunity after CAR T cell therapy
Kim, M. Y., Cooper, M. L., Jacobs, M. T., Ritchey, J., Hollaway, J., Fehniger, T. A., & DiPersio, J. F. (2021) · JCI Insight · doi:10.1172/jci.insight.149819 · Cited by 40
CD29 Enriches for Cytotoxic Human CD4+ T Cells
Nicolet, B. P., Guislain, A., & Wolkers, M. C. (2021) · The Journal of Immunology · doi:10.4049/jimmunol.2100138 · Cited by 37
Terekhova, M., Boháčová, P., & Artyomov, M. N. (2025) · Immunity · doi:10.1016/j.immuni.2025.10.009 · Cited by 43
Glycyrrhizic Acid Improves Cognitive Levels of Aging Mice by Regulating T/B Cell Proliferation
Jiang, R., Gao, J., Shen, J., Zhu, X., Wang, H., Feng, S., Huang, C., Shen, H., & Liu, H. (2020) · Frontiers in Aging Neuroscience · doi:10.3389/fnagi.2020.570116 · Cited by 37
The Human Blood Transcriptome in a Large Population Cohort and Its Relation to Aging and Health
Schmidt, M., Hopp, L., Arakelyan, A., Kirsten, H., Engel, C., Wirkner, K., Krohn, K., Burkhardt, R., Thiery, J., Loeffler, M., et al. (2020) · Frontiers in Big Data · doi:10.3389/fdata.2020.548873 · Cited by 38
Hess, N. J., Turicek, D. P., Riendeau, J. M., McIlwain, S. J., Guzman, E. C., Nadiminti, K. V. G., Hudson, A. W., Callander, N. S., Skala, M. C., Gumperz, J. E., et al. (2023) · Science Advances · doi:10.1126/sciadv.adf0567 · Cited by 35
Early β‐amyloid accumulation in the brain is associated with peripheral T cell alterations
Gericke, C., Kirabali, T., Flury, R., Mallone, A., Rickenbach, C., Kulic, L., Toševski, V., Höck, C., Nitsch, R. M., Treyer, V., et al. (2023) · Alzheimer s & Dementia · doi:10.1002/alz.13136 · Cited by 35
An atlas of transcribed enhancers across helper T cell diversity for decoding human diseases
Oguchi, A., Suzuki, A., Komatsu, S., Yoshitomi, H., Bhagat, S., Son, R., Bonnal, R. J. P., Kojima, S., Koido, M., Takeuchi, K., et al. (2024) · Science · doi:10.1126/science.add8394 · Cited by 40
Self-citationChoi, S. M., Park, H. J., Choi, E. A., Jung, K. C., & Lee, J. I. (2021) · Scientific Reports · doi:10.1038/s41598-021-03013-4 · Cited by 34
Single-cell immune atlas for human aging and frailty
Leng, S. X., & Pawelec, G. (2022) · Life Medicine · doi:10.1093/lifemedi/lnac013 · Cited by 34
Staphylococcal phosphatidylglycerol antigens activate human T cells via CD1a
Monnot, G., Wegrecki, M., Cheng, T., Chen, Y., Sallee, B. N., Chakravarthy, R., Karantza, I. M., Tin, S. Y., Khaleel, A. E., Monga, I., et al. (2022) · Nature Immunology · doi:10.1038/s41590-022-01375-z · Cited by 35
Heterogeneity of memory T cells in aging
Jain, A. K., Sturmlechner, I., Weyand, C. M., & Goronzy, J. J. (2023) · Frontiers in Immunology · doi:10.3389/fimmu.2023.1250916 · Cited by 34
Genetic and phenotypic analysis of the causal relationship between aging and COVID-19
Ying, K., Zhai, R., Pyrkov, T. V., Shindyapina, A. V., Mariotti, M., Fedichev, P. O., Shen, X., & Gladyshev, V. N. (2021) · Communications Medicine · doi:10.1038/s43856-021-00033-z · Cited by 37
T cell aging and Alzheimer’s disease
Guo, L., Li, X., Gould, T. M., Wang, Z., & Cao, W. (2023) · Frontiers in Immunology · doi:10.3389/fimmu.2023.1154699 · Cited by 35
Ligotti, M. E., Accardi, G., Aiello, A., Aprile, S., Calabrò, A., Caldarella, R., Caruso, C., Ciaccio, M., Corsale, A. M., Dieli, F., et al. (2023) · Clinical & Experimental Immunology · doi:10.1093/cei/uxad074 · Cited by 31
T cell control of inflammaging
Shchukina, I., Boháčová, P., & Artyomov, M. N. (2023) · Seminars in Immunology · doi:10.1016/j.smim.2023.101818 · Cited by 32
Hu, C. (2025) · Ageing Research Reviews · doi:10.1016/j.arr.2025.102727 · Cited by 32
RetractedDeep neural network modeling identifies biomarkers of response to immune-checkpoint therapy
Kang, Y., Vijay, S., & Gujral, T. S. (2022) · iScience · doi:10.1016/j.isci.2022.104228 · Cited by 30
Deng, Y., Peng, Z., Ming, K., Qiao, X., Ye, B., Liu, Y., Wang, H., Yang, P., Zhang, Y., Zhou, K., et al. (2025) · Nature Aging · doi:10.1038/s43587-025-00990-3 · Cited by 33
Immunological biomarkers of aging
Wu, F., Mu, W., Markov, N. T., Fuentealba, M., Halaweh, H., Senchyna, F., Manwaring-Mueller, M., Winer, D. A., & Furman, D. (2025) · The Journal of Immunology · doi:10.1093/jimmun/vkae036 · Cited by 28
Aging reshapes the adaptive immune system from healer to saboteur
Delgado-Pulido, S., Yousefzadeh, M. J., & Mittelbrunn, M. (2025) · Nature Aging · doi:10.1038/s43587-025-00906-1 · Cited by 29
Karagiannis, T. T., Monti, S., & Sebastiani, P. (2022) · Frontiers in Genetics · doi:10.3389/fgene.2022.855076 · Cited by 26
Heterogeneity and clonality of kidney-infiltrating T cells in murine lupus nephritis
Smita, S., Chikina, M. D., Shlomchik, M. J., & Tilstra, J. S. (2022) · JCI Insight · doi:10.1172/jci.insight.156048 · Cited by 24
Tian, H., Xing, J., Tang, X., Sheng, X., Chi, H., & Zhan, W. (2023) · Aquaculture · doi:10.1016/j.aquaculture.2023.739238 · Cited by 23
Hernández-López, P., van Diest, E., Brázda, P., Heijhuurs, S., Meringa, A. D., Heyningen, L. H. V., Riillo, C., Schwenzel, C., Zintchenko, M., Johanna, I., et al. (2023) · Nature Immunology · doi:10.1038/s41590-023-01665-0 · Cited by 23
Metadata
- Authors
- Hashimoto, K., Kouno, T., Ikawa, T., Hayatsu, N., Miyajima, Y., Yabukami, H., Terooatea, T., Sasaki, T., Suzuki, T., Valentine, M., Pascarella, G., Okazaki, Y., Suzuki, H., Shin, J. W., Minoda, A., Taniuchi, I., Okano, H., Arai, Y., Hirose, N., & Carninci, P.
- Affiliations
- RIKEN Center for Integrative Medical Sciences (JP)
- Keio University (JP)
- Corresponding author
- Hirose, Nobuyoshi
- Carninci, Piero
- ORCID
- Venue
- Proceedings of the National Academy of Sciences
- Publisher
- National Academy of Sciences
- Published
- 2019-11-12
- Volume
- 116
- Issue
- 48
- Pages
- 24242-24251
- ISSN
- 0027-8424 (ISSN-L)
- 1091-6490
- PMC
- PMC6883788
- OpenAlex
- W2983248500
- Cited by
- 343
- References
- 51
- Citations by year
- 2026: 45 · 2025: 49 · 2024: 56 · 2023: 59 · 2022: 51 · 2021: 52 · 2020: 28 · 2019: 3
- FWCI
- 13.36
- Type
- journal article
- Language
- en
- Open access
- hybrid
- doi.org
- Licence
- Locations
- Proceedings of the National Academy of Sciences (publishedVersion, cc-by)
- bioRxiv (Cold Spring Harbor Laboratory) (acceptedVersion)
- PubMed Central (publishedVersion, cc-by)
- PubMed (publishedVersion)
- Funders
- Keio University
- Ministry of Education, Culture, Sports, Science and Technology
- Japan Society for the Promotion of Science (17H04214, 19KK0222, 17H04090, 19H05747, 19H04820, 18K19569)
- RIKEN
- Topics
- Life Sciences › Immunology and Microbiology › Immunology › T-cell and B-cell Immunology
- Life Sciences › Biochemistry, Genetics and Molecular Biology › Molecular Biology › Single-cell and spatial transcriptomics
- Life Sciences › Biochemistry, Genetics and Molecular Biology › Aging › Genetics, Aging, and Longevity in Model Organisms
- Keywords
- supercentenarians, healthy aging, cytotoxic CD4+ T cells, clonal expansion, T cell receptor repertoire, peripheral blood mononuclear cells, immunosenescence, longevity, interferon-gamma, TNF-α
- MeSH terms
- Adult, Aged, Aged, 80 and over, B-Lymphocytes, Cell Differentiation, Cells, Cultured, Humans, Interferon-gamma, Leukocytes, Mononuclear, Middle Aged, Tumor Necrosis Factor-alpha, CD4-Positive T-Lymphocytes, Case-Control Studies, Gene Expression Profiling, Single-Cell Analysis, Clonal Evolution
About these checks
Registry, retraction, Cites and statistics results are computed, not judged, with one exception: a printed reference that no index lists is read once by a model before it counts as a citation error. Claims are extracted by a model and kept only when their quote appears verbatim in the text; each cited source is then checked, with a model’s help, for whether it says what the claim relies on. Those verdicts can be wrong — read the claim’s quote and the cited source before relying on one.
Statistics and arithmetic are recomputed, not judged.
Confidence bands are shown only for fields calibrated on our annotated test set. None is calibrated yet, so no band is shown.
What counts as a claim ›How we measure confidence ›How we check this ›
Are you an author, or do you see a problem with this page? Request a review
