

Layer and rhythm specificity for predictive routing
Open accessPublished version of a preprint
The DOI matches its Crossref record; 82 of the 82 references it cites were found in a registry or an index; 51 of the 86 sources its claims cite were checked for support.
Abstract
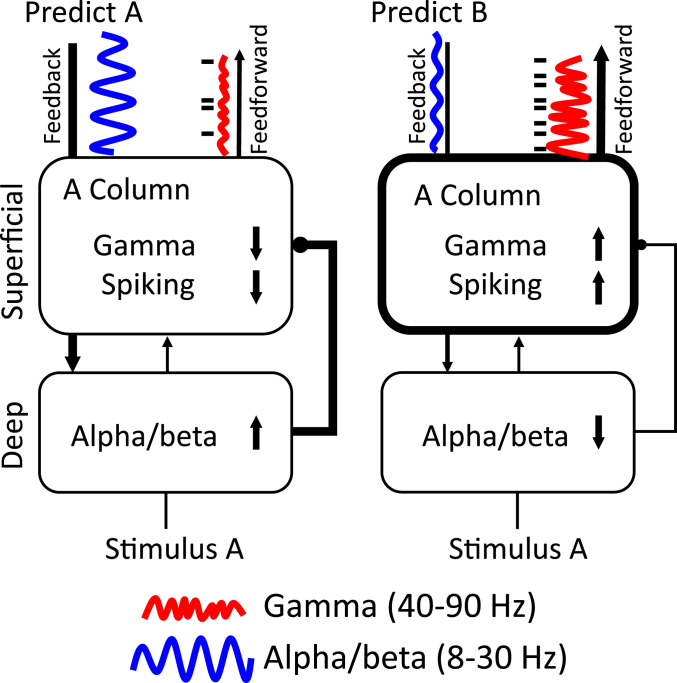
In predictive coding, experience generates predictions that attenuate the feeding forward of predicted stimuli while passing forward unpredicted "errors." Different models have suggested distinct cortical layers, and rhythms implement predictive coding. We recorded spikes and local field potentials from laminar electrodes in five cortical areas (visual area 4 [V4], lateral intraparietal [LIP], posterior parietal area 7A, frontal eye field [FEF], and prefrontal cortex [PFC]) while monkeys performed a task that modulated visual stimulus predictability. During predictable blocks, there was enhanced alpha (8 to 14 Hz) or beta (15 to 30 Hz) power in all areas during stimulus processing and prestimulus beta (15 to 30 Hz) functional connectivity in deep layers of PFC to the other areas. Unpredictable stimuli were associated with increases in spiking and in gamma-band (40 to 90 Hz) power/connectivity that fed forward up the cortical hierarchy via superficial-layer cortex. Power and spiking modulation by predictability was stimulus specific. Alpha/beta power in LIP, FEF, and PFC inhibited spiking in deep layers of V4. Area 7A uniquely showed increases in high-beta (∼22 to 28 Hz) power/connectivity to unpredictable stimuli. These results motivate a conceptual model, predictive routing. It suggests that predictive coding may be implemented via lower-frequency alpha/beta rhythms that "prepare" pathways processing-predicted inputs by inhibiting feedforward gamma rhythms and associated spiking.
Overview
CoChat Summary
## TL;DR
Monkeys performing a delayed match-to-sample task showed stronger spiking, gamma/theta activity, and feedforward interactions for unpredictable stimuli, while predictable stimuli were associated with stronger alpha/beta activity and feedback interactions. The effects were layer-specific and stimulus-specific, supporting the paper’s proposed “predictive routing” model rather than a specialized prediction-error circuit.
## Key findings
- In the task, performance was better for predictable than unpredictable blocks: accuracy was 80.6% vs. 74.2% across sessions, and reaction time was 236 ms vs. 239 ms (both significant; P < 1E-8 and P = 0.017, respectively).
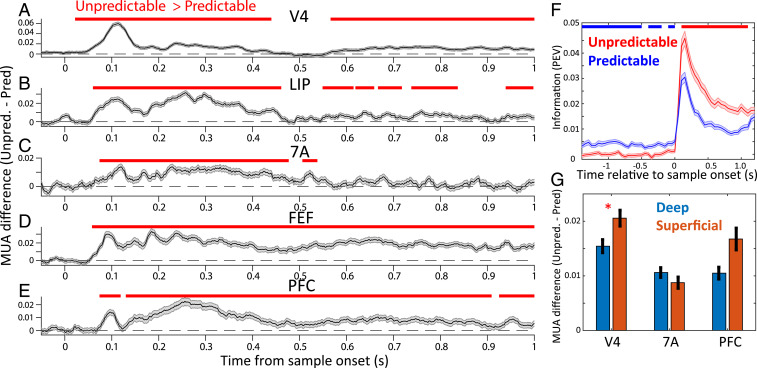
- During sample presentation, MUA/spiking was greater for unpredictable than predictable samples in all areas tested, and single-neuron information about sample identity was also greater for unpredictable samples (P < 0.05 cluster-based randomization).
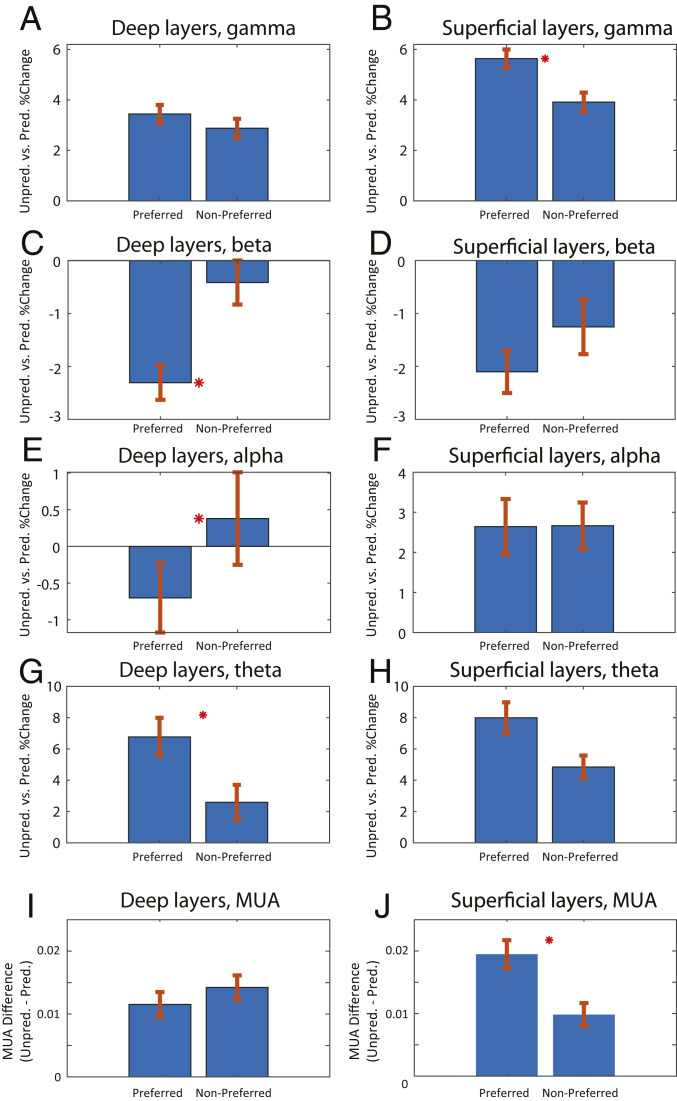
- Unpredictable samples increased gamma power (~40–90 Hz) in all areas, while predictable samples increased alpha/beta power (8–30 Hz); theta (~2–6 Hz) also tended to be higher for unpredictable samples except in FEF.
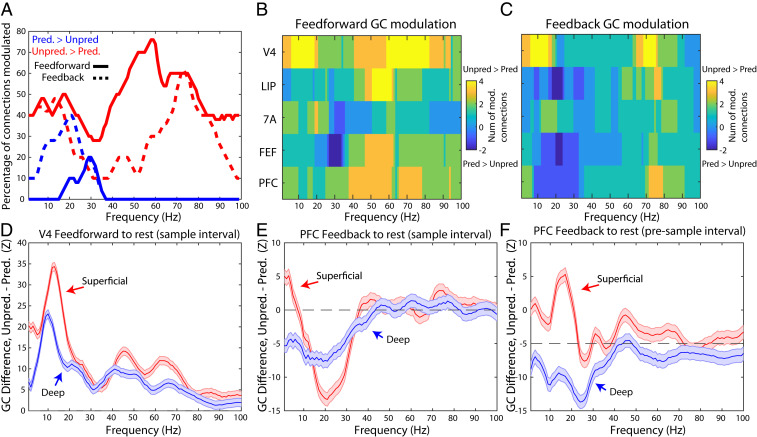
- Network measures matched the same split: feedforward GC was greater for unpredictable samples, especially in gamma, whereas feedback GC was greater for predictable samples, especially in alpha/beta; in the sample interval, 0.57 vs. 0.33 of gamma-band connections were positive in feedforward vs. feedback directions (P < 1E-13), and predictable > unpredictable GC was absent in gamma.
## Methods
- The study recorded multilaminar spiking and LFPs from two macaque monkeys over 71 sessions in five cortical areas: V4, LIP, 7A, FEF, and PFC; laminar resolution was obtained in V4, 7A, and PFC, but not in LIP and FEF.
- Monkeys performed a delayed match-to-sample / visual search task with 50-trial blocks that were either unpredictable (sample randomly chosen each trial) or predictable (same sample repeated across the block).
- Analyses included cluster-based randomization tests, coherence, nonparametric Granger causality, omega-squared neural information, and GLM regressions linking higher-order cortex power to V4 spiking/gamma.
## Limitations
- The paper states that the task did not explicitly manipulate precision weighting, and therefore the issue was not directly considered.
- The text makes evident that only two monkeys were studied and that layer-resolved recordings were not available in LIP and FEF; this limits how broadly the laminar conclusions can be generalized.
Model-written summary. Check it against the paper before relying on it.
Integrity signals
Registry
Cites
Statistics
Figures


Verification
Claims the paper makes
22 Valid · 0 Not valid · 7 Not checked · 141 Own results and interpretations
The cited sources support only part of this claim — read each source’s verdict below.
In the paper
“A key observation is that, all across cortex, gamma power (>35 Hz)/spiking is higher during bottom-up sensory inputs.”
§ Layer and rhythm specificity for predictive routing > Abstract
What the sources say
- Could not verifycites [26] sourceExperimental — accuracy not yet measured
The Results section reports that gamma bursts increased during the working-memory delay relative to baseline, and that gamma power peaked in superficial layers of the sampled frontal areas (page unavailable). Neither finding establishes higher gamma power or spiking during bottom-up sensory input across cortex. Searches for “bottom-up,” “sensory inputs,” and stimulus-onset comparisons found no passage making that claim. (LLM, conf=0.72)
- Partly supportedcites [27] sourceExperimental — accuracy not yet measured
In Results, Prediction 1 (page unavailable), gamma power increased after stimulus presentation at 126 of 321 recorded sites, and spiking at those sites carried stimulus information. But 61% of sites showed no significant stimulus-related gamma increase, so the findings do not support “all across cortex.” The passages also establish informative spiking, not a cortex-wide increase in spiking rate during sensory input. (LLM, conf=0.88)
- Supportedcites [28] source
The Results (Increase of Frequencies Up the Cortical Hierarchy; page unavailable) report that sensory-stimulus presentation increased gamma power in V4, LIP, and PFC. The Introduction and Discussion (pages unavailable) describe gamma as associated with sensory-information spiking and positively correlated with spiking across the studied cortical hierarchy. (LLM, conf=0.88)
- Partly supportedcites [29] sourceExperimental — accuracy not yet measured
The section “Beta in deep-layer cortex interacts with gamma in superficial-layer cortex” (page unavailable) says bottom-up gamma and informative spiking in sensory areas are typically elevated during sensory stimulation. But “Mechanisms of gamma/beta interplay” (page unavailable) distinguishes prefrontal cortex, where sensory drive has less impact and gamma can occur without a stimulus. The copy therefore supports the sensory-area pattern, not the unqualified claim that it holds all across cortex; the cited passages also do not establish the >35 Hz cutoff. (LLM, conf=0.85)
plainstates an association- Asserted: passes — The authors put it forward as true.
- Checkable: passes — It can be checked against evidence.
- Load-bearing: passes — The paper’s conclusions depend on it.
- Based: passes — The paper gives a reason why it holds.
- Could not verify
The sources with a verdict support this claim; the rest weren’t checked yet, have no full text we could read, or their verdicts aren’t rated yet.
In the paper
“Frontoparietal cortex was targeted because of its well-established role in top-down attention and working memory, cognitive processes that are engaged in the task employed here (30, 31).”
§ Layer and rhythm specificity for predictive routing > Abstract
What the sources say
- Supportedcites [30] source
The Results (p. 3) include frontal area 8/FEF and parietal area 7A in a visuospatial attention task, and the attention analysis (p. 7) reports stronger top-down influences during selective attention. The discussion (p. 9) also describes a short-term-memory task in which a condition requiring feedback increased prefrontal–parietal coherence. Together, these passages support the attributed background role; the citing authors’ own task is not assessed here. (LLM, conf=0.84)
- Not checked — no full text of the sourcecites [31] source
boostedstates an association- Asserted: passes — The authors put it forward as true.
- Checkable: passes — It can be checked against evidence.
- Load-bearing: passes — The paper’s conclusions depend on it.
- Based: passes — The paper gives a reason why it holds.
- Supported
The cited sources support only part of this claim — read each source’s verdict below.
In the paper
“But there is mounting evidence that oscillatory dynamics play a role in regulating cortical processing and thus can also play a role, especially the gamma (40 to 90 Hz) and alpha/beta (10 to 30 Hz) bands (1, 18–25).”
§ Layer and rhythm specificity for predictive routing > Abstract
What the sources say
- Partly supportedcites [1] sourceExperimental — accuracy not yet measured
The sections on predictive coding and gamma oscillations and on predictive timing and alpha/beta oscillations support a role for these rhythms in cortical sensory processing. The frequency ranges do not match those attributed to the source: our copy defines gamma as >30 Hz and alpha as 8–12 Hz, rather than gamma as 40–90 Hz and the combined alpha/beta bands as 10–30 Hz. No page numbers are available in our copy. (LLM, conf=0.83)
- Partly supportedcites [18] sourceExperimental — accuracy not yet measured
Section 3, “Canonical microcircuits and predictive coding” (page unavailable), links gamma oscillations to cortical synchronization and ascending connections, and alpha/beta activity to lower-frequency synchronization and descending connections. This supports a role for these bands in cortical processing, but our copy does not specify the claimed 40–90 Hz and 10–30 Hz ranges. (LLM, conf=0.86)
- Partly supportedcites [19] sourceExperimental — accuracy not yet measured
The Introduction and ‘Segregation of processing streams’ describe gamma oscillations in superficial cortical layers and lower alpha/beta frequencies in deep layers, and suggest that these frequencies contribute differently to cortical signalling. Our copy does not specify the claimed 40–90 Hz and 10–30 Hz ranges, so it supports the general point but not those numerical bounds. (LLM, conf=0.84)
- Partly supportedcites [20] sourceExperimental — accuracy not yet measured
The Introduction (page unavailable) describes distinct attentional effects of alpha/beta and gamma oscillations, supporting their relevance to cortical processing. Materials and Methods (page unavailable) analyzes low frequencies at 2.5–30 Hz and high frequencies at 40–150 Hz; it does not establish the claim’s specific 10–30 Hz and 40–90 Hz band ranges. (LLM, conf=0.82)
- Partly supportedcites [21] sourceExperimental — accuracy not yet measured
The Introduction links gamma-band activity to the propagation of prediction-error signals, and the high-gamma Results report effects in visual cortical areas. However, the paper uses different frequency ranges from those quoted and reports no significant effects in its beta, low-gamma, or mid-gamma ranges; it does not establish the claimed special role for alpha/beta activity. (LLM, conf=0.86)
- Not checked — no full text of the sourcecites [22] source
- Not checked — no full text of the sourcecites [23] source
- Not checked — no full text of the sourcecites [24] source
- Partly supportedcites [25] sourceExperimental — accuracy not yet measured
The Discussion links gamma-band activity to auditory prediction-error processing, supporting a role for oscillations in cortical processing. But the MEG data analysis section examines theta/alpha (5–12 Hz) and gamma (50–100 Hz), not the claimed alpha/beta (10–30 Hz) and gamma (40–90 Hz) ranges. Page numbers are unavailable in our copy. (LLM, conf=0.88)
hedgedstates a possible cause- Asserted: passes — The authors put it forward as true.
- Checkable: passes — It can be checked against evidence.
- Load-bearing: passes — The paper’s conclusions depend on it.
- Based: passes — The paper gives a reason why it holds.
- Partly supported
The cited sources support only part of this claim — read each source’s verdict below.
In the paper
“Direct evidence for alpha/beta and gamma in predictive coding per se comes from observations of increased gamma power to stimuli that are prediction errors (22, 24, 25).”
§ Layer and rhythm specificity for predictive routing > Abstract
What the sources say
- Not checked — no full text of the sourcecites [22] source
- Not checked — no full text of the sourcecites [24] source
- Partly supportedcites [25] sourceExperimental — accuracy not yet measured
The Results section ('Expectation of repetition reduces auditory activity for repeated tones') reports greater gamma-band power for unexpected than expected tone repetitions. The Discussion says this activity may signal a prediction-error response, but presents that interpretation as tentative; the cited passages do not establish an alpha/beta finding. (LLM, conf=0.84)
plainstates a cause- Asserted: passes — The authors put it forward as true.
- Checkable: passes — It can be checked against evidence.
- Load-bearing: passes — The paper’s conclusions depend on it.
- Based: passes — The paper gives a reason why it holds.
The sources with a verdict support this claim; the rest weren’t checked yet, have no full text we could read, or their verdicts aren’t rated yet.
In the paper
“In previous studies where stimulus repetition was not behaviorally relevant, gamma-band power and synchronization in visual cortex increased with repetition, whereas we observed decreases (48, 49).”
§ Layer and rhythm specificity for predictive routing > Discussion
What the sources say
- Supportedcites [48] source
The Results section (‘Stimulus Repetition Leads to Increasing Area V1 Gamma-Band Activity,’ page unavailable) reports increasing gamma-band power when the repeated grating was behaviorally irrelevant. The Discussion (page unavailable) also reports repetition-related increases in gamma activity in V1 and V4 and in V1–V4 gamma-band coherence. (LLM, conf=0.93)
- Not checked — no full text of the sourcecites [49] source
plainstates a cause- Asserted: passes — The authors put it forward as true.
- Checkable: passes — It can be checked against evidence.
- Load-bearing: passes — The paper’s conclusions depend on it.
- Based: passes — The paper gives a reason why it holds.
- Supported
115 more claims · 6 with their cited sources checked
Create a free account to see all 170 claims and every source verdict.
- Probably not a substantial claim. 13
- It may state two separate claims as one. 41
- The quote only partly states this claim. 1
Self-check
Percentages, sums and reported differences re-computed from the paper’s own numbers.
Rated major: it would touch a result — a value a result rests on, reported and recomputed p-values on opposite sides of the significance level, two passages that conflict with no sign which is right, or a cited work retracted before this paper was published.
In the paper
“The signal was then low-pass filtered at 250 Hz and resampled to 1,000 kHz.”
§ Layer and rhythm specificity for predictive routing > Discussion > Multiunit Activity Extraction and Spike Sorting.
Reported 1000000 · recomputed 33.333333
Citations
Cites
(2005) · Technometrics · doi:10.1198/tech.2005.s303 · Cited by 17,923
Oostenveld, R., Fries, P., Maris, E., & Schoffelen, J.-M. (2011) · Computational Intelligence and Neuroscience · doi:10.1155/2011/156869 · Cited by 10,323 · cited 1×
“All analyses were performed with customized MATLAB scripts and with Fieldtrip software (72).”
Nonparametric statistical testing of EEG- and MEG-data
Maris, E., & Oostenveld, R. (2007) · Journal of Neuroscience Methods · doi:10.1016/j.jneumeth.2007.03.024 · Cited by 8,496 · cited 1×
“We then quantified whether this raw difference or percent change was significant by performing a cluster-based nonparametric randomization test (78).”
The free-energy principle: a unified brain theory?
Friston, K. (2010) · Nature Reviews Neuroscience · doi:10.1038/nrn2787 · Cited by 8,120 · cited 4×
“Some propose that that prediction errors flow from higher to lower cortex only (Friston, 2010; Rao and Ballard, 1999) while others propose that prediction errors act locally within each cortical area or that predictions flow both up and down the cortical hierarchy (Spratling, 2008).”
BackgroundInfluentialDistributed hierarchical processing in the primate cerebral cortex
Felleman, D. J., & Van Essen, D. C. (1991) · Cerebral Cortex · doi:10.1093/cercor/1.1.1 · Cited by 7,783 · cited 8×
“Alpha/beta power in LIP, FEF, and PFC inhibited spiking in deep layers of V4.”
InfluentialRao, R. P. N., & Ballard, D. H. (1999) · Nature Neuroscience · doi:10.1038/4580 · Cited by 5,483 · cited 1×
“Other models (12, 14) instead suggest that predictions come from higher cortical areas that act on lower cortical (sensory) areas to gate the feeding forward of prediction errors.”
Draper, N. R., & Smith, H. (1998) · Wiley Series in Probability and Statistics · doi:10.1002/9781118625590 · Cited by 5,024 · cited 1×
“We used a GLM with higher-order power (which had laminar resolution in PFC and 7A) as the regressors (77).”
Modulation of Oscillatory Neuronal Synchronization by Selective Visual Attention
Fries, P., Reynolds, J. H., Rorie, A. E., & Desimone, R. (2001) · Science · doi:10.1126/science.1055465 · Cited by 2,786 · cited 1×
“Area V4 was selected as previous studies have shown this area to be a target of top-down signals such as attention (43, 44).”
Rhythms for cognition: communication through coherence
Fries, P. (2015) · Neuron · doi:10.1016/j.neuron.2015.09.034 · Cited by 2,725 · cited 1×
“They suggest that modulation of interareal synchronization at distinct frequencies is a central mechanism in communicating specific (predicted vs. unpredicted) information (65 – 68).”
High Gamma Power Is Phase-Locked to Theta Oscillations in Human Neocortex
Canolty, R. T., Edwards, E., Dalal, S. S., Soltani, M., Nagarajan, S. S., Kirsch, H. E., Berger, M. S., Barbaro, N. M., & Knight, R. T. (2006) · Science · doi:10.1126/science.1128115 · Cited by 2,650 · cited 1×
“However, theta is well known to be a slow rhythm in which faster rhythms such as gamma, can nest (60 – 62) and aid long-range communication (63).”
Cited by
Imagined speech can be decoded from low- and cross-frequency intracranial EEG features
Proix, T., Delgado Saa, J., Christen, A., Martin, S., Pasley, B. N., Knight, R. T., Tian, X., Poeppel, D., Doyle, W. K., Devinsky, O., et al. (2022) · Nature Communications · doi:10.1038/s41467-021-27725-3 · Cited by 212
Neural effects of propofol-induced unconsciousness and its reversal using thalamic stimulation
Bastos, A. M., Donoghue, J. A., Brincat, S. L., Mahnke, M., Yanar, J., Correa, J., Waite, A. S., Lundqvist, M., Roy, J., Brown, E. N., et al. (2021) · eLife · doi:10.7554/elife.60824 · Cited by 166
“With MRI guidance, we introduced the probes to be perpendicular to cortex and to span all cortical layers, as previously described (Bastos et al., 2020).”
MethodSelf-citationPrinciples of large-scale neural interactions
Vinck, M., Uran, C., Spyropoulos, G., Onorato, I., Broggini, A. C., Schneider, M., & Canales-Johnson, A. (2023) · Neuron · doi:10.1016/j.neuron.2023.03.015 · Cited by 164
Lundqvist, M., Miller, E. K., Nordmark, J., Liljefors, J., & Herman, P. (2024) · Trends in Cognitive Sciences · doi:10.1016/j.tics.2024.03.010 · Cited by 169
Self-citationTraveling waves in the prefrontal cortex during working memory
Bhattacharya, S., Brincat, S. L., Lundqvist, M., & Miller, E. K. (2022) · PLoS Computational Biology · doi:10.1371/journal.pcbi.1009827 · Cited by 136
Self-citation
Metadata
- Authors
- Bastos, A. M., Lundqvist, M., Waite, A. S., Kopell, N., & Miller, E. K.
- Affiliations
- Massachusetts Institute of Technology (US)
- Stockholm University (SE)
- Boston University (US)
- Corresponding author
- Bastos, André M.
- Kopell, Nancy
- Venue
- Proceedings of the National Academy of Sciences
- Publisher
- National Academy of Sciences
- Published
- 2020-11-23
- Volume
- 117
- Issue
- 49
- Pages
- 31459-31469
- ISSN
- 0027-8424 (ISSN-L)
- 1091-6490
- PMC
- PMC7733827
- OpenAlex
- W3109215284
- Cited by
- 268
- References
- 82
- Citations by year
- 2026: 40 · 2025: 62 · 2024: 59 · 2023: 52 · 2022: 34 · 2021: 17 · 2020: 4
- FWCI
- 14.38
- Type
- journal article
- Language
- en
- Open access
- hybrid
- doi.org
- Licence
- Locations
- Proceedings of the National Academy of Sciences (publishedVersion, cc-by-nc-nd)
- PubMed Central (publishedVersion, cc-by-nc-nd)
- PubMed (publishedVersion)
- OpenBU (Boston University) (publishedVersion, cc-by-nc-nd)
- Funders
- HHS | NIH | National Institute of Mental Health (R37MH087027, 5K99MH116100-02)
- DOD | United States Navy | Office of Naval Research (N00014-16-1-2832)
- Topics
- Life Sciences › Neuroscience › Cognitive Neuroscience › Neural dynamics and brain function
- Life Sciences › Neuroscience › Cognitive Neuroscience › Visual perception and processing mechanisms
- Life Sciences › Neuroscience › Cellular and Molecular Neuroscience › Neuroscience and Neuropharmacology Research
- Keywords
- predictive coding, predictive routing, cortical layers, neural oscillations, alpha rhythm, beta oscillations, gamma oscillations, feedforward inhibition, functional connectivity, area V4, lateral intraparietal area, frontal eye field, prefrontal cortex, laminar recordings, cortical hierarchy
- MeSH terms
- Action Potentials, Algorithms, Animals, Behavior, Animal, Macaca mulatta, Models, Neurological, Nerve Net, Neurons, Task Performance and Analysis, Time Factors, Gamma Rhythm
About these checks
Registry, retraction, Cites and statistics results are computed, not judged, with one exception: a printed reference that no index lists is read once by a model before it counts as a citation error. Claims are extracted by a model and kept only when their quote appears verbatim in the text; each cited source is then checked, with a model’s help, for whether it says what the claim relies on. Those verdicts can be wrong — read the claim’s quote and the cited source before relying on one.
The claim verdicts this report counts are experimental: their accuracy is not yet measured.
A language model drew the claims from the paper on 2026-10-11, under version 3 of the claim definition (model deepseek-v4.1-flash, prompt extract-v3).
A second model labelled each claim on 2026-10-11 (model jev-1.13-20260917, definition revision gold-guideline-v0.2).
Cited sources are checked with a language model’s help (gpt-6-sol).
Statistics and arithmetic are recomputed, not judged.
Confidence bands are shown only for fields calibrated on our annotated test set. None is calibrated yet, so no band is shown.
What counts as a claim ›How we measure confidence ›How we check this ›
Are you an author, or do you see a problem with this page? Request a review
How to cite
Cite CoChat for the checks on this page, and the paper for its own findings.
- This page
- CoChat. (2026). Citation check: Layer and rhythm specificity for predictive routing. https://app.cochat.ai/papers/10.1073/pnas.2014868117
- The paper
- Bastos, A. M., Lundqvist, M., Waite, A. S., Kopell, N., & Miller, E. K. (2020). Layer and rhythm specificity for predictive routing. Proceedings of the National Academy of Sciences. https://doi.org/10.1073/pnas.2014868117
Data sources
Bibliographic data: Semantic Scholar, OpenAlex, Crossref.
Contains information from the Semantic Scholar Academic Graph Datasets, made available under the ODC Attribution License (ODC-BY 1.0).
Semantic Scholar’s data is described in: Kinney, R., et al. (2023). The Semantic Scholar Open Data Platform. arXiv:2301.10140.
