

Biological structure and function emerge from scaling unsupervised learning to 250 million protein sequences
Open accessPublished version of a preprint
The DOI matches its Crossref record; 120 of the 120 references it cites were found in a registry or an index.
Abstract
Significance: Learning biological properties from sequence data is a logical step toward generative and predictive artificial intelligence for biology. Here, we propose scaling a deep contextual language model with unsupervised learning to sequences spanning evolutionary diversity. We find that without prior knowledge, information emerges in the learned representations on fundamental properties of proteins such as secondary structure, contacts, and biological activity. We show the learned representations are useful across benchmarks for remote homology detection, prediction of secondary structure, long-range residue–residue contacts, and mutational effect. Unsupervised representation learning enables state-of-the-art supervised prediction of mutational effect and secondary structure and improves state-of-the-art features for long-range contact prediction.
Overview
The claims and statistics of this paper haven’t been checked yet.
Free: it reads the open-access text and checks the first 5 claims that cite a source we can check. Create a free account to check every claim.
Integrity signals
Registry
Cites
Statistics
Figures

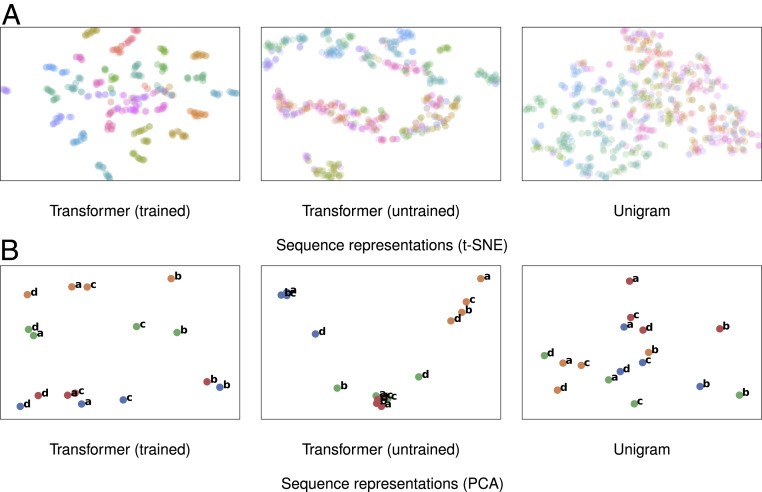
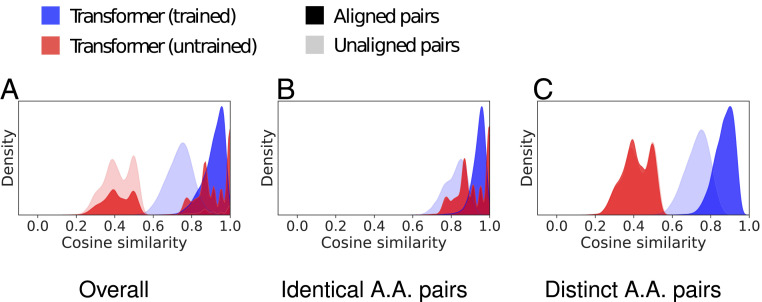


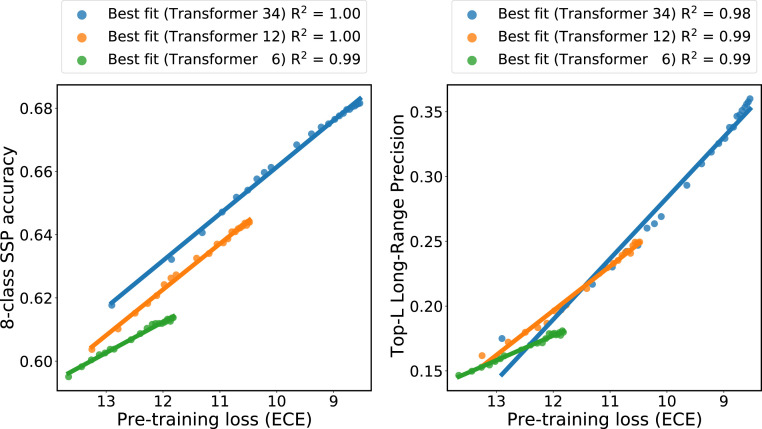
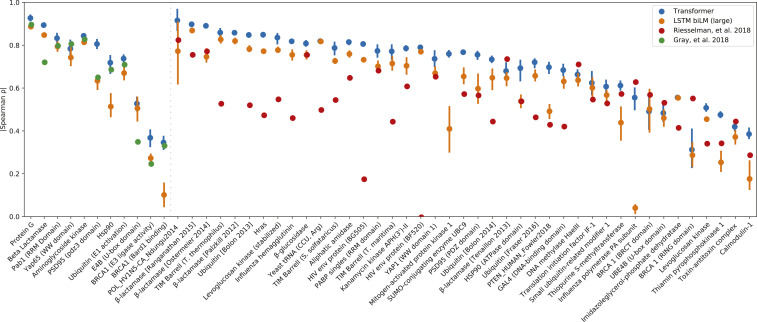
Verification
Claims the paper makes
The claims and statistics of this paper haven’t been checked yet.
Free: it reads the open-access text and checks the first 5 claims that cite a source we can check. Create a free account to check every claim.
Claims other papers make about this one
Each is checked against this paper’s own text: does it say what the citing paper says it does?
The source backs part of the claim, not all of it — or backs it for a different population, condition or comparison.
In the citing paper
“The current state-of-the-art in sequence-based modeling is the use of AI/ML embeddings pretrained on multimillion-scale protein collections.118”
From Advancing Targeted Protein Degradation via Multiomics Profiling and Artificial Intelligence (2023) · cites this paper as [118]
Experimental — accuracy not yet measuredThe source backs part of the claim, not all of it — or backs it for a different population, condition or comparison.
In the citing paper
“Since then, various language model-based protein embedding methods have been applied to these and other protein prediction problems through transfer learning, including protein phenotype prediction 28,32-34, residue-residue contact prediction 32,70, fold recognition 33, protein-protein 71,72 and protein-drug interaction prediction 35,73.”
From Learning the protein language: Evolution, structure, and function (2021) · cites this paper as [32]
Experimental — accuracy not yet measuredThe source backs part of the claim, not all of it — or backs it for a different population, condition or comparison.
In the citing paper
“It has been shown that the resulting representations contain rich information about the structure and the function of the proteins 17 , 32 , 33 .”
From Turnover number predictions for kinetically uncharacterized enzymes using machine and deep learning (2023) · cites this paper as [17]
Experimental — accuracy not yet measuredThe source backs part of the claim, not all of it — or backs it for a different population, condition or comparison.
In the citing paper
“the evolutionary scale modeling (ESM) family (Rives et al. 2021), comprising transformer protein language models such as ESM-2 and ESMFold, surpasses earlier single-sequence protein language models, demonstrating enhanced capability in generating accurate structure predictions based on protein sequences.”
From Large language models (LLMs): survey, technical frameworks, and future challenges (2024) · cites this paper as Rives et al. 2021
Experimental — accuracy not yet measuredThe cited source says what the claim attributes to it.
In the citing paper
“New work has since shown that the representations learned by language models are also powerful features for learning of variant fitness as a subsequent supervised learning task 32,34, building on earlier observations that language models can improve protein property prediction through transfer learning 27.”
From Learning the protein language: Evolution, structure, and function (2021) · cites this paper as [32]
7 more claims about this paper
Create a free account to see every claim other papers make about this one.
Self-check
Percentages, sums and reported differences re-computed from the paper’s own numbers.
The self-check needs the paper’s full text.
Citations
Cites
Vaswani, A., Shazeer, N., Parmar, N., Uszkoreit, J., Jones, L., Gomez, A. N., Kaiser, L., & Polosukhin, I. (2017) · arXiv · doi:10.48550/arxiv.1706.03762 · Cited by 120,404
Hochreiter, S., & Schmidhuber, J. (1997) · Neural Computation · doi:10.1162/neco.1997.9.8.1735 · Cited by 102,318
Basic local alignment search tool
Altschul, S. F., Gish, W., Miller, W., Myers, E. W., & Lipman, D. J. (1990) · Journal of Molecular Biology · doi:10.1006/jmbi.1990.9999 · Cited by 98,669
BERT: Pre-training of Deep Bidirectional Transformers for Language Understanding
Devlin, J., Chang, M.-W., Lee, K., & Toutanova, K. (2018) · arXiv · doi:10.48550/arxiv.1810.04805 · Cited by 73,173
BERT: Pre-training of Deep Bidirectional Transformers for Language Understanding
Devlin, J., Chang, M.-W., Lee, K., & Toutanova, K. (2019) · Proceedings of the 2019 Conference of the North American Chapter of the Association for Computational Linguistics: Human Language Technologies, Volume 1 (Long and Short Papers) · doi:10.18653/v1/n19-1423 · Cited by 54,325
(2008) · Journal of Machine Learning Research · Cited by 33,051
Efficient Estimation of Word Representations in Vector Space
Mikolov, T., Chen, K., Corrado, G., & Dean, J. (2013) · arXiv · doi:10.48550/arxiv.1301.3781 · Cited by 26,568
Distributed Representations of Words and Phrases and their Compositionality
Mikolov, T., Sutskever, I., Chen, K., Corrado, G., & Dean, J. (2013) · arXiv · doi:10.48550/arxiv.1310.4546 · Cited by 24,533
Reducing the dimensionality of data with neural networks
Hinton, G. E., & Salakhutdinov, R. R. (2006) · Science · doi:10.1126/science.1127647 · Cited by 20,928
Kabsch, W., & Sander, C. (1983) · Biopolymers · doi:10.1002/bip.360221211 · Cited by 15,320
Advances in Neural Information Processing Systems 29
Teymur, O., Zygalakis, K., & Calderhead, B. (2016) · Cited by 13,887
Decoupled Weight Decay Regularization
Loshchilov, I., & Hutter, F. (2017) · arXiv · doi:10.48550/arxiv.1711.05101 · Cited by 12,522
Deep Contextualized Word Representations
Peters, M., Neumann, M., Iyyer, M., Gardner, M., Clark, C., Lee, K., & Zettlemoyer, L. (2018) · Proceedings of the 2018 Conference of the North American Chapter of the Association for Computational Linguistics: Human Language Technologies, Volume 1 (Long Papers) · doi:10.18653/v1/n18-1202 · Cited by 11,983
Identity mappings in deep residual networks
He, K., Zhang, X., Ren, S., & Sun, J. (2016) · Lecture Notes in Computer Science · doi:10.1007/978-3-319-46493-0_38 · Cited by 10,741
Identity Mappings in Deep Residual Networks
He, K., Zhang, X., Ren, S., & Sun, J. (2016) · arXiv · doi:10.48550/arxiv.1603.05027 · Cited by 10,665
Analysis of protein-coding genetic variation in 60,706 humans
Exome Aggregation Consortium, Lek, M., Karczewski, K. J., Minikel, E. V., Samocha, K. E., Banks, E., Fennell, T., O’Donnell-Luria, A. H., Ware, J. S., Hill, A. J., et al. (2016) · Nature · doi:10.1038/nature19057 · Cited by 9,587
The mutational constraint spectrum quantified from variation in 141,456 humans
Karczewski, K. J., Francioli, L. C., Tiao, G., Cummings, B. B., Alföldi, J., Wang, Q., Collins, R. L., Laricchia, K. M., Ganna, A., Birnbaum, D. P., et al. (2020) · Nature · doi:10.1038/s41586-020-2308-7 · Cited by 9,434
The UK Biobank resource with deep phenotyping and genomic data
Bycroft, C., Freeman, C., Petkova, D., Band, G., Elliott, L. T., Sharp, K., Motyer, A., Vukcevic, D., Delaneau, O., O’Connell, J., et al. (2018) · Nature · doi:10.1038/s41586-018-0579-z · Cited by 8,876
Kumar, P., Henikoff, S., & Ng, P. C. (2009) · Nature Protocols · doi:10.1038/nprot.2009.86 · Cited by 6,521
Pfam: the protein families database
Finn, R. D., Bateman, A., Clements, J., Coggill, P., Eberhardt, R. Y., Eddy, S. R., Heger, A., Hetherington, K., Holm, L., Mistry, J., et al. (2014) · Nucleic Acids Research · doi:10.1093/nar/gkt1223 · Cited by 6,148
Eddy, S. R. (1998) · Bioinformatics · doi:10.1093/bioinformatics/14.9.755 · Cited by 5,515
A unified architecture for natural language processing: deep neural networks with multitask learning
Collobert, R., & Weston, J. (2008) · Proceedings of the 25th international conference on Machine learning - ICML '08 · doi:10.1145/1390156.1390177 · Cited by 5,058
Huerta-Cepas, J., Szklarczyk, D., Heller, D., Hernández-Plaza, A., Forslund, S. K., Cook, H., Mende, D. R., Letunic, I., Rattei, T., Jensen, L. J., et al. (2019) · Nucleic Acids Research · doi:10.1093/nar/gky1085 · Cited by 4,902
MMseqs2 enables sensitive protein sequence searching for the analysis of massive data sets
Steinegger, M., & Söding, J. (2017) · Nature Biotechnology · doi:10.1038/nbt.3988 · Cited by 4,840
Harris, Z. S. (1954) · WORD · doi:10.1080/00437956.1954.11659520 · Cited by 4,807
Billion-scale similarity search with GPUs
Johnson, J., Douze, M., & Jegou, H. (2021) · IEEE Transactions on Big Data · doi:10.1109/tbdata.2019.2921572 · Cited by 4,228
Billion-scale similarity search with GPUs
Johnson, J., Douze, M., & Jégou, H. (2017) · arXiv · doi:10.48550/arxiv.1702.08734 · Cited by 4,140
The Universal Protein Resource (UniProt)
Bairoch, A. (2004) · Nucleic Acids Research · doi:10.1093/nar/gki070 · Cited by 3,774
Predicting Functional Effect of Human Missense Mutations Using PolyPhen‐2
Adzhubei, I., Jordan, D. M., & Sunyaev, S. R. (2013) · Current Protocols in Human Genetics · doi:10.1002/0471142905.hg0720s76 · Cited by 3,705
CADD: predicting the deleteriousness of variants throughout the human genome
Rentzsch, P., Witten, D., Cooper, G. M., Shendure, J., & Kircher, M. (2019) · Nucleic Acids Research · doi:10.1093/nar/gky1016 · Cited by 3,534
A Neural Probabilistic Language Model
Bengio, Y., Ducharme, R., Vincent, P., Jauvin, C., Jaz, K., Hofmann, T., Poggio, T., & Shawe-Taylor, J. S. (2000) · Cited by 3,479
Improved protein structure prediction using potentials from deep learning
Senior, A. W., Evans, R., Jumper, J., Kirkpatrick, J., Sifre, L., Green, T., Qin, C., Žídek, A., Nelson, A. W. R., Bridgland, A., et al. (2020) · Nature · doi:10.1038/s41586-019-1923-7 · Cited by 3,378
Rives, A., Meier, J., Sercu, T., Goyal, S., Lin, Z., Liu, J., Guo, D., Ott, M., Zitnick, C. L., Ma, J., et al. (2019) · doi:10.1101/622803 · Cited by 3,280
Self-citationA neural probabilistic language model
BengioYoshua, DucharmeRéjean, VincentPascal, & JanvinChristian (2003) · Journal of Machine Learning Research · doi:10.5555/944919.944966 · Cited by 2,644
Rationally engineered Cas9 nucleases with improved specificity
Slaymaker, I. M., Gao, L., Zetsche, B., Scott, D. A., Yan, W. X., & Zhang, F. (2016) · Science · doi:10.1126/science.aad5227 · Cited by 2,414
fairseq: A Fast, Extensible Toolkit for Sequence Modeling
Ott, M., Edunov, S., Baevski, A., Fan, A., Gross, S., Ng, N., Grangier, D., & Auli, M. (2019) · Proceedings of the 2019 Conference of the North · doi:10.18653/v1/n19-4009 · Cited by 2,344
Self-citationHHblits: lightning-fast iterative protein sequence searching by HMM-HMM alignment
Remmert, M., Biegert, A., Hauser, A., & Söding, J. (2012) · Nature Methods · doi:10.1038/nmeth.1818 · Cited by 2,288
What is the best multi-stage architecture for object recognition?
Jarrett, K., Kavukcuoglu, K., Ranzato, M. A., & LeCun, Y. (2009) · 2009 IEEE 12th International Conference on Computer Vision · doi:10.1109/iccv.2009.5459469 · Cited by 2,153
UniRef clusters: a comprehensive and scalable alternative for improving sequence similarity searches
Suzek, B. E., Wang, Y., Huang, H., McGarvey, P. B., Wu, C. H., & the UniProt Consortium (2015) · Bioinformatics · doi:10.1093/bioinformatics/btu739 · Cited by 1,928
UniRef: comprehensive and non-redundant UniProt reference clusters
Suzek, B. E., Huang, H., McGarvey, P., Mazumder, R., & Wu, C. H. (2007) · Bioinformatics · doi:10.1093/bioinformatics/btm098 · Cited by 1,613
Evolved Cas9 variants with broad PAM compatibility and high DNA specificity
Hu, J. H., Miller, S. M., Geurts, M. H., Tang, W., Chen, L., Sun, N., Zeina, C. M., Gao, X., Rees, H. A., Lin, Z., et al. (2018) · Nature · doi:10.1038/nature26155 · Cited by 1,552
Self-citationCharacter-Aware Neural Language Models
Kim, Y., Jernite, Y., Sontag, D., & Rush, A. M. (2015) · arXiv · doi:10.48550/arxiv.1508.06615 · Cited by 1,530
Character-Aware Neural Language Models
Kim, Y., Jernite, Y., Sontag, D., & Rush, A. (2016) · Proceedings of the AAAI Conference on Artificial Intelligence · doi:10.1609/aaai.v30i1.10362 · Cited by 1,491
Morcos, F., Pagnani, A., Lunt, B., Bertolino, A., Marks, D. S., Sander, C., Zecchina, R., Onuchic, J. N., Hwa, T., & Weigt, M. (2011) · Proceedings of the National Academy of Sciences · doi:10.1073/pnas.1111471108 · Cited by 1,434
García-Alonso, C. R., Pérez-Naranjo, L. M., & Fernández-Caballero, J. C. (2014) · Annals of Operations Research · doi:10.1007/s10479-011-0841-3 · Cited by 1,353
A series of PDB related databases for everyday needs
Joosten, R. P., te Beek, T. A. H., Krieger, E., Hekkelman, M. L., Hooft, R. W. W., Schneider, R., Sander, C., & Vriend, G. (2011) · Nucleic Acids Research · doi:10.1093/nar/gkq1105 · Cited by 1,293
Deep mutational scanning: a new style of protein science
Fowler, D. M., & Fields, S. (2014) · Nature Methods · doi:10.1038/nmeth.3027 · Cited by 1,287
HH-suite3 for fast remote homology detection and deep protein annotation
Steinegger, M., Meier, M., Mirdita, M., Vöhringer, H., Haunsberger, S. J., & Söding, J. (2019) · BMC Bioinformatics · doi:10.1186/s12859-019-3019-7 · Cited by 1,145
Protein 3D Structure Computed from Evolutionary Sequence Variation
Marks, D. S., Colwell, L. J., Sheridan, R., Hopf, T. A., Pagnani, A., Zecchina, R., & Sander, C. (2011) · PLoS ONE · doi:10.1371/journal.pone.0028766 · Cited by 1,144
Unified rational protein engineering with sequence-based deep representation learning
Alley, E. C., Khimulya, G., Biswas, S., AlQuraishi, M., & Church, G. M. (2019) · Nature Methods · doi:10.1038/s41592-019-0598-1 · Cited by 1,131
Machine-learning-guided directed evolution for protein engineering
Yang, K. K., Wu, Z., & Arnold, F. H. (2019) · Nature Methods · doi:10.1038/s41592-019-0496-6 · Cited by 1,130
Generating Long Sequences with Sparse Transformers
Child, R., Gray, S., Radford, A., & Sutskever, I. (2019) · arXiv · doi:10.48550/arxiv.1904.10509 · Cited by 1,063
Identification of direct residue contacts in protein–protein interaction by message passing
Weigt, M., White, R. A., Szurmant, H., Hoch, J. A., & Hwa, T. (2009) · Proceedings of the National Academy of Sciences · doi:10.1073/pnas.0805923106 · Cited by 1,025
Semi-supervised Sequence Learning
Dai, A. M., & Le, Q. V. (2015) · arXiv · doi:10.48550/arxiv.1511.01432 · Cited by 994
Accurate De Novo Prediction of Protein Contact Map by Ultra-Deep Learning Model
Wang, S., Sun, S., Li, Z., Zhang, R., & Xu, J. (2017) · PLOS Computational Biology · doi:10.1371/journal.pcbi.1005324 · Cited by 931
Correlated mutations and residue contacts in proteins
Göbel, U., Sander, C., Schneider, R., & Valencia, A. (1994) · Proteins Structure Function and Bioinformatics · doi:10.1002/prot.340180402 · Cited by 863
The Universal Protein Resource (UniProt)
The UniProt Consortium (2007) · Nucleic Acids Research · doi:10.1093/nar/gkm895 · Cited by 823
Mutation effects predicted from sequence co-variation
Hopf, T. A., Ingraham, J. B., Poelwijk, F. J., Schärfe, C. P. I., Springer, M., Sander, C., & Marks, D. S. (2017) · Nature Biotechnology · doi:10.1038/nbt.3769 · Cited by 775
Jones, D. T., Buchan, D. W. A., Cozzetto, D., & Pontil, M. (2012) · Bioinformatics · doi:10.1093/bioinformatics/btr638 · Cited by 770
Fox, N. K., Brenner, S. E., & Chandonia, J.-M. (2014) · Nucleic Acids Research · doi:10.1093/nar/gkt1240 · Cited by 762
Uniclust databases of clustered and deeply annotated protein sequences and alignments
Mirdita, M., von den Driesch, L., Galiez, C., Martin, M. J., Söding, J., & Steinegger, M. (2017) · Nucleic Acids Research · doi:10.1093/nar/gkw1081 · Cited by 759
Evaluating Protein Transfer Learning with TAPE
Rao, R., Bhattacharya, N., Thomas, N., Duan, Y., Chen, X., Canny, J., Abbeel, P., & Song, Y. S. (2019) · doi:10.1101/676825 · Cited by 719
Iterated profile searches with PSI-BLAST—a tool for discovery in protein databases
Altschul, S. F., & Koonin, E. V. (1998) · Trends in Biochemical Sciences · doi:10.1016/s0968-0004(98)01298-5 · Cited by 680
Evaluation and improvement of multiple sequence methods for protein secondary structure prediction
Cuff, J. A., & Barton, G. J. (1999) · Proteins: Structure, Function, and Genetics · doi:10.1002/(sici)1097-0134(19990301)34:4<508::aid-prot10>3.0.co;2-4 · Cited by 667
Improved contact prediction in proteins: using pseudolikelihoods to infer Potts models
Ekeberg, M., Lövkvist, C., Lan, Y., Weigt, M., & Aurell, E. (2013) · Physical Review E · doi:10.1103/physreve.87.012707 · Cited by 661
Conformational preferences of amino acids in globular proteins
Levitt, M. (1978) · Biochemistry · doi:10.1021/bi00613a026 · Cited by 653
Modeling aspects of the language of life through transfer-learning protein sequences
Heinzinger, M., Elnaggar, A., Wang, Y., Dallago, C., Nechaev, D., Matthes, F., & Rost, B. (2019) · BMC Bioinformatics · doi:10.1186/s12859-019-3220-8 · Cited by 606
Modeling the language of life – Deep Learning Protein Sequences
Heinzinger, M., Elnaggar, A., Wang, Y., Dallago, C., Nechaev, D., Matthes, F., & Rost, B. (2019) · doi:10.1101/614313 · Cited by 606
Deep generative models of genetic variation capture the effects of mutations
Riesselman, A. J., Ingraham, J. B., & Marks, D. S. (2018) · Nature Methods · doi:10.1038/s41592-018-0138-4 · Cited by 601
Unsupervised Machine Translation Using Monolingual Corpora Only
Lample, G., Conneau, A., Denoyer, L., & Ranzato, M. (2017) · arXiv · doi:10.48550/arxiv.1711.00043 · Cited by 584
NetSurfP‐2.0: Improved prediction of protein structural features by integrated deep learning
Klausen, M. S., Jespersen, M. C., Nielsen, H., Jensen, K. K., Jurtz, V. I., Sønderby, C. K., Sommer, M. O. A., Winther, O., Nielsen, M., Petersen, B., et al. (2019) · Proteins: Structure, Function, and Bioinformatics · doi:10.1002/prot.25674 · Cited by 574
Protein structure determination using metagenome sequence data
Ovchinnikov, S., Park, H., Varghese, N., Huang, P.-S., Pavlopoulos, G. A., Kim, D. E., Kamisetty, H., Kyrpides, N. C., & Baker, D. (2017) · Science · doi:10.1126/science.aah4043 · Cited by 520
Critical assessment of methods of protein structure prediction (CASP)—Round XIII
Kryshtafovych, A., Schwede, T., Topf, M., Fidelis, K., & Moult, J. (2019) · Proteins: Structure, Function, and Bioinformatics · doi:10.1002/prot.25823 · Cited by 506
CCMpred—fast and precise prediction of protein residue–residue contacts from correlated mutations
Seemayer, S., Gruber, M., & Söding, J. (2014) · Bioinformatics · doi:10.1093/bioinformatics/btu500 · Cited by 416
Distance-based protein folding powered by deep learning
Xu, J. (2019) · Proceedings of the National Academy of Sciences · doi:10.1073/pnas.1821309116 · Cited by 401
Expanding functional protein sequence spaces using generative adversarial networks
Repecka, D., Jauniskis, V., Karpus, L., Rembeza, E., Rokaitis, I., Zrimec, J., Poviloniene, S., Laurynenas, A., Viknander, S., Abuajwa, W., et al. (2021) · Nature Machine Intelligence · doi:10.1038/s42256-021-00310-5 · Cited by 388
BERTology Meets Biology: Interpreting Attention in Protein Language Models
Vig, J., Madani, A., Varshney, L. R., Xiong, C., Socher, R., & Rajani, N. F. (2020) · doi:10.1101/2020.06.26.174417 · Cited by 338
Critical assessment of methods of protein structure prediction (CASP)—Round XII
Moult, J., Fidelis, K., Kryshtafovych, A., Schwede, T., & Tramontano, A. (2018) · Proteins: Structure, Function, and Bioinformatics · doi:10.1002/prot.25415 · Cited by 326
Learning generative models for protein fold families
Balakrishnan, S., Kamisetty, H., Carbonell, J. G., Lee, S., & Langmead, C. J. (2011) · Proteins: Structure, Function, and Bioinformatics · doi:10.1002/prot.22934 · Cited by 316
Learned protein embeddings for machine learning
Yang, K. K., Wu, Z., Bedbrook, C. N., & Arnold, F. H. (2018) · Bioinformatics · doi:10.1093/bioinformatics/bty178 · Cited by 311
Sharp nearby, fuzzy far away: How neural language models use context
Khandelwal, U., He, H., Qi, P., & Jurafsky, D. (2018) · Proceedings of the 56th Annual Meeting of the Association for Computational Linguistics (Volume 1: Long Papers) · doi:10.18653/v1/p18-1027 · Cited by 303
Sharp Nearby, Fuzzy Far Away: How Neural Language Models Use Context
Khandelwal, U., He, H., Qi, P., & Jurafsky, D. (2018) · arXiv · doi:10.48550/arxiv.1805.04623 · Cited by 302
Altschuh, D., Lesk, A. M., Bloomer, A. C., & Klug, A. (1987) · Journal of Molecular Biology · doi:10.1016/0022-2836(87)90352-4 · Cited by 284
Coevolutionary Landscape Inference and the Context-Dependence of Mutations in Beta-Lactamase TEM-1
Figliuzzi, M., Jacquier, H., Schug, A., Tenaillon, O., & Weigt, M. (2016) · Molecular Biology and Evolution · doi:10.1093/molbev/msv211 · Cited by 263
BERT has a Mouth, and It Must Speak: BERT as a Markov Random Field Language ModelPreprint
Wang, A., & Cho, K. (2019) · arXiv (Cornell University) · doi:10.48550/arxiv.1902.04094 · Cited by 262
Moult, J., Fidelis, K., Kryshtafovych, A., Schwede, T., & Tramontano, A. (2016) · Proteins: Structure, Function, and Bioinformatics · doi:10.1002/prot.25064 · Cited by 232
Hopf, T. A., Ingraham, J., Poelwijk, F. J., Springer, M., Sander, C., & Marks, D. S. (2015) · arXiv (Cornell University) · doi:10.48550/arxiv.1510.04612 · Cited by 223
Learning protein sequence embeddings using information from structure
Bepler, T., & Berger, B. (2019) · arXiv · doi:10.48550/arxiv.1902.08661 · Cited by 219
Cloze-driven Pretraining of Self-attention Networks
Baevski, A., Edunov, S., Liu, Y., Zettlemoyer, L., & Auli, M. (2019) · Proceedings of the 2019 Conference on Empirical Methods in Natural Language Processing and the 9th International Joint Conference on Natural Language Processing (EMNLP-IJCNLP) · doi:10.18653/v1/d19-1539 · Cited by 215
ProGen: Language Modeling for Protein Generation
Madani, A., McCann, B., Naik, N., Keskar, N. S., Anand, N., Eguchi, R. R., Huang, P.-S., & Socher, R. (2020) · bioRxiv (Cold Spring Harbor Laboratory) · doi:10.1101/2020.03.07.982272 · Cited by 212
Quantitative Missense Variant Effect Prediction Using Large-Scale Mutagenesis Data
Gray, V. E., Hause, R. J., Luebeck, J., Shendure, J., & Fowler, D. M. (2018) · Cell Systems · doi:10.1016/j.cels.2017.11.003 · Cited by 209
Generating functional protein variants with variational autoencoders
Hawkins-Hooker, A., Depardieu, F., Baur, S., Couairon, G., Chen, A., & Bikard, D. (2021) · PLOS Computational Biology · doi:10.1371/journal.pcbi.1008736 · Cited by 209
Selection Forces and Constraints on Retroviral Sequence Variation
Overbaugh, J., & Bangham, C. R. M. (2001) · Science · doi:10.1126/science.1059128 · Cited by 197
UDSMProt: universal deep sequence models for protein classification
Strodthoff, N., Wagner, P., Wenzel, M., & Samek, W. (2020) · Bioinformatics · doi:10.1093/bioinformatics/btaa003 · Cited by 189
Origins of coevolution between residues distant in protein 3D structures
Anishchenko, I., Ovchinnikov, S., Kamisetty, H., & Baker, D. (2017) · Proceedings of the National Academy of Sciences · doi:10.1073/pnas.1702664114 · Cited by 185
Jones, D. T., & Kandathil, S. M. (2018) · Bioinformatics · doi:10.1093/bioinformatics/bty341 · Cited by 184
Correlated mutations in models of protein sequences: phylogenetic and structural effects
Lapedes, A. S., Giraud, B., Liu, L., & Stormo, G. D. (1999) · Institute of Mathematical Statistics Lecture Notes - Monograph Series · doi:10.1214/lnms/1215455556 · Cited by 124
Protein Structure Relationships Revealed by Mutational Analysis
Yanofsky, C., Horn, V., & Thorpe, D. (1964) · Science · doi:10.1126/science.146.3651.1593 · Cited by 98
Coordinated amino acid changes in homologous protein families
Altschuh, D., Vernet, T., Berti, P. J., Moras, D., & Nagai, K. (1988) · Protein Engineering Design and Selection · doi:10.1093/protein/2.3.193 · Cited by 96
MRFalign: Protein Homology Detection through Alignment of Markov Random Fields
Ma, J., Wang, S., Wang, Z., & Xu, J. (2014) · PLoS Computational Biology · doi:10.1371/journal.pcbi.1003500 · Cited by 93
Self-citationProtein sequence comparison and fold recognition: progress and good-practice benchmarking
Söding, J., & Remmert, M. (2011) · Current Opinion in Structural Biology · doi:10.1016/j.sbi.2011.03.005 · Cited by 83
Graphical Models of Residue Coupling in Protein Families
Thomas, J., Ramakrishnan, N., & Bailey-Kellogg, C. (2008) · IEEE/ACM Transactions on Computational Biology and Bioinformatics · doi:10.1109/tcbb.2007.70225 · Cited by 77
Amino acid composition of proteins reduces deleterious impact of mutations
Hormoz, S. (2013) · Scientific Reports · doi:10.1038/srep02919 · Cited by 77
Amimeur, T., Shaver, J. M., Ketchem, R. R., Taylor, J. A., Clark, R. H., Smith, J., Citters, D. V., Siska, C. C., Smidt, P., Sprague, M., et al. (2020) · bioRxiv (Cold Spring Harbor Laboratory) · doi:10.1101/2020.04.12.024844 · Cited by 77
Belle, V., den Broeck, G. V., & Passerini, A. (2016) · National Conference on Artificial Intelligence · Cited by 75
DEEPCON: protein contact prediction using dilated convolutional neural networks with dropout
Adhikari, B. (2019) · Bioinformatics · doi:10.1093/bioinformatics/btz593 · Cited by 57
Evolution of Proteins and Proteomes: A Phylogenetics Approach
Gabaldón, T. (2005) · Evolutionary Bioinformatics · doi:10.1177/117693430500100004 · Cited by 55
Protein Design and Variant Prediction Using Autoregressive Generative ModelsPreprint
Shin, J.-E., Riesselman, A. J., Kollasch, A. W., McMahon, C., Simon, E. P., Sander, C., Manglik, A., Kruse, A. C., & Marks, D. S. (2019) · bioRxiv (Cold Spring Harbor Laboratory) · doi:10.1101/757252 · Cited by 50
ProGen: Language Modeling for Protein GenerationPreprint
Madani, A., McCann, B., Naik, N., Keskar, N. S., Anand, N., Eguchi, R. R., Huang, P., & Socher, R. (2020) · arXiv (Cornell University) · doi:10.48550/arxiv.2004.03497 · Cited by 42
Distance-based Protein Folding Powered by Deep LearningPreprint
Xu, J. (2018) · bioRxiv (Cold Spring Harbor Laboratory) · doi:10.1101/465955 · Cited by 39
Impact of selection, mutation rate and genetic drift on human genetic variation
Sunyaev, S. R., Kondrashov, F. A., Bork, P., & Ramensky, V. (2003) · Human Molecular Genetics · doi:10.1093/hmg/ddg359 · Cited by 37
Generating functional protein variants with variational autoencodersPreprint
Hawkins‐Hooker, A., Depardieu, F., Baur, S., et al. (2020) · bioRxiv (Cold Spring Harbor Laboratory) · doi:10.1101/2020.04.07.029264 · Cited by 34
Expanding functional protein sequence space using generative adversarial networksPreprint
Repecka, D., Jauniškis, V., Karpus, L., et al. (2019) · bioRxiv (Cold Spring Harbor Laboratory) · doi:10.1101/789719 · Cited by 31
Revealing evolutionary constraints on proteins through sequence analysis
Wang, S., Bitbol, A., & Wingreen, N. S. (2019) · PLoS Computational Biology · doi:10.1371/journal.pcbi.1007010 · Cited by 28
Correlated mutations in protein sequences: Phylogenetic and structural effects
Los Alamos National Lab., T. D., Lapedes, A. S., Liu, L. C., GIRAUD, B. G., Liu, L., & Stormo, G. D. (1998) · doi:10.2172/296863 · Cited by 25
End-to-end multitask learning, from protein language to protein features without alignmentsPreprint
Elnaggar, A., Heinzinger, M., Dallago, C., & Rost, B. (2019) · bioRxiv · doi:10.1101/864405 · Cited by 19
Evolutionary Context-Integrated Deep Sequence Modeling for Protein Engineering
Luo, Y., Vo, L. T., Ding, H., Su, Y., Liu, Y., Qian, W. W., Zhao, H., & Peng, J. (2020) · Lecture notes in computer science · doi:10.1007/978-3-030-45257-5_30 · Cited by 18
Evolutionary context-integrated deep sequence modeling for protein engineeringPreprint
Luo, Y., Vo, L. T., Ding, H., et al. (2020) · bioRxiv (Cold Spring Harbor Laboratory) · doi:10.1101/2020.01.16.908509 · Cited by 13
MRFalign: Protein Homology Detection through Alignment of Markov Random Fields
Ma, J., Wang, S., Wang, Z., & Xu, J. (2014) · Lecture notes in computer science · doi:10.1007/978-3-319-05269-4_13 · Cited by 6
Self-citation
Research works printed but not linked: 4
- A. Radford . Language models are unsupervised multitask learners. OpenAI Blog [Preprint] (2019). https://openai.com/blog/better-language-models (Accessed 6 August 2020).
- 10.1016/S0022-2836(05)80360-2 · doi:10.1016/s0022-2836(05)80360-2 · Paper page
- A. Radford K. Narasimhan T. Salimans I. Sutskever Improving language understanding by generative pre-training. OpenAI Blog [Preprint] (2018). https://openai.com/blog/language-unsupervised (Accessed 6 August 2020).
- T. Mikolov . Subword language modeling with neural networks. The website of T. Mikolov [Preprint] (2012). http://www.fit.vutbr.cz/∼imikolov/rnnlm/char.pdf (Accessed 14 March 2021).
Cited by
Highly accurate protein structure prediction with AlphaFold
Jumper, J., Evans, R., Pritzel, A., Green, T., Figurnov, M., Ronneberger, O., Tunyasuvunakool, K., Bates, R., Žídek, A., Potapenko, A., et al. (2021) · Nature · doi:10.1038/s41586-021-03819-2 · Cited by 43,764
Evolutionary-scale prediction of atomic level protein structure with a language model
Lin, Z., Akin, H., Rao, R., Hie, B., Zhu, Z., Lu, W., Smetanin, N., Verkuil, R., Kabeli, O., Shmueli, Y., et al. (2022) · doi:10.1101/2022.07.20.500902 · Cited by 5,990
Self-citationSignalP 6.0 predicts all five types of signal peptides using protein language models
Teufel, F., Almagro Armenteros, J. J., Johansen, A. R., Gíslason, M. H., Pihl, S. I., Tsirigos, K. D., Winther, O., Brunak, S., von Heijne, G., & Nielsen, H. (2022) · Nature Biotechnology · doi:10.1038/s41587-021-01156-3 · Cited by 2,867
On the Opportunities and Risks of Foundation Models
Bommasani, R., Hudson, D. A., Adeli, E., Altman, R., Arora, S., von Arx, S., Bernstein, M. S., Bohg, J., Bosselut, A., Brunskill, E., et al. (2021) · arXiv · doi:10.48550/arxiv.2108.07258 · Cited by 2,676
ProtTrans: Toward Understanding the Language of Life Through Self-Supervised Learning
Elnaggar, A., Heinzinger, M., Dallago, C., Rehawi, G., Wang, Y., Jones, L., Gibbs, T., Feher, T., Angerer, C., Steinegger, M., et al. (2022) · IEEE Transactions on Pattern Analysis and Machine Intelligence · doi:10.1109/tpami.2021.3095381 · Cited by 2,329
Metadata
- Authors
- Rives, A., Meier, J., Sercu, T., Goyal, S., Lin, Z., Liu, J., Guo, D., Ott, M., Zitnick, C. L., Ma, J., & Fergus, R.
- Affiliations
- Meta (United States) (US)
- New York University (US)
- Harvard University (US)
- Yale University (US)
- Corresponding author
- Rives, Alexander
- ORCID
- Venue
- Proceedings of the National Academy of Sciences
- Publisher
- National Academy of Sciences
- Published
- 2021-04-05
- Volume
- 118
- Issue
- 15
- ISSN
- 0027-8424 (ISSN-L)
- 1091-6490
- PMC
- PMC8053943
- OpenAlex
- W3146944767
- Cited by
- 3,286
- References
- 100
- Citations by year
- 2026: 787 · 2025: 813 · 2024: 697 · 2023: 448 · 2022: 305 · 2021: 162
- FWCI
- 126.15
- Type
- journal article
- Language
- en
- Open access
- hybrid
- doi.org
- Licence
- Locations
- Proceedings of the National Academy of Sciences (publishedVersion, cc-by-nc-nd)
- bioRxiv (Cold Spring Harbor Laboratory) (acceptedVersion, cc-by-nc-nd)
- PubMed Central (publishedVersion, cc-by-nc-nd)
- PubMed (publishedVersion)
- Knowledge@UChicago (University of Chicago) (submittedVersion, cc-by-nc-nd)
- University of Chicago
- Funders
- National Science Foundation (1339362)
- Topics
- Life Sciences › Biochemistry, Genetics and Molecular Biology › Molecular Biology › Machine Learning in Bioinformatics
- Life Sciences › Biochemistry, Genetics and Molecular Biology › Molecular Biology › Protein Structure and Dynamics
- Life Sciences › Biochemistry, Genetics and Molecular Biology › Molecular Biology › RNA and protein synthesis mechanisms
- Keywords
- protein language models, unsupervised learning, protein evolution, protein structure prediction, secondary structure prediction, protein tertiary structure, remote homology
- MeSH terms
- Unsupervised Machine Learning, Amino Acids, Protein Conformation, Sequence Homology, Amino Acid, Sequence Analysis, Protein
About these checks
Registry, retraction, Cites and statistics results are computed, not judged, with one exception: a printed reference that no index lists is read once by a model before it counts as a citation error. Claims are extracted by a model and kept only when their quote appears verbatim in the text; each cited source is then checked, with a model’s help, for whether it says what the claim relies on. Those verdicts can be wrong — read the claim’s quote and the cited source before relying on one.
Statistics and arithmetic are recomputed, not judged.
Confidence bands are shown only for fields calibrated on our annotated test set. None is calibrated yet, so no band is shown.
What counts as a claim ›How we measure confidence ›How we check this ›
Are you an author, or do you see a problem with this page? Request a review
Data sources
Bibliographic data: Semantic Scholar, OpenAlex, Crossref.
Contains information from the Semantic Scholar Academic Graph Datasets, made available under the ODC Attribution License (ODC-BY 1.0).
Semantic Scholar’s data is described in: Kinney, R., et al. (2023). The Semantic Scholar Open Data Platform. arXiv:2301.10140.
