

The DOI matches its Crossref record; 70 of the 70 references it cites were found in a registry or an index.
Importance of Shank3 Protein in Regulating Metabotropic Glutamate Receptor 5 (mGluR5) Expression and Signaling at Synapses
Open accessAbstract
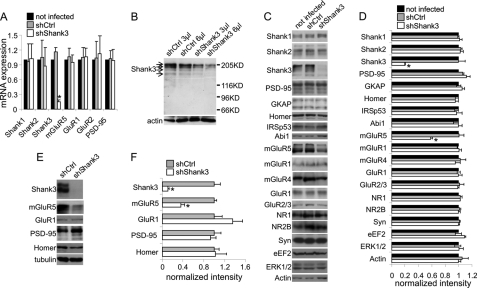
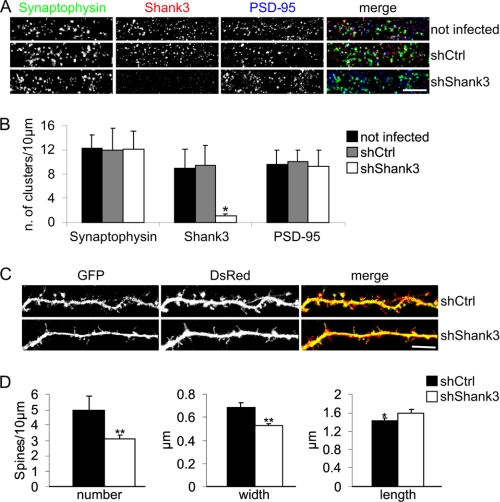
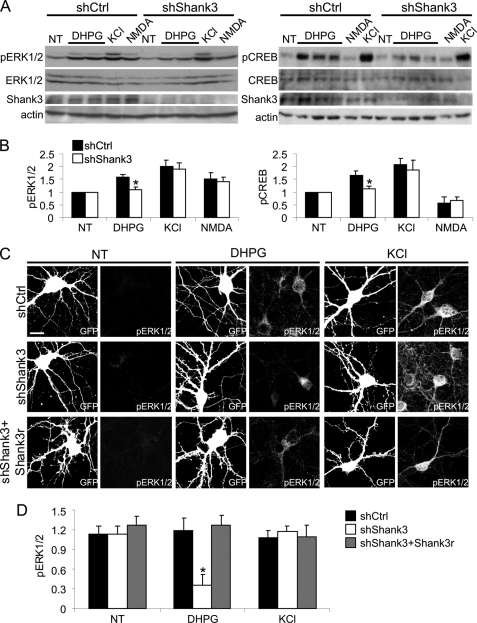
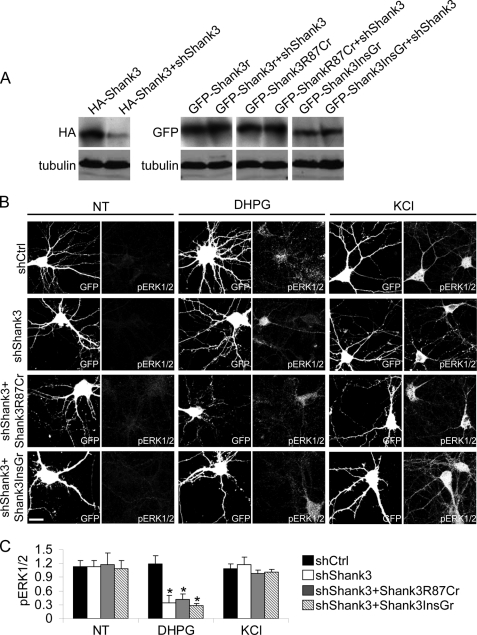
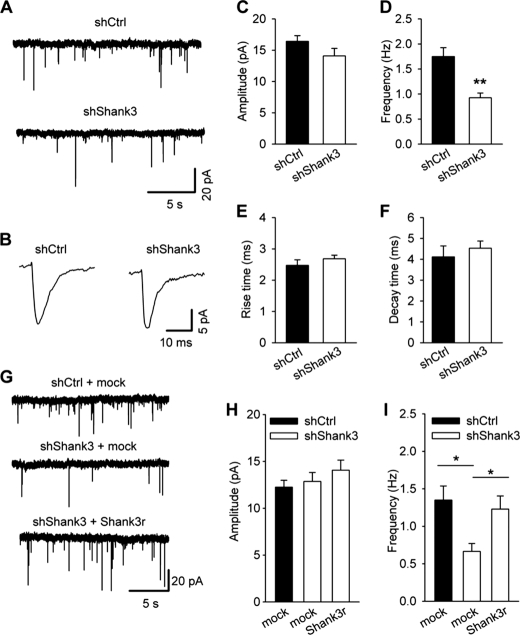
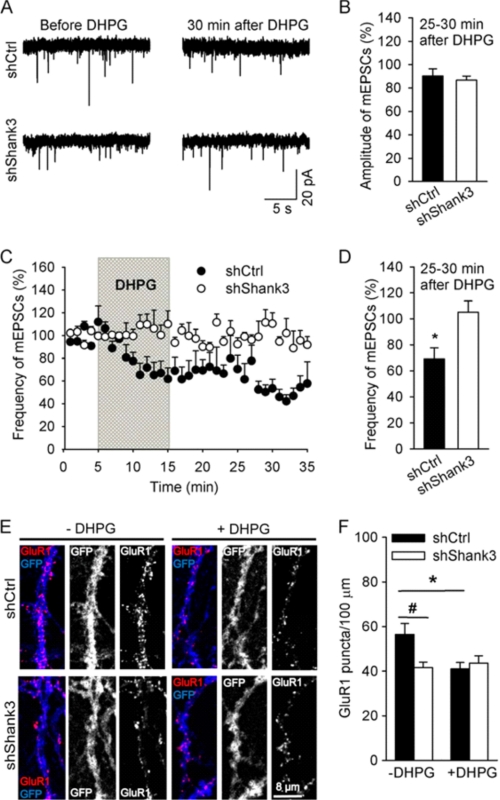
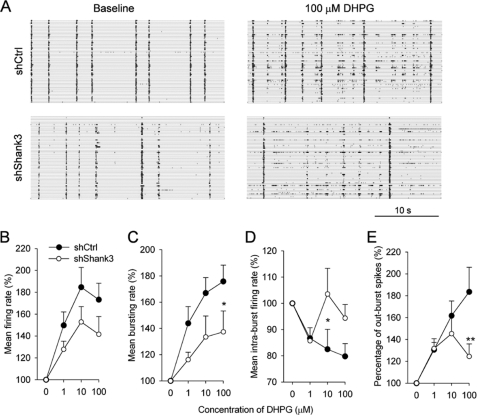
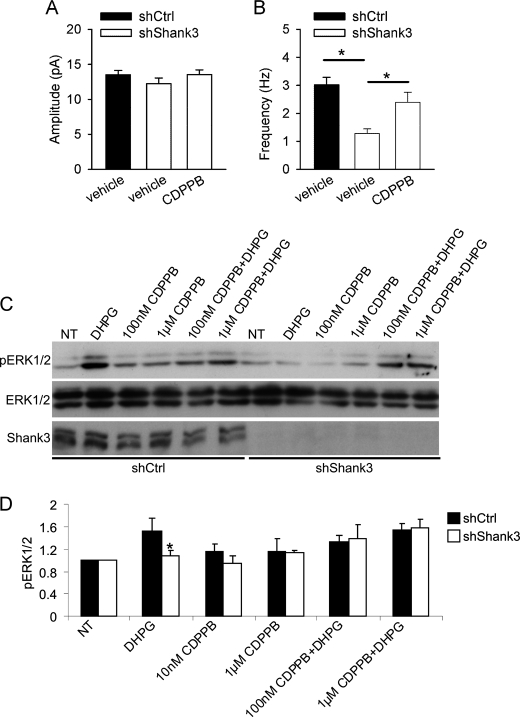
Shank3/PROSAP2 gene mutations are associated with cognitive impairment ranging from mental retardation to autism. Shank3 is a large scaffold postsynaptic density protein implicated in dendritic spines and synapse formation; however, its specific functions have not been clearly demonstrated. We have used RNAi to knockdown Shank3 expression in neuronal cultures and showed that this treatment specifically reduced the synaptic expression of the metabotropic glutamate receptor 5 (mGluR5), but did not affect the expression of other major synaptic proteins. The functional consequence of Shank3 RNAi knockdown was impaired signaling via mGluR5, as shown by reduction in ERK1/2 and CREB phosphorylation induced by stimulation with (S)-3,5-dihydroxyphenylglycine (DHPG) as the agonist of mGluR5 receptors, impaired mGluR5-dependent synaptic plasticity (DHPG-induced long-term depression), and impaired mGluR5-dependent modulation of neural network activity. We also found morphological abnormalities in the structure of synapses (spine number, width, and length) and impaired glutamatergic synaptic transmission, as shown by reduction in the frequency of miniature excitatory postsynaptic currents (mEPSC). Notably, pharmacological augmentation of mGluR5 activity using 3-cyano-N-(1,3-diphenyl-1H-pyrazol-5-yl)-benzamide as the positive allosteric modulator of these receptors restored mGluR5-dependent signaling (DHPG-induced phosphorylation of ERK1/2) and normalized the frequency of mEPSCs in Shank3-knocked down neurons. These data demonstrate that a deficit in mGluR5-mediated intracellular signaling in Shank3 knockdown neurons can be compensated by 3-cyano-N-(1,3-diphenyl-1H-pyrazol-5-yl)-benzamide; this raises the possibility that pharmacological augmentation of mGluR5 activity represents a possible new therapeutic approach for patients with Shank3 mutations.
Overview
The claims and statistics of this paper haven’t been checked yet.
Run the check — free, no account needed. It reads the open-access text and checks the sources it cites.
Integrity signals
Registry
Cites
Statistics
Figures
Verification
Claims the paper makes
The claims and statistics of this paper haven’t been checked yet.
Run the check — free, no account needed. It reads the open-access text and checks the sources it cites.
Claims other papers make about this one
Each is checked against this paper’s own text: does it say what the citing paper says it does?
In the citing paper
“In cultured rat neurons, knock-down of Shank3 selectively reduces synaptic mGluR5 receptor and impairs mGluR5-dependent signaling and plasticity (Verpelli et al., 2011).”
From Modeling Autism by SHANK Gene Mutations in Mice (2013) · cites this paper as Verpelli et al., 2011
In the citing paper
“Moreover, acute knockdown of Shank3 in cultured neurons decreases mGluR-dependent plasticity (Verpelli et al., 2011)”
From Modeling Autism by SHANK Gene Mutations in Mice (2013) · cites this paper as Verpelli et al., 2011
Self-check
Percentages, sums and reported differences re-computed from the paper’s own numbers.
The self-check needs the paper’s full text.
Citations
Cites
1 retracted
RETRACTED: Enhanced Polyubiquitination of Shank3 and NMDA Receptor in a Mouse Model of Autism
Bangash, M. A., Park, J. M., Melnikova, T., Wang, D., Jeon, S. K., Lee, D., Syeda, S. K., Kim, J., Kouser, M., Schwartz, J. L., et al. (2011) · Cell · doi:10.1016/j.cell.2011.03.052 · Cited by 116
RetractedConserved role of intragenic DNA methylation in regulating alternative promoters
Maunakea, A. K., Nagarajan, R. P., Bilenky, M., Ballinger, T. J., D’Souza, C., Fouse, S. D., Johnson, B. E., Hong, C., Nielsen, C., Zhao, Y., et al. (2010) · Nature · doi:10.1038/nature09165 · Cited by 1,743
Durand, C. M., Betancur, C., Boeckers, T. M., Bockmann, J., Chaste, P., Fauchereau, F., Nygren, G., Rastam, M., Gillberg, I. C., Anckarsäter, H., et al. (2007) · Nature Genetics · doi:10.1038/ng1933 · Cited by 1,602
Shank3 mutant mice display autistic-like behaviours and striatal dysfunction
Peça, J., Feliciano, C., Ting, J. T., Wang, W., Wells, M. F., Venkatraman, T. N., Lascola, C. D., Fu, Z., & Feng, G. (2011) · Nature · doi:10.1038/nature09965 · Cited by 1,570
Altered synaptic plasticity in a mouse model of fragile X mental retardation
Huber, K. M., Gallagher, S. M., Warren, S. T., & Bear, M. F. (2002) · Proceedings of the National Academy of Sciences · doi:10.1073/pnas.122205699 · Cited by 1,349
Coupling of mGluR/Homer and PSD-95 Complexes by the Shank Family of Postsynaptic Density Proteins
Tu, J. C., Xiao, B., Naisbitt, S. R., Yuan, J. P., Petralia, R. S., Brakeman, P., Doan, A., Aakalu, V. K., Lanahan, A. A., Sheng, M., et al. (1999) · Neuron · doi:10.1016/s0896-6273(00)80810-7 · Cited by 1,079
Fragile X Syndrome: Loss of Local mRNA Regulation Alters Synaptic Development and Function
Bassell, G. J., & Warren, S. T. (2008) · Neuron · doi:10.1016/j.neuron.2008.10.004 · Cited by 1,051
Naisbitt, S., Kim, E., Tu, J. C., Xiao, B., Sala, C., Valtschanoff, J., Weinberg, R. J., Worley, P. F., & Sheng, M. (1999) · Neuron · doi:10.1016/s0896-6273(00)80809-0 · Cited by 1,009
Self-citationLong-term depression in the CNS
Collingridge, G. L., Peineau, S., Howland, J. G., & Wang, Y. T. (2010) · Nature Reviews Neuroscience · doi:10.1038/nrn2867 · Cited by 926
Regulation of Dendritic Spine Morphology and Synaptic Function by Shank and Homer
Sala, C., Piëch, V., Wilson, N. R., Passafaro, M., Liu, G., & Sheng, M. (2001) · Neuron · doi:10.1016/s0896-6273(01)00339-7 · Cited by 716
Self-citation
Cited by
Sorted by citations
Autistic-like social behaviour in Shank2-mutant mice improved by restoring NMDA receptor function
Won, H., Lee, H.-R., Gee, H. Y., Mah, W., Kim, J.-I., Lee, J., Ha, S., Chung, C., Jung, E. S., Cho, Y. S., et al. (2012) · Nature · doi:10.1038/nature11208 · Cited by 695
Modeling Autism by SHANK Gene Mutations in Mice
Jiang, Y.-H., & Ehlers, M. D. (2013) · Neuron · doi:10.1016/j.neuron.2013.03.016 · Cited by 488
Dendritic Spines: The Locus of Structural and Functional Plasticity
Sala, C., & Segal, M. (2014) · Physiological Reviews · doi:10.1152/physrev.00012.2013 · Cited by 491
Self-citationYang, M., Bozdagi, O., Scattoni, M. L., Wöhr, M., Roullet, F. I., Katz, A. M., Abrams, D. N., Kalikhman, D., Simon, H., Woldeyohannes, L., et al. (2012) · The Journal of Neuroscience · doi:10.1523/jneurosci.6107-11.2012 · Cited by 369
Kouser, M., Speed, H. E., Dewey, C. M., Reimers, J. M., Widman, A. J., Gupta, N., Liu, S., Jaramillo, T. C., Bangash, M. A., Xiao, B., et al. (2013) · Journal of Neuroscience · doi:10.1523/jneurosci.3017-13.2013 · Cited by 297
Prevalence of SHANK3 variants in patients with different subtypes of autism spectrum disorders
Boccuto, L., Lauri, M., Sarasua, S. M., Skinner, C. D., Buccella, D., Dwivedi, A., Orteschi, D., Collins, J. S., Zollino, M., Visconti, P., et al. (2013) · European Journal of Human Genetics · doi:10.1038/ejhg.2012.175 · Cited by 240
Environmental Factors in Autism
Grabrucker, A. M. (2013) · Frontiers in Psychiatry · doi:10.3389/fpsyt.2012.00118 · Cited by 254
Postsynaptic ProSAP/Shank scaffolds in the cross-hair of synaptopathies
Grabrucker, A. M., Schmeisser, M. J., Schoen, M., & Boeckers, T. M. (2011) · Trends in Cell Biology · doi:10.1016/j.tcb.2011.07.003 · Cited by 233
Self-citationTranslational animal models of autism and neurodevelopmental disorders
Crawley, J. N. (2012) · Dialogues in Clinical Neuroscience · doi:10.31887/dcns.2012.14.3/jcrawley · Cited by 236
An epigenetic framework for neurodevelopmental disorders: From pathogenesis to potential therapy
Millan, M. J. (2013) · Neuropharmacology · doi:10.1016/j.neuropharm.2012.11.015 · Cited by 229
Early hyperactivity and precocious maturation of corticostriatal circuits in Shank3B−/− mice
Peixoto, R. T., Wang, W., Croney, D. M., Kozorovitskiy, Y., & Sabatini, B. L. (2016) · Nature Neuroscience · doi:10.1038/nn.4260 · Cited by 226
Sala, C., Vicidomini, C., Bigi, I., Mossa, A., & Verpelli, C. (2015) · Journal of Neurochemistry · doi:10.1111/jnc.13232 · Cited by 182
Self-citationArons, M. H., Thynne, C. J., Grabrucker, A. M., Li, D., Schoen, M., Cheyne, J. E., Boeckers, T. M., Montgomery, J. M., & Garner, C. C. (2012) · Journal of Neuroscience · doi:10.1523/jneurosci.2215-12.2012 · Cited by 180
Self-citationWang, X., Xu, Q., Bey, A. L., Lee, Y., & Jiang, Y. (2014) · Molecular Autism · doi:10.1186/2040-2392-5-30 · Cited by 173
SHANK3 controls maturation of social reward circuits in the VTA
Bariselli, S., Tzanoulinou, S., Glangetas, C., Prévost-Solié, C., Pucci, L., Viguié, J., Bezzi, P., O'Connor, E. C., Georges, F., Lüscher, C., et al. (2016) · Nature Neuroscience · doi:10.1038/nn.4319 · Cited by 168
Autism spectrum disorder and epilepsy: Disorders with a shared biology
Lee, B. H., Smith, T., & Paciorkowski, A. R. (2015) · Epilepsy & Behavior · doi:10.1016/j.yebeh.2015.03.017 · Cited by 172
Ebrahimi‐Fakhari, D., & Şahin, M. (2015) · Current Opinion in Neurology · doi:10.1097/wco.0000000000000186 · Cited by 177
CRISPR/Cas9-induced shank3b mutant zebrafish display autism-like behaviors
Liu, C., Li, C., Hu, C.-C., Wang, Y., Lin, J., Jiang, Y., Li, Q., & Xu, X. (2018) · Molecular Autism · doi:10.1186/s13229-018-0204-x · Cited by 170
Jaramillo, T. C., Speed, H. E., Xuan, Z., Reimers, J. M., Liu, S., & Powell, C. M. (2015) · Autism Research · doi:10.1002/aur.1529 · Cited by 160
CLK2 inhibition ameliorates autistic features associated with SHANK3 deficiency
Bidinosti, M., Botta, P., Krüttner, S., Proenca, C. C., Stoehr, N., Bernhard, M., Fruh, I., Mueller, M., Bonenfant, D., Voshol, H., et al. (2016) · Science · doi:10.1126/science.aad5487 · Cited by 151
Pharmacological enhancement of mGlu5 receptors rescues behavioral deficits in SHANK3 knock-out mice
Vicidomini, C., Ponzoni, L., Lim, D., Schmeißer, M. J., Reim, D., Morello, N., Orellana, D. I., Tozzi, A., Durante, V., Scalmani, P., et al. (2016) · Molecular Psychiatry · doi:10.1038/mp.2016.30 · Cited by 147
Self-citationSpeed, H. E., Kouser, M., Xuan, Z., Reimers, J. M., Ochoa, C. F., Gupta, N. M., Liu, S., & Powell, C. M. (2015) · Journal of Neuroscience · doi:10.1523/jneurosci.3125-14.2015 · Cited by 148
Is autism a disease of the cerebellum? An integration of clinical and pre-clinical research
Rogers, T. D., McKimm, E., Dickson, P. E., Goldowitz, D., Blaha, C. D., & Mittleman, G. (2013) · Frontiers in Systems Neuroscience · doi:10.3389/fnsys.2013.00015 · Cited by 154
Developmental vulnerability of synapses and circuits associated with neuropsychiatric disorders
Penzes, P., Buonanno, A., Passafaro, M., Sala, C., & Sweet, R. A. (2013) · Journal of Neurochemistry · doi:10.1111/jnc.12261 · Cited by 125
Self-citationJaramillo, T. C., Speed, H. E., Xuan, Z., Reimers, J. M., Escamilla, C. O., Weaver, T. P., Liu, S., Filonova, I., & Powell, C. M. (2017) · Autism Research · doi:10.1002/aur.1664 · Cited by 119
Autism-Associated Shank3 Is Essential for Homeostatic Compensation in Rodent V1
Tatavarty, V., Pacheco, A. T., Kuhnle, C. G., Lin, H. K., Koundinya, P., Miska, N. J., Hengen, K. B., Wagner, F. F., Hooser, S. D. V., & Turrigiano, G. G. (2020) · Neuron · doi:10.1016/j.neuron.2020.02.033 · Cited by 127
Shank3 Deficiency Induces NMDA Receptor Hypofunction via an Actin-Dependent Mechanism
Duffney, L. J., Wei, J., Cheng, J., Liu, W., Smith, K. R., Kittler, J. T., & Yan, Z. (2013) · The Journal of Neuroscience · doi:10.1523/jneurosci.1175-13.2013 · Cited by 115
Lee, E., Lee, H., Huang, T., Chung, C., Shin, W., Kim, K., Koh, J., Hsueh, Y., & Kim, E. (2015) · Nature Communications · doi:10.1038/ncomms8168 · Cited by 110
PDZ Protein Regulation of G Protein–Coupled Receptor Trafficking and Signaling Pathways
Dunn, H., & Ferguson, S. (2015) · Molecular Pharmacology · doi:10.1124/mol.115.098509 · Cited by 130
A role for synaptic zinc in ProSAP/Shank PSD scaffold malformation in autism spectrum disorders
Grabrucker, A. M. (2013) · Developmental Neurobiology · doi:10.1002/dneu.22089 · Cited by 105
Gastambide, F., Cotel, M., Gilmour, G., O'Neill, M., Robbins, T., & Tricklebank, M. (2012) · Neuropsychopharmacology · doi:10.1038/npp.2011.298 · Cited by 119
D’Antoni, S., Spatuzza, M., Bonaccorso, C. M., Musumeci, S. A., Ciranna, L., Nicoletti, F., Huber, K. M., & Catania, M. V. (2014) · Neuroscience & Biobehavioral Reviews · doi:10.1016/j.neubiorev.2014.02.003 · Cited by 97
A Subset of Autism-Associated Genes Regulate the Structural Stability of Neurons
Lin, Y., Frei, J. A., Kilander, M. B. C., Shen, W., & Blatt, G. J. (2016) · Frontiers in Cellular Neuroscience · doi:10.3389/fncel.2016.00263 · Cited by 97
Iasevoli, F., Tomasetti, C., & de Bartolomeis, A. (2012) · Neurochemical Research · doi:10.1007/s11064-012-0886-y · Cited by 91
Kozol, R. A., Cukier, H. N., Zou, B., Mayo, V., Rubeis, S. D., Cai, G., Griswold, A. J., Whitehead, P. L., Haines, J. L., Gilbert, J. R., et al. (2015) · Human Molecular Genetics · doi:10.1093/hmg/ddv138 · Cited by 95
Hippocampal deficits in neurodevelopmental disorders
Li, Y., Shen, M., Stockton, M. E., & Zhao, X. (2018) · Neurobiology of Learning and Memory · doi:10.1016/j.nlm.2018.10.001 · Cited by 89
Zwanenburg, R. J., Bocca, G., Ruiter, S., Dillingh, J. H., Flapper, B. C. T., van den Heuvel, E. R., & van Ravenswaaij‐Arts, C. M. A. (2016) · European Journal of Human Genetics · doi:10.1038/ejhg.2016.109 · Cited by 81
Autism-associated SHANK3 mutations impair maturation of neuromuscular junctions and striated muscles
Lutz, A.-K., Pfaender, S., Incearap, B., Ioannidis, V., Ottonelli, I., Föhr, K. J., Cammerer, J., Zoller, M., Higelin, J., Giona, F., et al. (2020) · Science Translational Medicine · doi:10.1126/scitranslmed.aaz3267 · Cited by 75
Self-citationSNAP-25 regulates spine formation through postsynaptic binding to p140Cap
Tomasoni, R., Repetto, D., Morini, R., Elia, C., Gardoni, F., Di Luca, M., Turco, E., Defilippi, P., & Matteoli, M. (2013) · Nature Communications · doi:10.1038/ncomms3136 · Cited by 71
Mao, W., Watanabe, T., Cho, S., Frost, J. L., Truong, T., Zhao, X., & Futai, K. (2015) · European Journal of Neuroscience · doi:10.1111/ejn.12877 · Cited by 59
Pfaender, S., Sauer, A. K., Hagmeyer, S., Mangus, K., Linta, L., Liebau, S., Bockmann, J., Huguet, G., Bourgeron, T., Boeckers, T. M., et al. (2017) · Scientific Reports · doi:10.1038/srep45190 · Cited by 71
Verma, V., Paul, A., Vishwanath, A. A., Vaidya, B., & Clement, J. P. (2019) · Open Biology · doi:10.1098/rsob.180265 · Cited by 68
Shank and Zinc Mediate an AMPA Receptor Subunit Switch in Developing Neurons
Ha, H., Leal‐Ortiz, S., Lalwani, K., Kiyonaka, S., Hamachi, I., Mysore, S. P., Montgomery, J. M., Garner, C. C., Huguenard, J. R., & Kim, S. A. (2018) · Frontiers in Molecular Neuroscience · doi:10.3389/fnmol.2018.00405 · Cited by 69
Dendritic spine actin cytoskeleton in autism spectrum disorder
Joensuu, M., Lanoue, V., & Hotulainen, P. (2018) · Progress in Neuro-Psychopharmacology and Biological Psychiatry · doi:10.1016/j.pnpbp.2017.08.023 · Cited by 65
An autism-linked missense mutation in SHANK3 reveals the modularity of Shank3 function
Wang, L., Pang, K., Han, K., Adamski, C. J., Wang, W., He, L.-J., Lai, J. K. H., Bondar, V. V., Duman, J. G., Richman, R., et al. (2019) · Molecular Psychiatry · doi:10.1038/s41380-018-0324-x · Cited by 70
Perets, N., Oron, O., Herman, S., Elliott, E., & Offen, D. (2020) · Molecular Autism · doi:10.1186/s13229-020-00366-x · Cited by 67
Direct current stimulation induces mGluR5‐dependent neocortical plasticity
Sun, Y., Lipton, J. O., Boyle, L. M., Madsen, J. R., Goldenberg, M. C., Pascual‐Leone, Á., Şahin, M., & Rotenberg, A. (2016) · Annals of Neurology · doi:10.1002/ana.24708 · Cited by 65
Grabrucker, S., Proepper, C., Mangus, K., Eckert, M., Chhabra, R., Schmeißer, M. J., Boeckers, T. M., & Grabrucker, A. M. (2014) · Experimental Neurology · doi:10.1016/j.expneurol.2013.12.015 · Cited by 66
Tereshko, L., Gao, Y., Cary, B. A., Turrigiano, G. G., & Sengupta, P. (2021) · eLife · doi:10.7554/elife.65427 · Cited by 60
Fear Extinction Induces mGluR5-Mediated Synaptic and Intrinsic Plasticity in Infralimbic Neurons
Sepulveda-Orengo, M. T., López, A. V., Soler‐Cedeño, O., & Porter, J. T. (2013) · Journal of Neuroscience · doi:10.1523/jneurosci.5198-12.2013 · Cited by 61
MacGillavry, H. D., Kerr, J. M., Kassner, J. D., Frost, N. A., & Blanpied, T. A. (2015) · European Journal of Neuroscience · doi:10.1111/ejn.13129 · Cited by 63
Zinc Stabilizes Shank3 at the Postsynaptic Density of Hippocampal Synapses
Tao-Cheng, J.-H., Toy, D., Winters, C. A., Reese, T. S., & Döṣemeci, A. (2016) · PLoS ONE · doi:10.1371/journal.pone.0153979 · Cited by 59
Chana, G., Laskaris, L., Pantelis, C., Gillett, P., Testa, R., Zantomio, D., Burrows, E. L., Hannan, A. J., Everall, I., & Skafidas, E. S. (2015) · Brain Behavior and Immunity · doi:10.1016/j.bbi.2015.05.009 · Cited by 58
Shank Modulates Postsynaptic Wnt Signaling to Regulate Synaptic Development
Harris, K. P., Akbergenova, Y., Cho, R. W., Baas-Thomas, M. S., & Littleton, J. T. (2016) · Journal of Neuroscience · doi:10.1523/jneurosci.4279-15.2016 · Cited by 55
Neuronal L-Type Calcium Channel Signaling to the Nucleus Requires a Novel CaMKIIα-Shank3 Interaction
Perfitt, T. L., Wang, X., Dickerson, M. T., Stephenson, J. R., Nakagawa, T., Jacobson, D. A., & Colbran, R. J. (2020) · The Journal of Neuroscience · doi:10.1523/jneurosci.0893-19.2020 · Cited by 54
Mameza, M. G., Dvoretskova, E., Bamann, M., Hönck, H., Güler, T., Boeckers, T. M., Schoen, M., Verpelli, C., Sala, C., Barsukov, I., et al. (2013) · Journal of Biological Chemistry · doi:10.1074/jbc.m112.424747 · Cited by 54
Self-citationCocks, G. D., Curran, S. R., Gami‐Patel, P., Uwanogho, D., Jeffries, A. R., Kathuria, A., Lucchesi, W., Wood, V. H. J., Dixon, R., Ogilvie, C. M., et al. (2013) · Psychopharmacology · doi:10.1007/s00213-013-3196-4 · Cited by 49
Guo, W., Molinaro, G., Collins, K. A., Hays, S. A., Paylor, R. E., Worley, P. F., Szumlinski, K. K., & Huber, K. M. (2016) · Journal of Neuroscience · doi:10.1523/jneurosci.2921-15.2016 · Cited by 54
Eisinger, K. R. T., Gross, K. S., Head, B. P., & Mermelstein, P. G. (2018) · Hormones and Behavior · doi:10.1016/j.yhbeh.2018.03.001 · Cited by 50
Absence of strong strain effects in behavioral analyses ofShank3-deficient mice
Drapeau, E., Dorr, N. P., Elder, G. A., & Buxbaum, J. D. (2014) · Disease Models & Mechanisms · doi:10.1242/dmm.013821 · Cited by 55
Klug, J. R., Mathur, B. N., Kash, T. L., Wang, H.-D., Matthews, R. T., Robison, A. J., Anderson, M. E., Deutch, A. Y., Lovinger, D. M., Colbran, R. J., et al. (2012) · PLoS ONE · doi:10.1371/journal.pone.0045323 · Cited by 49
Selective basal ganglia vulnerability to energy deprivation: Experimental and clinical evidences
Tambasco, N., Romoli, M., & Calabresi, P. (2018) · Progress in Neurobiology · doi:10.1016/j.pneurobio.2018.07.003 · Cited by 48
Molecular and synaptic defects in intellectual disability syndromes
Verpelli, C., & Sala, C. (2011) · Current Opinion in Neurobiology · doi:10.1016/j.conb.2011.09.007 · Cited by 55
Self-citationLee, Y., Kim, S. G., Lee, B., Zhang, Y., Kim, Y., Kim, S., Kim, E., Kang, H., & Han, K. (2017) · Frontiers in Molecular Neuroscience · doi:10.3389/fnmol.2017.00201 · Cited by 47
Bipolar affective disorder and early dementia onset in a male patient with SHANK3 deletion
Vucurovic, K., Landais, E., Delahaigue, C., Eutrope, J., Schneider, A., Leroy, C., Kabbaj, H., Motte, J. E., Gaillard, D. A., Rolland, A.-C., et al. (2012) · European Journal of Medical Genetics · doi:10.1016/j.ejmg.2012.07.009 · Cited by 51
Ortiz‐Guerrero, G., González-Reyes, R. E., de‐la‐Torre, A., Medina-Rincón, G. J., & Nava-Mesa, M. O. (2020) · Brain Sciences · doi:10.3390/brainsci10060369 · Cited by 48
Synapse-to-Nucleus Signaling in Neurodegenerative and Neuropsychiatric Disorders
Parra‐Damas, A., & Saura, C. A. (2019) · Biological Psychiatry · doi:10.1016/j.biopsych.2019.01.006 · Cited by 48
Heterogeneity and convergence: the synaptic pathophysiology of autism
Baudouin, S. J. (2014) · European Journal of Neuroscience · doi:10.1111/ejn.12498 · Cited by 45
Convergent evidence for mGluR5 in synaptic and neuroinflammatory pathways implicated in ASD
Zantomio, D., Chana, G., Laskaris, L., Testa, R., Everall, I., Pantelis, C., & Skafidas, E. S. (2015) · Neuroscience & Biobehavioral Reviews · doi:10.1016/j.neubiorev.2015.02.006 · Cited by 48
Breen, M. S., Browne, A., Hoffman, G. E., Stathopoulos, S., Brennand, K., Buxbaum, J. D., & Drapeau, E. (2020) · Molecular Autism · doi:10.1186/s13229-020-00355-0 · Cited by 44
Modulation of behavior by scaffolding proteins of the post-synaptic density
Gao, C., Tronson, N. C., & Radulović, J. (2013) · Neurobiology of Learning and Memory · doi:10.1016/j.nlm.2013.04.014 · Cited by 41
Hagmeyer, S., Sauer, A. K., & Grabrucker, A. M. (2018) · Frontiers in Synaptic Neuroscience · doi:10.3389/fnsyn.2018.00011 · Cited by 43
Lin, C.-W., Chen, C.-Y., Cheng, S., Hu, H., & Hsueh, Y. (2014) · Frontiers in Cellular Neuroscience · doi:10.3389/fncel.2014.00087 · Cited by 42
Altered synaptic ultrastructure in the prefrontal cortex of Shank3-deficient rats
Jacot-Descombes, S., Keshav, N. U., Dickstein, D. L., Wicinski, B., Janssen, W. G. M., Hiester, L. L., Sarfo, E. K., Warda, T., Fam, M. M., Harony-Nicolas, H., et al. (2020) · Molecular Autism · doi:10.1186/s13229-020-00393-8 · Cited by 41
Jin, C., Kang, H., Ryu, J. R., Kim, S., Zhang, Y., Lee, Y., Kim, Y., & Han, K. (2018) · Frontiers in Molecular Neuroscience · doi:10.3389/fnmol.2018.00250 · Cited by 40
Cerebellar Dysfunction, Cerebro-cerebellar Connectivity and Autism Spectrum Disorders
Su, L., Xu, F., Wang, X., Cai, X., & Shen, Y. (2020) · Neuroscience · doi:10.1016/j.neuroscience.2020.05.028 · Cited by 43
Hypothesis‐driven investigations of diverse pharmacological targets in two mouse models of autism
Rhine, M. A., Parrott, J. M., Schultz, M. N., Kazdoba, T. M., & Crawley, J. N. (2019) · Autism Research · doi:10.1002/aur.2066 · Cited by 42
Clinical and Neurobiological Relevance of Current Animal Models of Autism Spectrum Disorders
Kim, K. C., Gonzales, E. L., Lázaro, M. T., Choi, C. S., Bahn, G. H., Yoo, H. J., & Shin, C. Y. (2016) · Biomolecules & Therapeutics · doi:10.4062/biomolther.2016.061 · Cited by 44
SHANK genes in autism: Defining therapeutic targets
Mossa, A., Giona, F., Pagano, J., Sala, C., & Verpelli, C. (2017) · Progress in Neuro-Psychopharmacology and Biological Psychiatry · doi:10.1016/j.pnpbp.2017.11.019 · Cited by 40
Self-citationSchwartzer, J. J., Koenig, C. M., & Berman, R. F. (2012) · Neurotoxicology and Teratology · doi:10.1016/j.ntt.2012.08.007 · Cited by 41
O’Connor, E. C., Bariselli, S., & Bellone, C. (2014) · European Journal of Neuroscience · doi:10.1111/ejn.12510 · Cited by 40
Lutz, A.-K., Arévalo, A. P., Ioannidis, V., Stirmlinger, N., Demestre, M., Delorme, R., Bourgeron, T., & Boeckers, T. M. (2021) · Frontiers in Molecular Neuroscience · doi:10.3389/fnmol.2021.773571 · Cited by 38
Morice, É., Farley, S., Poirier, R., Dallérac, G. M., Chagneau, C., Pannetier, S., Hanauer, A., Davis, S., Vaillend, C., & Laroche, S. (2013) · Neurobiology of Disease · doi:10.1016/j.nbd.2013.05.016 · Cited by 36
Lee, D. K., Li, S. W., Bounni, F., Friedman, G., Jamali, M., Strahs, L., Zeliger, O., Gabrieli, P., Stankovich, M. A., Demaree, J., et al. (2021) · Nature Neuroscience · doi:10.1038/s41593-021-00888-4 · Cited by 33
Xu, J., Marshall, J. J., Kraniotis, S., Nomura, T., Zhu, Y., & Contractor, A. (2021) · Behavioural Brain Research · doi:10.1016/j.bbr.2021.113378 · Cited by 34
Baecker, T., Mangus, K., Pfaender, S., Chhabra, R., Boeckers, T. M., & Grabrucker, A. M. (2014) · BioMetals · doi:10.1007/s10534-014-9764-1 · Cited by 33
Scheefhals, N., Catsburg, L. A. E., Westerveld, M. L., Blanpied, T. A., Hoogenraad, C. C., & MacGillavry, H. D. (2019) · Cell Reports · doi:10.1016/j.celrep.2019.08.102 · Cited by 32
Cammarata-Scalisi, F., Callea, M., Martinelli, D., Willoughby, C. E., Tadich, A. C., Castillo, M. A., Lacruz-Rengel, M. A., Medina, M., Grimaldi, P., Bertini, E., et al. (2022) · Genes · doi:10.3390/genes13030504 · Cited by 35
Glutamatergic candidate genes in autism spectrum disorder: an overview
Chiocchetti, A. G., Bour, H. S., & Freitag, C. M. (2014) · Journal of Neural Transmission · doi:10.1007/s00702-014-1161-y · Cited by 31
Sgadó, P., Provenzano, G., Dassi, E., Adami, V., Zunino, G., Genovesi, S., Casarosa, S., & Bozzi, Y. (2013) · Molecular Autism · doi:10.1186/2040-2392-4-51 · Cited by 31
Liu, C., Peng, X., Hu, C.-C., Li, C., Li, Q., & Xu, X. (2016) · Development Genes and Evolution · doi:10.1007/s00427-016-0561-4 · Cited by 33
A kinome-wide RNAi screen identifies ERK2 as a druggable regulator of Shank3 stability
Wang, L., Adamski, C. J., Bondar, V. V., Craigen, E., Collette, J. R., Pang, K., Han, K., Jain, A., Jung, S. Y., Liu, Z., et al. (2019) · Molecular Psychiatry · doi:10.1038/s41380-018-0325-9 · Cited by 31
mGluR5 in hippocampal CA1 pyramidal neurons mediates stress-induced anxiety-like behavior
Li, X., Du, Z., Xu, J.-N., Liang, Z.-M., Lin, S., Chen, H. H., Li, S.-J., Li, X., Yang, J., & Gao, T. (2023) · Neuropsychopharmacology · doi:10.1038/s41386-023-01548-w · Cited by 30
Shared Etiology in Autism Spectrum Disorder and Epilepsy with Functional Disability
Zahra, A., Wang, Y., Wang, Q., & Wu, J. (2022) · Behavioural Neurology · doi:10.1155/2022/5893519 · Cited by 31
A bidirectional switch in the Shank3 phosphorylation state biases synapses toward up- or downscaling
Wu, C.-H., Tatavarty, V., Beltran, P. M., Guerrero, A., Keshishian, H., Krug, K., MacMullan, M. A., Li, L., Carr, S. A., Cottrell, J. R., et al. (2022) · eLife · doi:10.7554/elife.74277 · Cited by 29
Lee, K., Vyas, Y., Garner, C. C., & Montgomery, J. M. (2019) · Synapse · doi:10.1002/syn.22097 · Cited by 28
Glutamatergic synapse in autism: a complex story for a complex disorder
Galineau, L., Arlicot, N., Dupont, A.-C., Briend, F., Houy‐Durand, E., Tauber, C., Gomot, M., Gissot, V., Barantin, L., Lefèvre, A., et al. (2022) · Molecular Psychiatry · doi:10.1038/s41380-022-01860-9 · Cited by 26
Common Ribs of Inhibitory Synaptic Dysfunction in the Umbrella of Neurodevelopmental Disorders
Rodriguez, R. A., Joya, C., & Hines, R. M. (2018) · Frontiers in Molecular Neuroscience · doi:10.3389/fnmol.2018.00132 · Cited by 25
Identifying Essential Cell Types and Circuits in Autism Spectrum Disorders
Maloney, S. E., Rieger, M. A., & Dougherty, J. D. (2013) · International review of neurobiology · doi:10.1016/b978-0-12-418700-9.00003-4 · Cited by 26
Culotta, L., Scalmani, P., Vinci, E., Terragni, B., Sessa, A., Broccoli, V., Mantegazza, M., Boeckers, T. M., & Verpelli, C. (2020) · Journal of Neuroscience · doi:10.1523/jneurosci.2194-19.2020 · Cited by 25
Self-citation
Metadata
- Authors
- Verpelli, C., Dvoretskova, E., Vicidomini, C., Rossi, F., Chiappalone, M., Schoen, M., Di Stefano, B., Mantegazza, R., Broccoli, V., Böckers, T. M., Dityatev, A., & Sala, C.
- Affiliations
- University of Milan (IT)
- Italian Institute of Technology (IT)
- Universität Ulm (DE)
- Fondazione IRCCS Istituto Neurologico Carlo Besta (IT)
- IRCCS Ospedale San Raffaele (IT)
- Corresponding author
- Sala, Carlo
- ORCID
- Venue
- Journal of Biological Chemistry
- Publisher
- Elsevier BV
- Published
- 2011-10
- Volume
- 286
- Issue
- 40
- Pages
- 34839-34850
- ISSN
- 0021-9258 (ISSN-L)
- PMC
- PMC3186429
- OpenAlex
- W2073501423
- Cited by
- 197
- References
- 70
- Citations by year
- 2026: 4 · 2025: 9 · 2024: 5 · 2023: 15 · 2022: 15 · 2021: 12 · 2020: 13 · 2019: 12 · 2018: 13 · 2017: 9 · 2016: 20 · 2015: 14 · 2014: 15 · 2013: 23 · 2012: 14
- FWCI
- 7.28
- Type
- journal article
- Language
- en
- Open access
- hybrid
- doi.org
- Licence
- Locations
- Journal of Biological Chemistry (publishedVersion, cc-by)
- PubMed Central (publishedVersion, cc-by-nc)
- PubMed (publishedVersion)
- CINECA IRIS Institutial Research Information System (University of Genoa) (submittedVersion)
- Funders
- Fondazione Cariplo
- Istituto Italiano di Tecnologia
- Regione Lombardia
- Topics
- Life Sciences › Neuroscience › Cellular and Molecular Neuroscience › Neuroscience and Neuropharmacology Research
- Life Sciences › Biochemistry, Genetics and Molecular Biology › Genetics › Genetics and Neurodevelopmental Disorders
- Life Sciences › Neuroscience › Cognitive Neuroscience › Autism Spectrum Disorder Research
- Keywords
- SHANK3, metabotropic glutamate receptor 5, postsynaptic density, synaptogenesis, dendritic spines, synaptic plasticity, long-term depression, ERK1/2 phosphorylation, CREB phosphorylation, DHPG, miniature excitatory postsynaptic currents, glutamatergic neurotransmission, positive allosteric modulators, autism spectrum disorder, intellectual disability
- MeSH terms
- Animals, Hippocampus, Mice, Inbred C57BL, Models, Biological, Nerve Tissue Proteins, Neurons, Phosphorylation, Synapses, Signal Transduction, Receptors, N-Methyl-D-Aspartate, Receptors, AMPA, Receptors, Metabotropic Glutamate, Adaptor Proteins, Signal Transducing, Dendritic Spines, Mice, Rats, Receptor, Metabotropic Glutamate 5
About these checks
Registry, retraction, Cites and statistics results are computed, not judged, with one exception: a printed reference that no index lists is read once by a model before it counts as a citation error. Claims are extracted by a model and kept only when their quote appears verbatim in the text; each cited source is then checked, with a model’s help, for whether it says what the claim relies on. Those verdicts can be wrong — read the claim’s quote and the cited source before relying on one.
Statistics and arithmetic are recomputed, not judged.
Confidence bands are shown only for fields calibrated on our annotated test set. None is calibrated yet, so no band is shown.
What counts as a claim ›How we measure confidence ›How we check this ›
Are you an author, or do you see a problem with this page? Request a review
