

The DOI matches its Crossref record; 6 of the 6 references it cites were found in a registry or an index.
Impaired Micro-RNA Pathways Diminish Osteoclast Differentiation and Function
Overview
The claims and statistics of this paper haven’t been checked yet.
Run the check — free, no account needed. It reads the open-access text and checks the sources it cites.
Integrity signals
Registry
Cites
Statistics
Figures
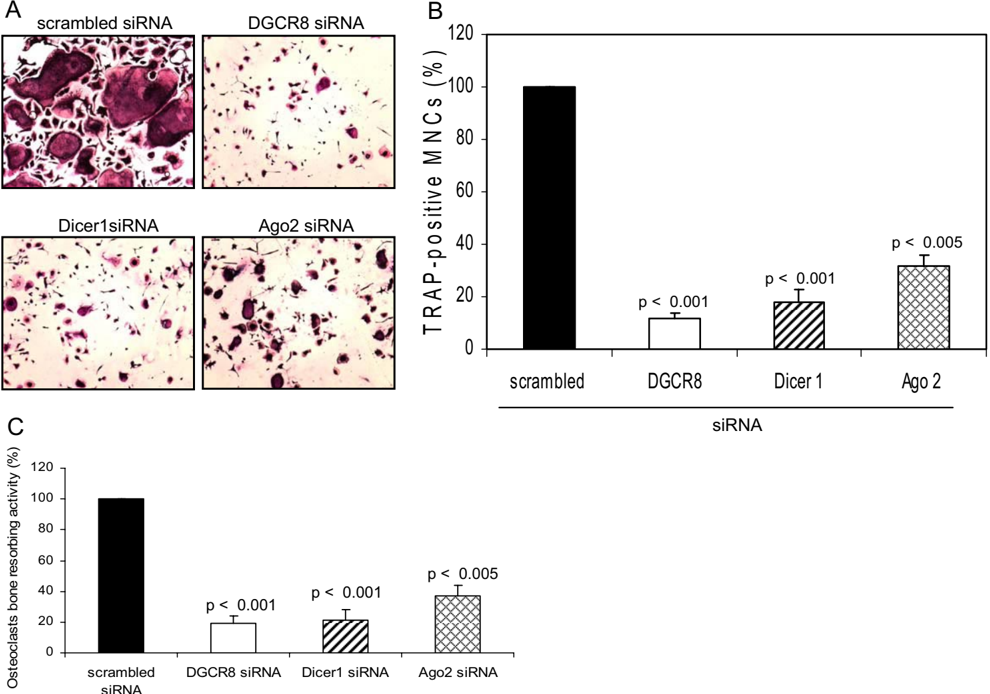
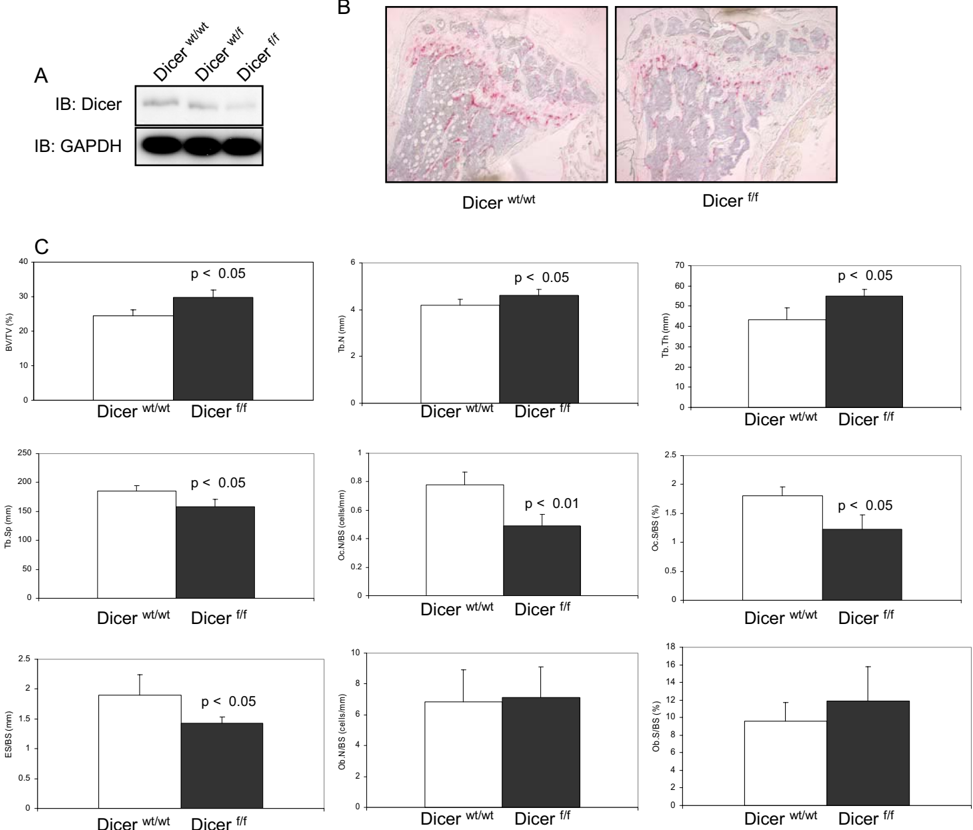
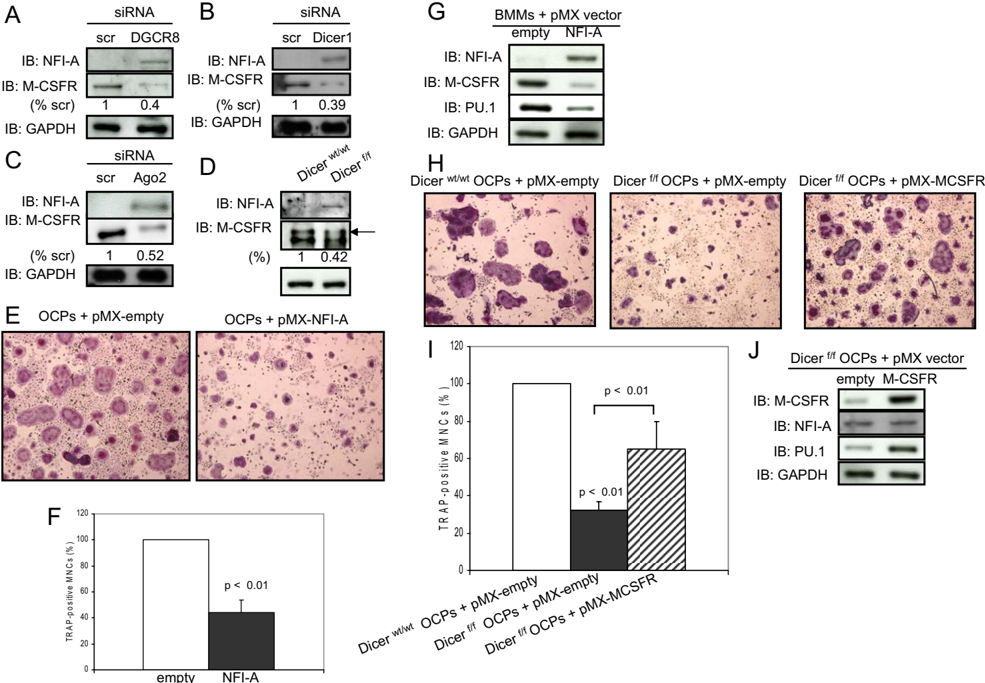
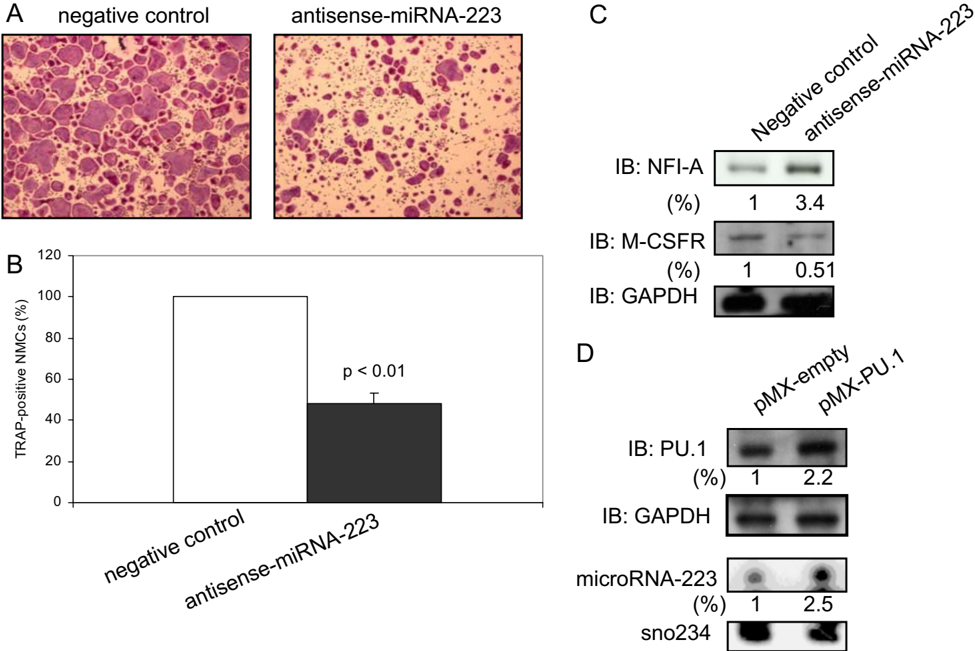
Verification
Claims the paper makes
The claims and statistics of this paper haven’t been checked yet.
Run the check — free, no account needed. It reads the open-access text and checks the sources it cites.
Claims other papers make about this one
Each is checked against this paper’s own text: does it say what the citing paper says it does?
In the citing paper
“At a more global level, impairing mature miR expression by KO of the processing machinery in Dicer-KO experiments revealed miR dependency for HSCs 14 and osteoclast development.15”
From Macrophage development from HSCs requires PU.1-coordinated microRNA expression (2011) · cites this paper as [15]
Self-check
Percentages, sums and reported differences re-computed from the paper’s own numbers.
The self-check needs the paper’s full text.
Citations
Cites
The C. elegans heterochronic gene lin-4 encodes small RNAs with antisense complementarity to lin-14
Lee, R. C., Feinbaum, R. L., & Ambros, V. (1993) · Cell · doi:10.1016/0092-8674(93)90529-y · Cited by 12,948
Taganov, K. D., Boldin, M. P., Chang, K.-J., & Baltimore, D. (2006) · Proceedings of the National Academy of Sciences · doi:10.1073/pnas.0605298103 · Cited by 4,317
Takayanagi, H., Kim, S., Koga, T., Nishina, H., Isshiki, M., Yoshida, H., Saiura, A., Isobe, M., Yokochi, T., Inoue, J.-I., et al. (2002) · Developmental Cell · doi:10.1016/s1534-5807(02)00369-6 · Cited by 2,701
Autoamplification of NFATc1 expression determines its essential role in bone homeostasis
Asagiri, M., Sato, K., Usami, T., Ochi, S., Nishina, H., Yoshida, H., Morita, I., Wagner, E. F., Mak, T. W., Serfling, E., et al. (2005) · The Journal of Experimental Medicine · doi:10.1084/jem.20051150 · Cited by 849
Arai, F., Miyamoto, T., Ohneda, O., Inada, T., Sudo, T., Brasel, K., Miyata, T., Anderson, D. M., & Suda, T. (1999) · The Journal of Experimental Medicine · doi:10.1084/jem.190.12.1741 · Cited by 693
Ishida, N., Hayashi, K., Hoshijima, M., Ogawa, T., Koga, S., Miyatake, Y., Kumegawa, M., Kimura, T., & Takeya, T. (2002) · Journal of Biological Chemistry · doi:10.1074/jbc.m205063200 · Cited by 377
Research works printed but not linked: 43
- Karsenty, 2002, Dev. Cell., 2, 389, 10.1016/S1534-5807(02)00157-0 · DOI
- Tanaka, 2005, Immunol. Rev., 208, 30, 10.1111/j.0105-2896.2005.00327.x · DOI
- Del, 2008, Arch. Biochem. Biophys., 473, 147, 10.1016/j.abb.2008.01.011 · DOI
- Tondravi, 1997, Nature., 386, 81, 10.1038/386081a0 · DOI
- Grigoriadis, 1994, Science., 266, 443, 10.1126/science.7939685 · DOI
- Iotsova, 1997, Nat. Med., 3, 1285, 10.1038/nm1197-1285 · DOI
- Franzoso, 1997, Genes Dev., 11, 3482, 10.1101/gad.11.24.3482 · DOI · Paper page
- Weilbaecher, 2001, Mol. Cell., 8, 749, 10.1016/S1097-2765(01)00360-4 · DOI
- Kim, 2005, Nat. Rev. Mol. Cell. Biol., 6, 376, 10.1038/nrm1644 · DOI · Paper page
- Lagos-Quintana, 2001, Science., 294, 853, 10.1126/science.1064921 · DOI · Paper page
- Lau, 2001, Science., 294, 858, 10.1126/science.1065062 · DOI · Paper page
- Lee, 2001, Science., 294, 862, 10.1126/science.1065329 · DOI · Paper page
- Bushati, 2007, Annu. Rev. Cell Dev. Biol., 23, 175, 10.1146/annurev.cellbio.23.090506.123406 · DOI · Paper page
- Bernstein, 2001, Nature., 409, 363, 10.1038/35053110 · DOI
- Hammond, 2001, Science., 293, 1146, 10.1126/science.1064023 · DOI · Paper page
- Chen, 2004, Science., 303, 83, 10.1126/science.1091903 · DOI · Paper page
- Fukao, 2007, Cell., 129, 617, 10.1016/j.cell.2007.02.048 · DOI · Paper page
- Zhou, 2007, Proc. Natl. Acad. Sci. U. S. A., 104, 7080, 10.1073/pnas.0702409104 · DOI
- Costinean, 2006, Proc. Natl. Acad. Sci. U. S. A., 103, 7024, 10.1073/pnas.0602266103 · DOI
- Sugatani, 2007, J. Cell. Biochem., 101, 996, 10.1002/jcb.21335 · DOI
- Luzi, 2008, J. Bone Miner. Res., 23, 287, 10.1359/jbmr.071011 · DOI
- Mizuno, 2008, Biochem. Biophys. Res. Commun., 368, 267, 10.1016/j.bbrc.2008.01.073 · DOI
- Kobayashi, 2008, Proc. Natl. Acad. Sci. U. S. A., 105, 1949, 10.1073/pnas.0707900105 · DOI
- Takeshita, 2000, J. Bone Miner. Res., 15, 1477, 10.1359/jbmr.2000.15.8.1477 · DOI
- Harfe, 2005, Proc. Natl. Acad. Sci. U. S. A., 102, 10898, 10.1073/pnas.0504834102 · DOI
- Ferron, 2005, Genesis., 41, 138, 10.1002/gene.20108 · DOI
- O'Carroll, 2007, Genes Dev., 21, 1999, 10.1101/gad.1565607 · DOI
- Matsuo, 2004, J. Biol. Chem., 279, 26475, 10.1074/jbc.M313973200 · DOI
- Matsumoto, 2004, J. Biol. Chem., 279, 45969, 10.1074/jbc.M408795200 · DOI · Paper page
- Sundaram, 2007, Exp. Cell Res., 313, 168, 10.1016/j.yexcr.2006.10.001 · DOI
- Crotti, 2006, Gene (Amst.)., 372, 92, 10.1016/j.gene.2005.12.012 · DOI
- Sharma, 2007, J. Biol. Chem., 282, 15921, 10.1074/jbc.M609723200 · DOI
- Hu, 2007, Mol. Cell. Biol., 27, 4018, 10.1128/MCB.01839-06 · DOI · Paper page
- Pang, 2007, Gene (Amst.)., 403, 151, 10.1016/j.gene.2007.08.007 · DOI
- Shen, 2007, Biochim. Biophys. Acta., 1769, 659, 10.1016/j.bbaexp.2007.08.005 · DOI
- Asagiri, 2007, Bone., 40, 251, 10.1016/j.bone.2006.09.023 · DOI · Paper page
- Walsh, 2003, Gene (Amst.)., 307, 111, 10.1016/S0378-1119(03)00449-9 · DOI
- Rosa, 2007, Proc. Natl. Acad. Sci. U. S. A., 104, 19849, 10.1073/pnas.0706963104 · DOI · Paper page
- Kwon, 2005, Biochem. Biophys. Res. Commun., 335, 437, 10.1016/j.bbrc.2005.07.092 · DOI
- Dougall, 1999, Genes Dev., 13, 2412, 10.1101/gad.13.18.2412 · DOI · Paper page
- Diederichs, 2007, Cell., 131, 1097, 10.1016/j.cell.2007.10.032 · DOI
- Gregory, 2005, Cell., 123, 631, 10.1016/j.cell.2005.10.022 · DOI · Paper page
- Vigorito, 2007, Immunity., 27, 847, 10.1016/j.immuni.2007.10.009 · DOI
Cited by
Sorted by citations
Tumor-Induced Osteoclast miRNA Changes as Regulators and Biomarkers of Osteolytic Bone Metastasis
Ell, B., Mercatali, L., Ibrahim, T., Campbell, N., Schwarzenbach, H., Pantel, K., Amadori, D., & Kang, Y. (2013) · Cancer Cell · doi:10.1016/j.ccr.2013.09.008 · Cited by 266
Macrophage development from HSCs requires PU.1-coordinated microRNA expression
Ghani, S., Riemke, P., Schönheit, J., Lenze, D., Stumm, J., Hoogenkamp, M., Lagendijk, A., Heinz, S., Bonifer, C., Bakkers, J., et al. (2011) · Blood · doi:10.1182/blood-2011-02-335141 · Cited by 123
Mouse Cre Models for the Study of Bone Diseases
Dallas, S. L., Xie, Y., Shiflett, L. A., & Ueki, Y. (2018) · Current Osteoporosis Reports · doi:10.1007/s11914-018-0455-7 · Cited by 81
Metadata
- Authors
- Sugatani, T., & Hruska, K. A.
- Venue
- Journal of Biological Chemistry
- Publisher
- Elsevier BV
- Published
- 2009-02
- Volume
- 284
- Issue
- 7
- Pages
- 4667-4678
- ISSN
- 0021-9258
- Cited by
- 196
- References
- 6
- Language
- en
About these checks
Registry, retraction, Cites and statistics results are computed, not judged, with one exception: a printed reference that no index lists is read once by a model before it counts as a citation error. Claims are extracted by a model and kept only when their quote appears verbatim in the text; each cited source is then checked, with a model’s help, for whether it says what the claim relies on. Those verdicts can be wrong — read the claim’s quote and the cited source before relying on one.
Statistics and arithmetic are recomputed, not judged.
Confidence bands are shown only for fields calibrated on our annotated test set. None is calibrated yet, so no band is shown.
What counts as a claim ›How we measure confidence ›How we check this ›
Are you an author, or do you see a problem with this page? Request a review
