Cited by 46

The DOI matches its Crossref record; 10 of the 10 references it cites were found in a registry or an index.

Acetyl-CoA carboxylase 1–dependent lipogenesis promotes autophagy downstream of AMPK

Gross, Angelina S., Zimmermann, Andreas, Pendl, Tobias, Schroeder, Sabrina, Schoenlechner, Hannes, Knittelfelder, Oskar, Lamplmayr, Laura, Santiso, Ana, Aufschnaiter, Andreas, Waltenstorfer, Daniel, Ortonobes Lara, Sandra, Stryeck, Sarah, Kast, Christina, Ruckenstuhl, Christoph, Hofer, Sebastian J., Michelitsch, Birgit, Woelflingseder, Martina, Müller, Rolf, Carmona-Gutierrez, Didac, Madl, Tobias, Büttner, Sabrina, Fröhlich, Kai-Uwe, Shevchenko, Andrej, Eisenberg, Tobias·2019·Journal of Biological Chemistry

Overview

The claims and statistics of this paper haven’t been checked yet.

Run the check — free, no account needed. It reads the open-access text and checks the sources it cites.

A few free checks a day · papers already verified open instantly · results are public

Integrity signals

Registry

Crossref · 10.1074/jbc.ra118.007020

Cites

10 of 10 references verified0 citation errors · 0 not checkable

Statistics

Figures

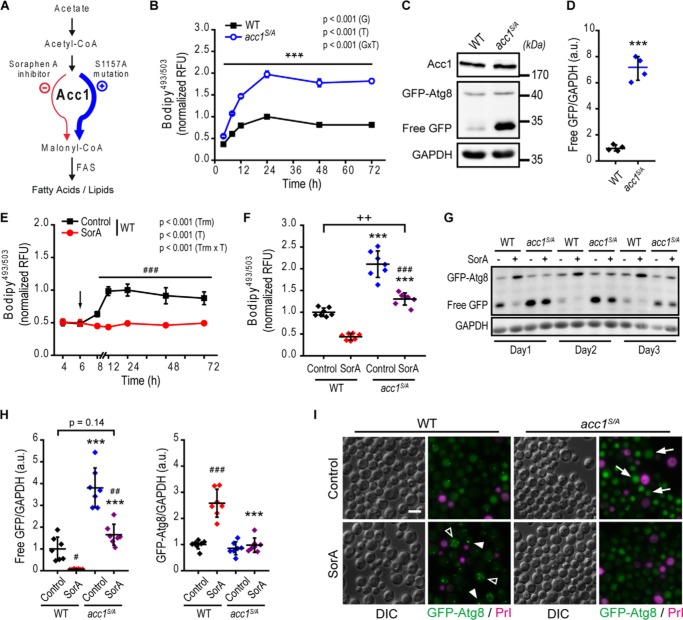
Figure 1. Acc1 activity correlates with autophagy levels. WT and acc1-S1157A mutant (acc1S/A) yeast cells were aged until the indicated time points on 2% glucose minimal medium. SorA or the solvent DMSO was applied 6 h after inoculation where indicated. A, schematic overview of the Acc1-regulated metabolic pathway. Acc1 activity can be modulated by SorA treatment (inhibition, red color) or the S1157A point mutation (activation, blue color). B, flow cytometric quantification of neutral lipids after BODIPY staining in a time course experiment. Relative fluorescence units were normalized to the WT at 24 h (n = 4). C and D, representative immunoblots (C) and quantification of free GFP/GAPDH (D), indicating autophagic flux (GFP liberation assay) of GFP-Atg8–expressing cells after 2 days of aging. Blots were probed with Acc1-, GFP-, or GAPDH-specific antibodies, and immunoblot signals were normalized to the WT. (n = 4). E and F, flow cytometric quantification of neutral lipids after BODIPY staining in a time course experiment (E) or after 24 h of incubation (day 1 of aging) (F). The arrow in E indicates the time of SorA application. Relative fluorescence units were normalized to the WT control at 24 h (n = 4 in E; n = 7 in F). G and H, representative immunoblots (G) and densitometric quantification of free GFP/GAPDH (H, left) or full-length GFP-Atg8/GAPDH levels (H, right) of GFP-Atg8–expressing cells at the indicated age (G) or after 2 days of aging (H). (n = 7). I, representative micrographs of 3-day-old cells according to G and H, demonstrating vacuolar localization of GFP indicative of autophagy (arrows show examples of autophagic cells) or punctate structures of GFP-Atg8. The arrowheads depict examples of cells with presumably enlarged pre-autophagosomal structures (1 fluorescence dot/cell), whereas open arrowheads show cells with accumulated autophagosomes (≥2 fluorescence puncta). Staining with PrI served to exclude dead cells from analysis. Bar, 5 μm. Dot plots show all data points along with the mean (line) ± S.D. (error bar). Line graphs show the mean ± S.D. p values indicate main effects (G, genotype; T, time; GxT, interaction between genotype and time) of a two-way mixed-model ANOVA, with time as repeated measures in B and E, Welch's t test in D, Welch's ANOVA post hoc Games–Howell in H, and ANOVA post hoc Tukey test in F. ***, p < 0.001 (compared with the respective WT); ##, p < 0.01; ###, p < 0.001 (compared with the respective untreated control, Control). FAS, fatty acid synthase; RFU, relative fluorescence units; a.u., arbitrary units.
Figure 1. Acc1 activity correlates with autophagy levels. WT and acc1-S1157A mutant (acc1S/A) yeast cells were aged until the indicated time points on 2% glucose minimal medium. SorA or the solvent DMSO was applied 6 h after inoculation where indicated. A, schematic overview of the Acc1-regulated metabolic pathway. Acc1 activity can be modulated by SorA treatment (inhibition, red color) or the S1157A point mutation (activation, blue color). B, flow cytometric quantification of neutral lipids after BODIPY staining in a time course experiment. Relative fluorescence units were normalized to the WT at 24 h (n = 4). C and D, representative immunoblots (C) and quantification of free GFP/GAPDH (D), indicating autophagic flux (GFP liberation assay) of GFP-Atg8–expressing cells after 2 days of aging. Blots were probed with Acc1-, GFP-, or GAPDH-specific antibodies, and immunoblot signals were normalized to the WT. (n = 4). E and F, flow cytometric quantification of neutral lipids after BODIPY staining in a time course experiment (E) or after 24 h of incubation (day 1 of aging) (F). The arrow in E indicates the time of SorA application. Relative fluorescence units were normalized to the WT control at 24 h (n = 4 in E; n = 7 in F). G and H, representative immunoblots (G) and densitometric quantification of free GFP/GAPDH (H, left) or full-length GFP-Atg8/GAPDH levels (H, right) of GFP-Atg8–expressing cells at the indicated age (G) or after 2 days of aging (H). (n = 7). I, representative micrographs of 3-day-old cells according to G and H, demonstrating vacuolar localization of GFP indicative of autophagy (arrows show examples of autophagic cells) or punctate structures of GFP-Atg8. The arrowheads depict examples of cells with presumably enlarged pre-autophagosomal structures (1 fluorescence dot/cell), whereas open arrowheads show cells with accumulated autophagosomes (≥2 fluorescence puncta). Staining with PrI served to exclude dead cells from analysis. Bar, 5 μm. Dot plots show all data points along with the mean (line) ± S.D. (error bar). Line graphs show the mean ± S.D. p values indicate main effects (G, genotype; T, time; GxT, interaction between genotype and time) of a two-way mixed-model ANOVA, with time as repeated measures in B and E, Welch's t test in D, Welch's ANOVA post hoc Games–Howell in H, and ANOVA post hoc Tukey test in F. ***, p < 0.001 (compared with the respective WT); ##, p < 0.01; ###, p < 0.001 (compared with the respective untreated control, Control). FAS, fatty acid synthase; RFU, relative fluorescence units; a.u., arbitrary units.CC BY · PubMed Central
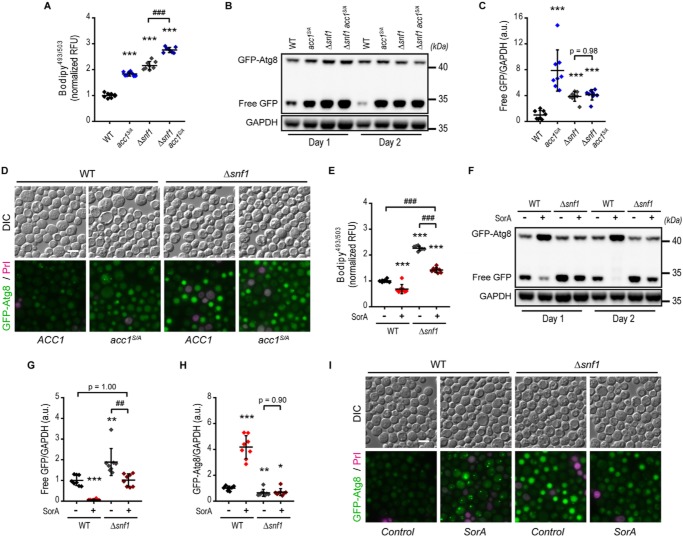
Figure 2. Acc1 mediates autophagy regulation by AMPK under chronological aging conditions. WT or yeast AMPKα subunit SNF1-deleted cells (Δsnf1) combined with or without the acc1-S1157A mutation (acc1S/A) were aged for 2 days on inositol-supplemented 2% glucose minimal medium. SorA or the solvent DMSO was applied to cultures 6 h after inoculation where indicated. A, flow cytometric quantification of neutral lipids after BODIPY staining. Relative fluorescence units were normalized to the WT (n = 8). B and C, representative immunoblots (B) and densitometric quantification of free GFP/GAPDH (C) of GFP-Atg8–expressing cells. (n = 8). D, representative micrographs of GFP-Atg8–expressing cells according to A–C demonstrating vacuolar localization of GFP indicative of autophagy. Staining with PrI served to exclude dead cells from analysis. Bar, 5 μm. E, flow cytometric quantification of neutral lipids after BODIPY staining of cells with or without SorA treatment. Relative fluorescence units were normalized to the WT control (n = 8). F–H, representative immunoblots (F) and densitometric quantification of free GFP/GAPDH (G) or full-length GFP-Atg8/GAPDH levels (H) of GFP-Atg8–expressing cells with or without treatment with SorA (n = 8). I, representative micrographs of cells according to E–H. PrI served to exclude dead cells from analysis. Bar, 5 μm. Dot plots show all data points along with the mean (line) ± S.D. (error bar) ANOVA post hoc Tukey test is shown in A, C, E, G, and H. *, p < 0.05; **, p < 0.01; ***, p < 0.001 (compared with the respective WT); ##, p < 0.01; ###, p < 0.001 (comparison as indicated). RFU, relative fluorescence units; a.u., arbitrary units.
Figure 2. Acc1 mediates autophagy regulation by AMPK under chronological aging conditions. WT or yeast AMPKα subunit SNF1-deleted cells (Δsnf1) combined with or without the acc1-S1157A mutation (acc1S/A) were aged for 2 days on inositol-supplemented 2% glucose minimal medium. SorA or the solvent DMSO was applied to cultures 6 h after inoculation where indicated. A, flow cytometric quantification of neutral lipids after BODIPY staining. Relative fluorescence units were normalized to the WT (n = 8). B and C, representative immunoblots (B) and densitometric quantification of free GFP/GAPDH (C) of GFP-Atg8–expressing cells. (n = 8). D, representative micrographs of GFP-Atg8–expressing cells according to A–C demonstrating vacuolar localization of GFP indicative of autophagy. Staining with PrI served to exclude dead cells from analysis. Bar, 5 μm. E, flow cytometric quantification of neutral lipids after BODIPY staining of cells with or without SorA treatment. Relative fluorescence units were normalized to the WT control (n = 8). F–H, representative immunoblots (F) and densitometric quantification of free GFP/GAPDH (G) or full-length GFP-Atg8/GAPDH levels (H) of GFP-Atg8–expressing cells with or without treatment with SorA (n = 8). I, representative micrographs of cells according to E–H. PrI served to exclude dead cells from analysis. Bar, 5 μm. Dot plots show all data points along with the mean (line) ± S.D. (error bar) ANOVA post hoc Tukey test is shown in A, C, E, G, and H. *, p < 0.05; **, p < 0.01; ***, p < 0.001 (compared with the respective WT); ##, p < 0.01; ###, p < 0.001 (comparison as indicated). RFU, relative fluorescence units; a.u., arbitrary units.CC BY · PubMed Central
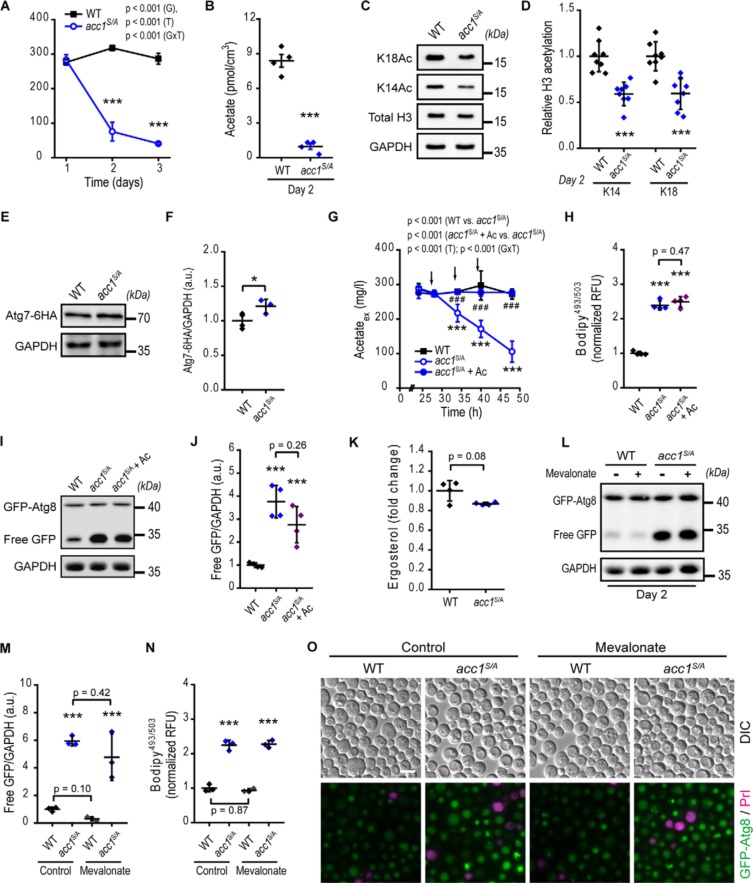
Figure 3. Acc1 activation stimulates autophagy in concert with changes in acetate/acetyl-CoA metabolism. WT or acc1-S1157A mutant (acc1S/A) yeast cells with or without supplementation of acetate or mevalonate as indicated were aged to the indicated time points. A and B, extracellular (A) and intracellular (B) acetate quantified by NMR from medium samples and cell extracts, respectively (n = 4). C and D, representative immunoblots (C) and densitometric quantification (D) of histone H3 lysine acetylation after 2 days of aging. Blots were probed with acetylated lysine 14 (K14Ac) or 18 (K18Ac) specific antibodies or antibodies reacting to total H3 or GAPDH, which served as loading control (n = 11–12 for K14Ac, n = 8 for K18Ac). E and F, representative immunoblots (E) and quantification (F) of C-terminally 6×HA-tagged Atg7 (Atg7-HA) using HA-specific antibodies. GAPDH served as loading control (n = 3–4). G and H, extracellular (culture supernatant) acetate (G) and flow cytometric quantification of neutral lipids after BODIPY staining (H), obtained from cultures receiving three consecutive additions of 100 mg/liter acetate to the medium (+ Ac). Arrows depict the times of acetate supplementation at 28, 34, and 40 h of incubation (n = 4). I and J, representative immunoblots of GFP-Atg8–expressing cells (I) and quantification of free GFP/GAPDH levels (J) by densitometry, after 2 days of aging according to G and H (n = 4). K, relative ergosterol levels (WT-normalized) quantified from shotgun MS-based lipidomics of lipid cell extracts (n = 4). L–N, representative immunoblots (L), densitometric quantification of free GFP/GAPDH (M), and neutral lipids after BODIPY staining (N) of GFP-Atg8–expressing cells after 2 days of aging and treatment with mevalonate (n = 8). O, representative micrographs of 2-day-old GFP-Atg8–expressing cells after mevalonate treatment. Staining with PrI served to exclude dead cells from analysis. Bar, 5 μm. Line graphs show means ± S.D. (error bars). Dot plots show all data points along with the mean (line) ± S.D. p values indicate main effects (genotype (G), time (T), and interaction between genotype and time (GxT)) of a two-way mixed-model ANOVA, with time as repeated measures in A and G. Welch's t test is used in B, D, F, and K, and ANOVA post hoc Tukey test is used in H, J, M, and N. *, p < 0.05; ***, p < 0.001 (compared with the WT); ###, p < 0.001 (compared with acc1S/A). RFU, relative fluorescence units; a.u., arbitrary units.
Figure 3. Acc1 activation stimulates autophagy in concert with changes in acetate/acetyl-CoA metabolism. WT or acc1-S1157A mutant (acc1S/A) yeast cells with or without supplementation of acetate or mevalonate as indicated were aged to the indicated time points. A and B, extracellular (A) and intracellular (B) acetate quantified by NMR from medium samples and cell extracts, respectively (n = 4). C and D, representative immunoblots (C) and densitometric quantification (D) of histone H3 lysine acetylation after 2 days of aging. Blots were probed with acetylated lysine 14 (K14Ac) or 18 (K18Ac) specific antibodies or antibodies reacting to total H3 or GAPDH, which served as loading control (n = 11–12 for K14Ac, n = 8 for K18Ac). E and F, representative immunoblots (E) and quantification (F) of C-terminally 6×HA-tagged Atg7 (Atg7-HA) using HA-specific antibodies. GAPDH served as loading control (n = 3–4). G and H, extracellular (culture supernatant) acetate (G) and flow cytometric quantification of neutral lipids after BODIPY staining (H), obtained from cultures receiving three consecutive additions of 100 mg/liter acetate to the medium (+ Ac). Arrows depict the times of acetate supplementation at 28, 34, and 40 h of incubation (n = 4). I and J, representative immunoblots of GFP-Atg8–expressing cells (I) and quantification of free GFP/GAPDH levels (J) by densitometry, after 2 days of aging according to G and H (n = 4). K, relative ergosterol levels (WT-normalized) quantified from shotgun MS-based lipidomics of lipid cell extracts (n = 4). L–N, representative immunoblots (L), densitometric quantification of free GFP/GAPDH (M), and neutral lipids after BODIPY staining (N) of GFP-Atg8–expressing cells after 2 days of aging and treatment with mevalonate (n = 8). O, representative micrographs of 2-day-old GFP-Atg8–expressing cells after mevalonate treatment. Staining with PrI served to exclude dead cells from analysis. Bar, 5 μm. Line graphs show means ± S.D. (error bars). Dot plots show all data points along with the mean (line) ± S.D. p values indicate main effects (genotype (G), time (T), and interaction between genotype and time (GxT)) of a two-way mixed-model ANOVA, with time as repeated measures in A and G. Welch's t test is used in B, D, F, and K, and ANOVA post hoc Tukey test is used in H, J, M, and N. *, p < 0.05; ***, p < 0.001 (compared with the WT); ###, p < 0.001 (compared with acc1S/A). RFU, relative fluorescence units; a.u., arbitrary units.CC BY · PubMed Central
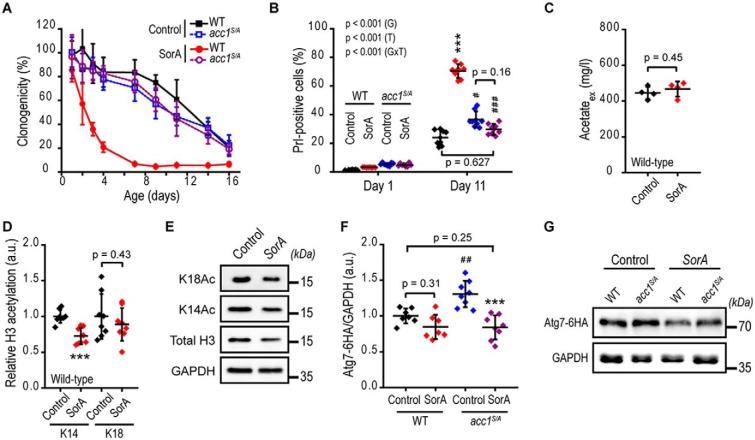
Figure 4. Inhibition of Acc1 accelerates aging without alterations in acetate/acetyl-CoA metabolism. WT and acc1-S1157A mutant (acc1S/A) yeast cells with or without SorA treatment were aged until the indicated time points on 2% glucose minimal medium. A, survival analysis of chronologically aging yeast assessed by cfu (clonogenicity) (n = 8). B, cell death assessed by PrI staining (PrI-positive cells) of cells according to A and quantified using flow cytometry (n = 8). C, extracellular acetate quantified enzymatically from culture supernatants (n = 4). D and E, densitometry-based quantification (D) and representative immunoblots (E) of histone H3 lysine 14 (K14) or 18 (K18) acetylation in WT cells (with and without SorA treatment) after 2 days of aging (n = 8). F and G, quantification (F) of C-terminally 6×HA-tagged Atg7 (Atg7–6HA) after 2 days of aging normalized to GAPDH by densitometry of immunoblots representatively shown in G (n = 7–8). Line graphs show means ± S.D. (error bars). Dot plots show all data points along with the mean (line) ± S.D. p values indicate main effects (time (T), genotype (G), and respective interactions (GxT)) of a two-way mixed-model ANOVA with time as repeated measures in B. ANOVA post hoc Tukey test is used in F, and Welch's t test is used in C and D. ***, p < 0.001 (compared with the respective untreated control; Control); #, p < 0.05; ##, p < 0.01; ###, p < 0.001 (compared with the respective WT). a.u., arbitrary units.
Figure 4. Inhibition of Acc1 accelerates aging without alterations in acetate/acetyl-CoA metabolism. WT and acc1-S1157A mutant (acc1S/A) yeast cells with or without SorA treatment were aged until the indicated time points on 2% glucose minimal medium. A, survival analysis of chronologically aging yeast assessed by cfu (clonogenicity) (n = 8). B, cell death assessed by PrI staining (PrI-positive cells) of cells according to A and quantified using flow cytometry (n = 8). C, extracellular acetate quantified enzymatically from culture supernatants (n = 4). D and E, densitometry-based quantification (D) and representative immunoblots (E) of histone H3 lysine 14 (K14) or 18 (K18) acetylation in WT cells (with and without SorA treatment) after 2 days of aging (n = 8). F and G, quantification (F) of C-terminally 6×HA-tagged Atg7 (Atg7–6HA) after 2 days of aging normalized to GAPDH by densitometry of immunoblots representatively shown in G (n = 7–8). Line graphs show means ± S.D. (error bars). Dot plots show all data points along with the mean (line) ± S.D. p values indicate main effects (time (T), genotype (G), and respective interactions (GxT)) of a two-way mixed-model ANOVA with time as repeated measures in B. ANOVA post hoc Tukey test is used in F, and Welch's t test is used in C and D. ***, p < 0.001 (compared with the respective untreated control; Control); #, p < 0.05; ##, p < 0.01; ###, p < 0.001 (compared with the respective WT). a.u., arbitrary units.CC BY · PubMed Central
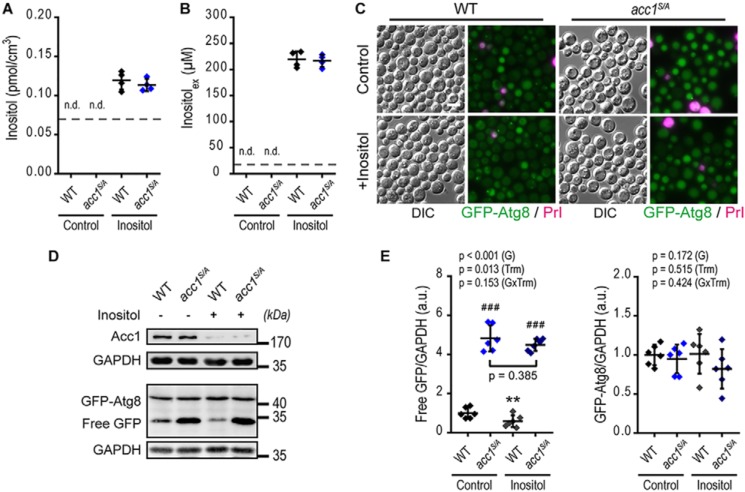
Figure 5. Acc1 promotes autophagy independent of inositol availability. WT or acc1-S1157A mutant (acc1S/A) yeast cells were aged on 2% glucose minimal medium and supplemented with extra 750 μm inositol (Inositol) or the solvent water (Control). A and B, intracellular (A) and extracellular (B) inositol quantified by NMR from cell extracts and culture supernatants, respectively, after 2 days of aging. (n = 4). C–E, representative micrographs (C), immunoblots (D), and densitometric quantification of free GFP (E, left) or full-length GFP-Atg8 (E, right) normalized to GAPDH of GFP-Atg8–expressing cells after 2 days of aging. Bar, 5 μm (n = 6). Dot plots show all data points along with the mean (line) ± S.D. (error bar). Dashed lines depict the lower limit of detection in A and B. p values indicate main effects (genotype (G), treatment (Trm), and interaction between genotype and treatment (GxTrm)) of a two-way ANOVA in E. **, p < 0.01 (compared with the respective untreated control; Control); ###, p < 0.001 (compared with the respective WT). n.d., not detectable. a.u., arbitrary units.
Figure 5. Acc1 promotes autophagy independent of inositol availability. WT or acc1-S1157A mutant (acc1S/A) yeast cells were aged on 2% glucose minimal medium and supplemented with extra 750 μm inositol (Inositol) or the solvent water (Control). A and B, intracellular (A) and extracellular (B) inositol quantified by NMR from cell extracts and culture supernatants, respectively, after 2 days of aging. (n = 4). C–E, representative micrographs (C), immunoblots (D), and densitometric quantification of free GFP (E, left) or full-length GFP-Atg8 (E, right) normalized to GAPDH of GFP-Atg8–expressing cells after 2 days of aging. Bar, 5 μm (n = 6). Dot plots show all data points along with the mean (line) ± S.D. (error bar). Dashed lines depict the lower limit of detection in A and B. p values indicate main effects (genotype (G), treatment (Trm), and interaction between genotype and treatment (GxTrm)) of a two-way ANOVA in E. **, p < 0.01 (compared with the respective untreated control; Control); ###, p < 0.001 (compared with the respective WT). n.d., not detectable. a.u., arbitrary units.CC BY · PubMed Central
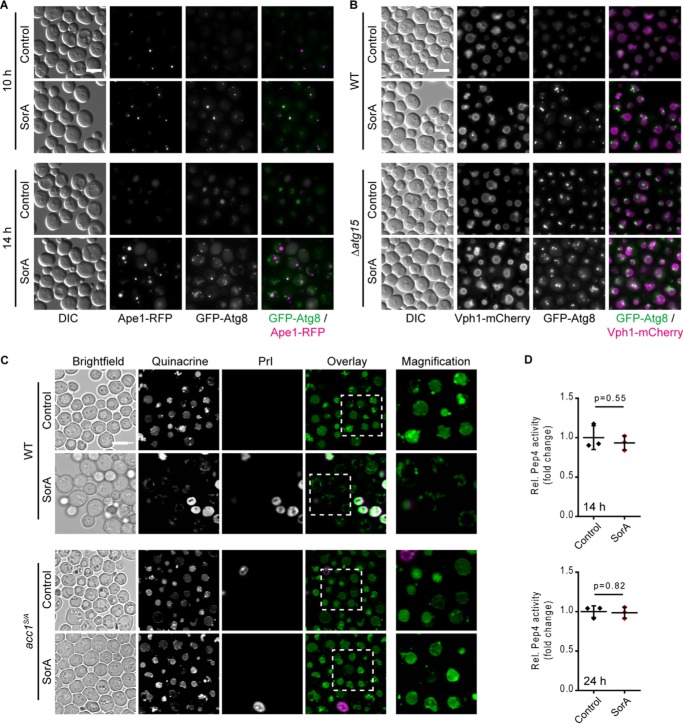
Figure 6. Acc1 inhibition disrupts autophagosome–vacuole fusion and vacuolar acidification. WT and acc1-S1157A mutant (acc1S/A) yeast cells were aged until the indicated time points on 2% glucose minimal medium. SorA or the solvent DMSO was applied to cultures 6 h after inoculation. A, representative micrographs of WT cells expressing GFP-Atg8 and the PAS marker Ape1-RFP after 10 or 14 h of incubation with SorA. Bar, 5 μm. B, representative micrographs of WT or ATG15 deletion mutant (Δatg15) cells expressing GFP-Atg8 and the vacuolar membrane marker Vph1-mCherry after 14 h of incubation with SorA. Bar, 5 μm. C, representative micrographs of cells stained with the vacuolar acidity indicator quinacrine after 24 h of incubation (day 1). Staining with PrI served to exclude dead cells from analysis. Bar, 5 μm. D, in vitro activity of the vacuolar protease Pep4 in whole-cell extracts at 14 h (top) or 24 h (bottom) after inoculation. Relative Pep4 activity was normalized to the WT (n = 3). Dot plots show all data points along with the mean (line) ± S.D. (error bar). Welch's t test is used in D.
Figure 6. Acc1 inhibition disrupts autophagosome–vacuole fusion and vacuolar acidification. WT and acc1-S1157A mutant (acc1S/A) yeast cells were aged until the indicated time points on 2% glucose minimal medium. SorA or the solvent DMSO was applied to cultures 6 h after inoculation. A, representative micrographs of WT cells expressing GFP-Atg8 and the PAS marker Ape1-RFP after 10 or 14 h of incubation with SorA. Bar, 5 μm. B, representative micrographs of WT or ATG15 deletion mutant (Δatg15) cells expressing GFP-Atg8 and the vacuolar membrane marker Vph1-mCherry after 14 h of incubation with SorA. Bar, 5 μm. C, representative micrographs of cells stained with the vacuolar acidity indicator quinacrine after 24 h of incubation (day 1). Staining with PrI served to exclude dead cells from analysis. Bar, 5 μm. D, in vitro activity of the vacuolar protease Pep4 in whole-cell extracts at 14 h (top) or 24 h (bottom) after inoculation. Relative Pep4 activity was normalized to the WT (n = 3). Dot plots show all data points along with the mean (line) ± S.D. (error bar). Welch's t test is used in D.CC BY · PubMed Central
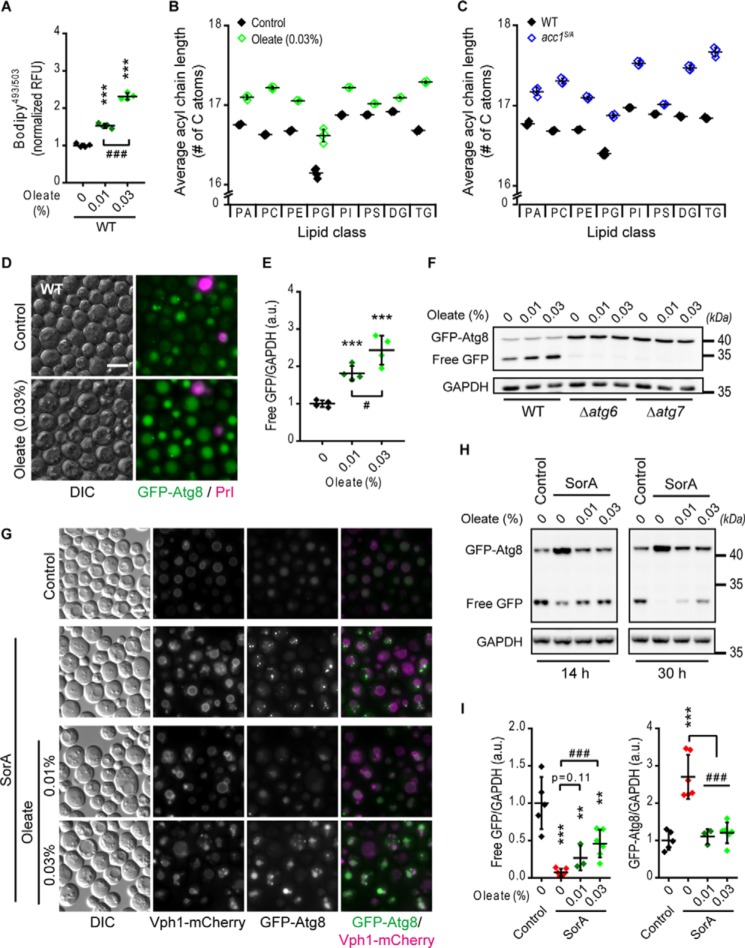
Figure 7. Supplementation of oleic acid partly mimics acc1S/A mutation and overrides SorA treatment. WT yeast cells were supplemented with 0.01 or 0.03% (w/v) oleate or the solvent tergitol (Control) 6 h after inoculation and aged until the indicated time points on 2% glucose minimal medium. SorA or the solvent DMSO was applied to cultures 6 h after inoculation where indicated. A, flow cytometric quantification of neutral lipids after BODIPY staining of 2-day-old WT cells supplemented with oleate. Relative fluorescence units (RFU) were normalized to the WT control (n = 4). B and C, average acyl chain length of different classes of glycerolipids calculated from the lipidomic profiles according to Fig. S7 (A and B). B and C, the effects of 0.03% (w/v) oleate treatment (Oleate) (B) and of the acc1-S1157A mutation (acc1S/A) (C) compared with the respective solvent-treated (Control) or WT controls, respectively (n = 4). D, representative micrographs of 2-day-old GFP-Atg8–expressing WT cells supplemented with 0.03% (w/v) oleate. Bar, 5 μm. E, quantification of free GFP/GAPDH in WT cells from immunoblots representatively shown in E. Data were normalized to the solvent control (n = 4). F, representative immunoblots of 2-day-old GFP-Atg8–expressing WT, Δatg6, or Δatg7 cells. G, representative micrographs of cells expressing GFP-Atg8 and the vacuolar membrane marker Vph1-mCherry 30 h after inoculation (day 1). Bar, 5 μm. H and I, representative immunoblots (H) and densitometric quantification of free GFP/GAPDH (I, left) or full-length GFP-Atg8/GAPDH levels (I, right) of GFP-Atg8–expressing cells at 8 or 30 h after inoculation (n = 8). Dot plots show all data points along with the mean (line) ± S.D. (error bar). ANOVA post hoc Tukey test is used in A, E, and I. ***, p < 0.001 (compared with the respective untreated control); #, p < 0.05; ###, p < 0.001 (comparison as indicated). a.u., arbitrary units.
Figure 7. Supplementation of oleic acid partly mimics acc1S/A mutation and overrides SorA treatment. WT yeast cells were supplemented with 0.01 or 0.03% (w/v) oleate or the solvent tergitol (Control) 6 h after inoculation and aged until the indicated time points on 2% glucose minimal medium. SorA or the solvent DMSO was applied to cultures 6 h after inoculation where indicated. A, flow cytometric quantification of neutral lipids after BODIPY staining of 2-day-old WT cells supplemented with oleate. Relative fluorescence units (RFU) were normalized to the WT control (n = 4). B and C, average acyl chain length of different classes of glycerolipids calculated from the lipidomic profiles according to Fig. S7 (A and B). B and C, the effects of 0.03% (w/v) oleate treatment (Oleate) (B) and of the acc1-S1157A mutation (acc1S/A) (C) compared with the respective solvent-treated (Control) or WT controls, respectively (n = 4). D, representative micrographs of 2-day-old GFP-Atg8–expressing WT cells supplemented with 0.03% (w/v) oleate. Bar, 5 μm. E, quantification of free GFP/GAPDH in WT cells from immunoblots representatively shown in E. Data were normalized to the solvent control (n = 4). F, representative immunoblots of 2-day-old GFP-Atg8–expressing WT, Δatg6, or Δatg7 cells. G, representative micrographs of cells expressing GFP-Atg8 and the vacuolar membrane marker Vph1-mCherry 30 h after inoculation (day 1). Bar, 5 μm. H and I, representative immunoblots (H) and densitometric quantification of free GFP/GAPDH (I, left) or full-length GFP-Atg8/GAPDH levels (I, right) of GFP-Atg8–expressing cells at 8 or 30 h after inoculation (n = 8). Dot plots show all data points along with the mean (line) ± S.D. (error bar). ANOVA post hoc Tukey test is used in A, E, and I. ***, p < 0.001 (compared with the respective untreated control); #, p < 0.05; ###, p < 0.001 (comparison as indicated). a.u., arbitrary units.CC BY · PubMed Central
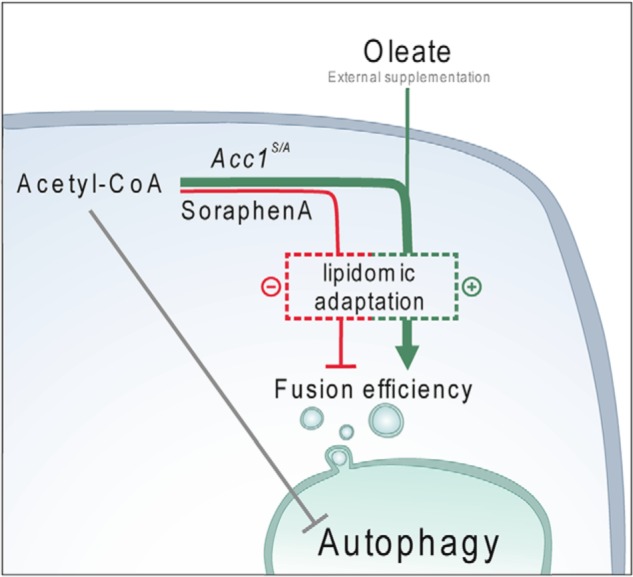
Figure 8. Metabolic alterations orchestrate Acc1-dependent autophagy. A scheme depicts a working model of how Acc1-dependent lipogenesis drives autophagy in aging cells. Upon Acc1 activation (or after supplementation of oleic acid), increased production of fatty acids and associated lipidomic alterations result in increased autophagic flux. In addition, autophagic activity may be co-regulated by acetate/acetyl-CoA availability upstream of Acc1's metabolic reaction. Mechanistically, Acc1-dependent metabolic consequences provide a cellular lipid profile that facilitates vacuolar fusion capacity and thus allows completion of the autophagic cascade.
Figure 8. Metabolic alterations orchestrate Acc1-dependent autophagy. A scheme depicts a working model of how Acc1-dependent lipogenesis drives autophagy in aging cells. Upon Acc1 activation (or after supplementation of oleic acid), increased production of fatty acids and associated lipidomic alterations result in increased autophagic flux. In addition, autophagic activity may be co-regulated by acetate/acetyl-CoA availability upstream of Acc1's metabolic reaction. Mechanistically, Acc1-dependent metabolic consequences provide a cellular lipid profile that facilitates vacuolar fusion capacity and thus allows completion of the autophagic cascade.CC BY · PubMed Central

Verification

Claims the paper makes

The claims and statistics of this paper haven’t been checked yet.

Run the check — free, no account needed. It reads the open-access text and checks the sources it cites.

A few free checks a day · papers already verified open instantly · results are public

Claims other papers make about this one

Each is checked against this paper’s own text: does it say what the citing paper says it does?

Self-check

Percentages, sums and reported differences re-computed from the paper’s own numbers.

The self-check needs the paper’s full text.

Citations

Cites

Research works printed but not linked: 93

  1. Mercken, 2012, Of mice and men: the benefits of caloric restriction, exercise, and mimetics, Ageing Res. Rev, 11, 390, 10.1016/j.arr.2011.11.005 · DOI · Paper page
  2. Rubinsztein, 2011, Autophagy and aging, Cell, 146, 682, 10.1016/j.cell.2011.07.030 · DOI · Paper page
  3. López-Otín, 2016, Metabolic control of longevity, Cell, 166, 802, 10.1016/j.cell.2016.07.031 · DOI · Paper page
  4. Yin, 2016, Autophagy: machinery and regulation, Microb. Cell, 3, 588, 10.15698/mic2016.12.546 · DOI
  5. Galluzzi, 2014, Metabolic control of autophagy, Cell, 159, 1263, 10.1016/j.cell.2014.11.006 · DOI · Paper page
  6. Schroeder, 2014, Metabolites in aging and autophagy, Microb. Cell, 1, 110, 10.15698/mic2014.04.142 · DOI
  7. Dall'Armi, 2013, The role of lipids in the control of autophagy, Curr. Biol, 23, R33, 10.1016/j.cub.2012.10.041 · DOI
  8. Longo, 2012, Replicative and chronological aging in Saccharomyces cerevisiae, Cell Metab, 16, 18, 10.1016/j.cmet.2012.06.002 · DOI · Paper page
  9. Zimmermann, 2018, Yeast as a tool to identify anti-aging compounds, FEMS Yeast Res, 10.1093/femsyr/foy020 · DOI
  10. Carmona-Gutierrez, 2014, The many ways to age for a single yeast cell, Yeast, 31, 289, 10.1002/yea.3020 · DOI
  11. Postnikoff, 2017, The integrated stress response in budding yeast lifespan extension, Microb. Cell, 4, 368, 10.15698/mic2017.11.597 · DOI
  12. Eisenberg, 2014, Lipids and cell death in yeast, FEMS Yeast Res, 14, 179, 10.1111/1567-1364.12105 · DOI
  13. Henry, 2014, The response to inositol: regulation of glycerolipid metabolism and stress response signaling in yeast, Chem. Phys. Lipids, 180, 23, 10.1016/j.chemphyslip.2013.12.013 · DOI
  14. Klug, 2014, Yeast lipid metabolism at a glance, FEMS Yeast Res, 14, 369, 10.1111/1567-1364.12141 · DOI · Paper page
  15. Shpilka, 2015, Lipid droplets and their component triglycerides and steryl esters regulate autophagosome biogenesis, EMBO J, 34, 2117, 10.15252/embj.201490315 · DOI
  16. Li, 2015, Storage lipid synthesis is necessary for autophagy induced by nitrogen starvation, FEBS Lett, 589, 269, 10.1016/j.febslet.2014.11.050 · DOI
  17. Régnacq, 2016, Increased fatty acid synthesis inhibits nitrogen starvation-induced autophagy in lipid droplet-deficient yeast, Biochem. Biophys. Res. Commun, 477, 33, 10.1016/j.bbrc.2016.06.017 · DOI
  18. Velázquez, 2016, Lipid droplet–mediated ER homeostasis regulates autophagy and cell survival during starvation, J. Cell Biol, 212, 621, 10.1083/jcb.201508102 · DOI
  19. Velázquez, 2016, Autophagy regulation depends on ER homeostasis controlled by lipid droplets, Autophagy, 12, 1409, 10.1080/15548627.2016.1190074 · DOI
  20. Hasslacher, 1993, Acetyl-CoA carboxylase from yeast is an essential enzyme and is regulated by factors that control phospholipid metabolism, J. Biol. Chem, 268, 10946, 10.1016/S0021-9258(18)82077-4 · DOI
  21. Hofbauer, 2014, Regulation of gene expression through a transcriptional repressor that senses acyl-chain length in membrane phospholipids, Dev. Cell, 29, 729, 10.1016/j.devcel.2014.04.025 · DOI
  22. Shi, 2014, Improving production of malonyl coenzyme A-derived metabolites by abolishing Snf1-dependent regulation of Acc1, mBio, 5, e01130, 10.1128/mBio.01130-14 · DOI
  23. Gossing, 2018, Impact of forced fatty acid synthesis on metabolism and physiology of Saccharomyces cerevisiae, FEMS Yeast Res, 10.1093/femsyr/foy096 · DOI
  24. Wang, 2014, A sterol-enriched vacuolar microdomain mediates stationary phase lipophagy in budding yeast, J. Cell Biol, 206, 357, 10.1083/jcb.201404115 · DOI
  25. van Zutphen, 2014, Lipid droplet autophagy in the yeast Saccharomyces cerevisiae, Mol. Biol. Cell, 25, 290, 10.1091/mbc.e13-08-0448 · DOI
  26. Seo, 2017, AMPK and vacuole-associated Atg14p orchestrate μ-lipophagy for energy production and long-term survival under glucose starvation, eLife, 6, e21690, 10.7554/eLife.21690 · DOI
  27. Graef, 2018, Lipid droplet-mediated lipid and protein homeostasis in budding yeast, FEBS Lett, 592, 1291, 10.1002/1873-3468.12996 · DOI · Paper page
  28. Kurat, 2009, Cdk1/Cdc28-dependent activation of the major triacylglycerol lipase Tgl4 in yeast links lipolysis to cell-cycle progression, Mol. Cell, 33, 53, 10.1016/j.molcel.2008.12.019 · DOI
  29. Eisenberg, 2014, Nucleocytosolic depletion of the energy metabolite acetyl-coenzyme a stimulates autophagy and prolongs lifespan, Cell Metab, 19, 431, 10.1016/j.cmet.2014.02.010 · DOI · Paper page
  30. Galdieri, 2012, Acetyl-CoA carboxylase regulates global histone acetylation, J. Biol. Chem, 287, 23865, 10.1074/jbc.M112.380519 · DOI
  31. Wolinski, 2015, Microscopic and spectroscopic techniques to investigate lipid droplet formation and turnover in yeast, Methods Mol. Biol, 1270, 289, 10.1007/978-1-4939-2309-0_21 · DOI
  32. Shintani, 2004, Cargo proteins facilitate the formation of transport vesicles in the cytoplasm to vacuole targeting pathway, J. Biol. Chem, 279, 29889, 10.1074/jbc.M404399200 · DOI
  33. Kainz, 2017, Methods to assess autophagy and chronological aging in yeast, Methods Enzymol, 588, 367, 10.1016/bs.mie.2016.09.086 · DOI
  34. Vahlensieck, 1994, Identification of the yeast ACC1 gene product (acetyl-CoA carboxylase) as the target of the polyketide fungicide soraphen A, Curr. Genet, 25, 95, 10.1007/BF00309532 · DOI
  35. Delorme-Axford, 2018, Transcriptional and post-transcriptional regulation of autophagy in the yeast Saccharomyces cerevisiae, J. Biol. Chem, 293, 5396, 10.1074/jbc.R117.804641 · DOI
  36. Noda, 2008, The Quantitative Pho8Δ60 assay of nonspecific autophagy, Methods Enzymol, 451, 33, 10.1016/S0076-6879(08)03203-5 · DOI · Paper page
  37. Woods, 1994, Yeast SNF1 is functionally related to mammalian AMP-activated protein kinase and regulates acetyl-CoA carboxylase in vivo, J. Biol. Chem, 269, 19509, 10.1016/S0021-9258(17)32198-1 · DOI
  38. Coccetti, 2018, Conventional and emerging roles of the energy sensor Snf1/AMPK in Saccharomyces cerevisiae, Microb. Cell, 5, 482, 10.15698/mic2018.11.655 · DOI
  39. Takahashi, 2006, Nucleocytosolic acetyl-coenzyme a synthetase is required for histone acetylation and global transcription, Mol. Cell, 23, 207, 10.1016/j.molcel.2006.05.040 · DOI · Paper page
  40. Schroeder, 2014, Acetyl-coenzyme A: a metabolic master regulator of autophagy and longevity, Autophagy, 10, 1335, 10.4161/auto.28919 · DOI
  41. Johansson, 2008, Inhibition of the fungal fatty acid synthase type I multienzyme complex, Proc. Natl. Acad. Sci. U.S.A, 105, 12803, 10.1073/pnas.0805827105 · DOI
  42. Lees, 1999, Biochemistry and molecular biology of sterol synthesis in Saccharomyces cerevisiae, Crit. Rev. Biochem. Mol. Biol, 34, 33
  43. Callegari, 2010, Atorvastatin-induced cell toxicity in yeast is linked to disruption of protein isoprenylation, FEMS Yeast Res, 10, 188, 10.1111/j.1567-1364.2009.00593.x · DOI · Paper page
  44. Carmona-Gutierrez, 2018, Guidelines and recommendations on yeast cell death nomenclature, Microb. Cell, 5, 4, 10.15698/mic2018.01.607 · DOI
  45. Alvers, 2009, Autophagy is required for extension of yeast chronological life span by rapamycin, Autophagy, 5, 847, 10.4161/auto.8824 · DOI · Paper page
  46. Shen, 2004, A mechanism for the potent inhibition of eukaryotic acetyl-coenzyme A carboxylase by soraphen A, a macrocyclic polyketide natural product, Mol. Cell, 16, 881, 10.1016/j.molcel.2004.11.034 · DOI
  47. Shirra, 2001, Inhibition of acetyl coenzyme A carboxylase activity restores expression of the INO1 gene in a snf1 mutant strain of Saccharomyces cerevisiae, Mol. Cell. Biol, 21, 5710, 10.1128/MCB.21.17.5710-5722.2001 · DOI
  48. Chirala, 1994, Analysis of FAS3/ACC regulatory region of Saccharomyces cerevisiae: identification of a functional UASINO and sequences responsible for fatty acid mediated repression, Nucleic Acids Res, 22, 412, 10.1093/nar/22.3.412 · DOI
  49. Strømhaug, 2004, Atg21 is a phosphoinositide binding protein required for efficient lipidation and localization of Atg8 during uptake of aminopeptidase I by selective autophagy, Mol. Biol. Cell, 15, 3553, 10.1091/mbc.e04-02-0147 · DOI
  50. Manolson, 1992, The VPH1 gene encodes a 95-kDa integral membrane polypeptide required for in vivo assembly and activity of the yeast vacuolar H+-ATPase, J. Biol. Chem, 267, 14294, 10.1016/S0021-9258(19)49711-1 · DOI
  51. Aufschnaiter, 2019, The vacuolar shapes of ageing: from function to morphology, Biochim. Biophys. Acta Mol. Cell Res, 1866, 957, 10.1016/j.bbamcr.2019.02.011 · DOI
  52. Aufschnaiter, 2017, The coordinated action of calcineurin and cathepsin D protects against α-synuclein toxicity, Front. Mol. Neurosci, 10, 207, 10.3389/fnmol.2017.00207 · DOI
  53. Weisman, 1987, Multiple methods of visualizing the yeast vacuole permit evaluation of its morphology and inheritance during the cell cycle, J. Cell Biol, 105, 1539, 10.1083/jcb.105.4.1539 · DOI
  54. Nwadike, 2018, AMPK inhibits ULK1-dependent autophagosome formation and lysosomal acidification via distinct mechanisms, Mol. Cell. Biol, 38, e0002318, 10.1128/MCB.00023-18 · DOI · Paper page
  55. Zhang, 2013, The yeast AMPK homolog SNF1 regulates acetyl coenzyme A homeostasis and histone acetylation, Mol. Cell. Biol, 33, 4701, 10.1128/MCB.00198-13 · DOI
  56. Orlandi, 2012, Lack of Ach1 CoA-transferase triggers apoptosis and decreases chronological lifespan in yeast, Front. Oncol, 2, 67, 10.3389/fonc.2012.00067 · DOI
  57. Shepard, 2009, Alcohol-induced protein hyperacetylation: mechanisms and consequences, World J. Gastroenterol, 15, 1219, 10.3748/wjg.15.1219 · DOI
  58. Niso-Santano, 2015, Unsaturated fatty acids induce non-canonical autophagy, EMBO J, 34, 1025, 10.15252/embj.201489363 · DOI
  59. Herker, 2004, Chronological aging leads to apoptosis in yeast, J. Cell Biol, 164, 501, 10.1083/jcb.200310014 · DOI · Paper page
  60. Fabrizio, 2004, Superoxide is a mediator of an altruistic aging program in Saccharomyces cerevisiae, J. Cell Biol, 166, 1055, 10.1083/jcb.200404002 · DOI · Paper page
  61. Büttner, 2006, Why yeast cells can undergo apoptosis: death in times of peace, love, and war, J. Cell Biol, 175, 521, 10.1083/jcb.200608098 · DOI
  62. Coonrod, 2013, Homotypic vacuole fusion in yeast requires organelle acidification and not the V-ATPase membrane domain, Dev. Cell, 27, 462, 10.1016/j.devcel.2013.10.014 · DOI
  63. Zou, 2017, The roles of the SNARE protein Sed5 in autophagy in Saccharomyces cerevisiae, Mol. Cells, 40, 643, 10.14348/molcells.2017.0030 · DOI
  64. Miner, 2017, Deleting the DAG kinase Dgk1 augments yeast vacuole fusion through increased Ypt7 activity and altered membrane fluidity, Traffic, 18, 315, 10.1111/tra.12479 · DOI
  65. Sarkar, 2005, Lithium induces autophagy by inhibiting inositol monophosphatase, J. Cell Biol, 170, 1101, 10.1083/jcb.200504035 · DOI · Paper page
  66. Criollo, 2007, Regulation of autophagy by the inositol trisphosphate receptor, Cell Death Differ, 14, 1029, 10.1038/sj.cdd.4402099 · DOI
  67. Sauvat, 2018, Trans-fats inhibit autophagy induced by saturated fatty acids, EBioMedicine, 30, 261, 10.1016/j.ebiom.2018.03.028 · DOI
  68. Han, 2017, Mono-unsaturated fatty acids link H3K4me3 modifiers to C. elegans lifespan, Nature, 544, 185, 10.1038/nature21686 · DOI
  69. Katewa, 2012, Intramyocellular fatty-acid metabolism plays a critical role in mediating responses to dietary restriction in Drosophila melanogaster, Cell Metab, 16, 97, 10.1016/j.cmet.2012.06.005 · DOI
  70. Solinas, 2015, De novo lipogenesis in metabolic homeostasis: more friend than foe?, Mol. Metab, 4, 367, 10.1016/j.molmet.2015.03.004 · DOI
  71. Berod, 2014, De novo fatty acid synthesis controls the fate between regulatory T and T helper 17 cells, Nat. Med, 20, 1327, 10.1038/nm.3704 · DOI · Paper page
  72. Corominas-Faja, 2014, Chemical inhibition of acetyl-CoA carboxylase suppresses self-renewal growth of cancer stem cells, Oncotarget, 5, 8306, 10.18632/oncotarget.2059 · DOI
  73. Beckers, 2007, Chemical inhibition of acetyl-CoA carboxylase induces growth arrest and cytotoxicity selectively in cancer cells, Cancer Res, 67, 8180, 10.1158/0008-5472.CAN-07-0389 · DOI
  74. Svensson, 2016, Inhibition of acetyl-CoA carboxylase suppresses fatty acid synthesis and tumor growth of non-small-cell lung cancer in preclinical models, Nat. Med, 22, 1108, 10.1038/nm.4181 · DOI · Paper page
  75. Janke, 2004, A versatile toolbox for PCR-based tagging of yeast genes: new fluorescent proteins, more markers and promoter substitution cassettes, Yeast, 21, 947, 10.1002/yea.1142 · DOI
  76. Gueldener, 2002, A second set of loxP marker cassettes for Cre-mediated multiple gene knockouts in budding yeast, Nucleic Acids Res, 30, e23, 10.1093/nar/30.6.e23 · DOI
  77. Büttner, 2007, Endonuclease G regulates budding yeast life and death, Mol. Cell, 25, 233, 10.1016/j.molcel.2006.12.021 · DOI · Paper page
  78. Gerth, 1994, The soraphens: a family of novel antifungal compounds from Sorangium cellulosum (Myxobacteria). I. Soraphen A1 α: fermentation, isolation, biological properties, J. Antibiot, 47, 23, 10.7164/antibiotics.47.23 · DOI
  79. Maciejak, 2013, The effects of statins on the mevalonic acid pathway in recombinant yeast strains expressing human HMG-CoA reductase, BMC Biotechnol, 13, 68, 10.1186/1472-6750-13-68 · DOI
  80. Riezman, 1983, Import of proteins into mitochondria: a 70 kilodalton outer membrane protein with a large carboxy-terminal deletion is still transported to the outer membrane, EMBO J, 2, 2161, 10.1002/j.1460-2075.1983.tb01717.x · DOI
  81. Cheong, 2008, Biochemical methods to monitor autophagy-related processes in yeast, Methods Enzymol, 451, 1, 10.1016/S0076-6879(08)03201-1 · DOI
  82. Kao, 2003, In vivo assays to study histone ubiquitylation, Methods, 31, 59, 10.1016/S1046-2023(03)00088-4 · DOI
  83. Schindelin, 2012, Fiji: an open-source platform for biological-image analysis, Nat. Methods, 9, 676, 10.1038/nmeth.2019 · DOI · Paper page
  84. Brooks, T., and Humphreys, W., (2006) Extension of DAMAS phased array processing for spatial coherence determination (DAMAS-C). in 12th AIAA/CEAS Aeroacoustics Conference (27th AIAA Aeroacoustics Conference), Aeroacoustics Conferences, American Institute of Aeronautics and Astronautics 10.2514/6.2006-2654 · DOI
  85. Radović, 2016, Lysosomal acid lipase regulates VLDL synthesis and insulin sensitivity in mice, Diabetologia, 59, 1743, 10.1007/s00125-016-3968-6 · DOI
  86. Prokesch, 2017, Liver p53 is stabilized upon starvation and required for amino acid catabolism and gluconeogenesis, FASEB J, 31, 732, 10.1096/fj.201600845R · DOI
  87. Sales, 2017, Lipidomics of human blood plasma by high-resolution shotgun mass spectrometry, Methods Mol. Biol, 1619, 203, 10.1007/978-1-4939-7057-5_16 · DOI
  88. Sales, 2016, Gender, contraceptives and individual metabolic predisposition shape a healthy plasma lipidome, Sci. Rep, 6, 27710, 10.1038/srep27710 · DOI
  89. Schuhmann, 2012, Shotgun lipidomics on a LTQ Orbitrap mass spectrometer by successive switching between acquisition polarity modes, J. Mass Spectrom, 47, 96, 10.1002/jms.2031 · DOI
  90. Schuhmann, 2017, Intensity-independent noise filtering in FT MS and FT MS/MS spectra for shotgun lipidomics, Anal. Chem, 89, 7046, 10.1021/acs.analchem.7b00794 · DOI
  91. Herzog, 2012, LipidXplorer: a software for consensual cross-platform lipidomics, PLoS One, 7, e29851, 10.1371/journal.pone.0029851 · DOI
  92. Xia, 2016, Using MetaboAnalyst 3.0 for comprehensive metabolomics data analysis, Curr. Protoc. Bioinformatics, 55, 14.10.1, 10.1002/cpbi.11 · DOI
  93. Wei, 2012, Comparisons of treatment means when factors do not interact in two-factorial studies, Amino Acids, 42, 2031, 10.1007/s00726-011-0924-0 · DOI

Cited by

Sorted by citations

See all 46

Metadata

Authors
Gross, A. S., Zimmermann, A., Pendl, T., Schroeder, S., Schoenlechner, H., Knittelfelder, O., Lamplmayr, L., Santiso, A., Aufschnaiter, A., Waltenstorfer, D., Ortonobes Lara, S., Stryeck, S., Kast, C., Ruckenstuhl, C., Hofer, S. J., Michelitsch, B., Woelflingseder, M., Müller, R., Carmona-Gutierrez, D., Madl, T., Büttner, S., Fröhlich, K.-U., Shevchenko, A., & Eisenberg, T.
Venue
Journal of Biological Chemistry
Publisher
Elsevier BV
Published
2019-08
Volume
294
Issue
32
Pages
12020-12039
ISSN
0021-9258
Cited by
46
References
10
Language
en
Funders
  • Österreichischen Akademie der Wissenschaften (ÖAW) (APART program)
  • Austrian Science Fund (FWF) (P28854, I3792, DK-MCD, W1226, P27183-B24)
  • Österreichische Forschungsförderungsgesellschaft (FFG) (864690, 870454)
  • Svenska Forskningsrådet Formas (Swedish Research Council) (2015-05468)
  • Åke Wiberg Stiftelse (Åke Wiberg Foundation) (M16-0130)
  • Carl Tryggers Stiftelse för Vetenskaplig Forskning (Carl Trygger Foundation) (CTS16:85)

About these checks

Registry, retraction, Cites and statistics results are computed, not judged, with one exception: a printed reference that no index lists is read once by a model before it counts as a citation error. Claims are extracted by a model and kept only when their quote appears verbatim in the text; each cited source is then checked, with a model’s help, for whether it says what the claim relies on. Those verdicts can be wrong — read the claim’s quote and the cited source before relying on one.

Statistics and arithmetic are recomputed, not judged.

Confidence bands are shown only for fields calibrated on our annotated test set. None is calibrated yet, so no band is shown.

What counts as a claim ›How we measure confidence ›How we check this ›

Are you an author, or do you see a problem with this page? Request a review