Cited by 392

The DOI matches its Crossref record; 15 of the 15 references it cites were found in a registry or an index.

Transcription factor NFE2L2/NRF2 is a regulator of macroautophagy genes

Pajares, Marta, Jiménez-Moreno, Natalia, García-Yagüe, Ángel J., Escoll, Maribel, de Ceballos, María L., Van Leuven, Fred, Rábano, Alberto, Yamamoto, Masayuki, Rojo, Ana I., Cuadrado, Antonio·2016·Autophagy

Overview

The claims and statistics of this paper haven’t been checked yet.

Run the check — free, no account needed. It reads the open-access text and checks the sources it cites.

A few free checks a day · papers already verified open instantly · results are public

Integrity signals

Registry

Crossref · 10.1080/15548627.2016.1208889

Cites

15 of 15 references verified0 citation errors · 0 not checkable

Statistics

Figures

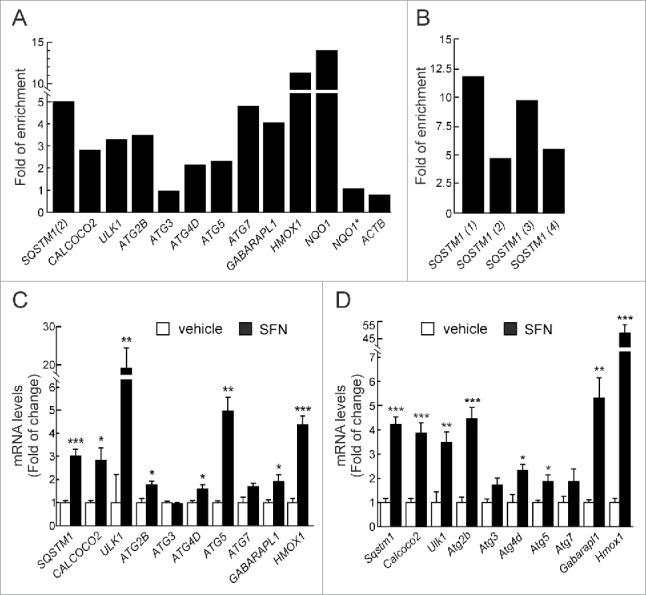
Figure 1. NFE2L2 modulates autophagy gene expression. (A) HEK293T cells were transfected with an expression vector for NFE2L2ΔETGE-V5.27 ChIP analysis was performed with anti-IgG or anti-V5 antibodies and the potential AREs with the highest score were analyzed by qRT-PCR. (B) The same ChIP analysis of putative AREs in the promoter of SQSTM1. The figures show representative data normalized as the fold of enrichment with the anti-V5 antibody vs. the IgG antibody. In (A), ACTB and an upstream region of NQO1 that does not contain any ARE (NQO1*) were analyzed as negative controls. Previously described AREs in HMOX1, NQO1, SQSTM1 and CALCOCO2 were analyzed as positive controls. These experiments were repeated 3 times with similar results. In (B), numbers in brackets indicate the AREs from Table 1 specifically amplified. (C and D) HEK293T and HT22 cells were submitted to sulforaphane (SFN, 15 μM) for 12 h. mRNA levels of the indicated genes were determined by qRT-PCR and normalized by Actb levels. Data are mean ± SEM (n = 3). Statistical analysis was performed with the Student t test. *, p < 0.05; **, p < 0.01; and ***, p < 0.001 vs. untreated conditions.
Figure 1. NFE2L2 modulates autophagy gene expression. (A) HEK293T cells were transfected with an expression vector for NFE2L2ΔETGE-V5.27 ChIP analysis was performed with anti-IgG or anti-V5 antibodies and the potential AREs with the highest score were analyzed by qRT-PCR. (B) The same ChIP analysis of putative AREs in the promoter of SQSTM1. The figures show representative data normalized as the fold of enrichment with the anti-V5 antibody vs. the IgG antibody. In (A), ACTB and an upstream region of NQO1 that does not contain any ARE (NQO1*) were analyzed as negative controls. Previously described AREs in HMOX1, NQO1, SQSTM1 and CALCOCO2 were analyzed as positive controls. These experiments were repeated 3 times with similar results. In (B), numbers in brackets indicate the AREs from Table 1 specifically amplified. (C and D) HEK293T and HT22 cells were submitted to sulforaphane (SFN, 15 μM) for 12 h. mRNA levels of the indicated genes were determined by qRT-PCR and normalized by Actb levels. Data are mean ± SEM (n = 3). Statistical analysis was performed with the Student t test. *, p < 0.05; **, p < 0.01; and ***, p < 0.001 vs. untreated conditions.CC BY-NC · PubMed Central
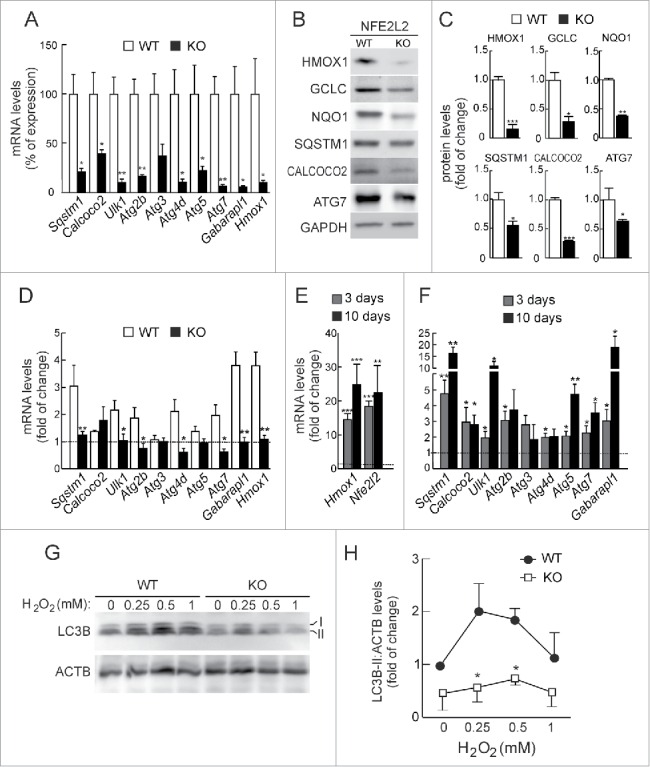
Figure 2. NFE2L2 deficiency results in decreased autophagy gene expression. (A) Expression levels of the indicated genes from Nfe2l2-WT and nfe2l2-KO mouse embryonic fibroblasts (MEFs) were determined by qRT-PCR and normalized by Actb levels. Data are mean ± SEM (n = 3). Statistical analysis was performed with the Student t test. *, p < 0.05; **, p < 0.01; and ***, p < 0.001 vs. Nfe2l2-WT MEFs. (B) Representative immunoblots for the indicated proteins of Nfe2l2-WT and nfe2l2-KO MEFs. (C) Densitometric quantification of representative blots from (B) relative to GAPDH levels. Data are mean ± SEM (n = 3). Statistical analysis was performed using the Student t test. *, p < 0.05; **, p < 0.01; and ***, p < 0.001 vs. Nfe2l2-WT MEFs. (D) Nfe2l2-WT and nfe2l2-KO MEFs were submitted to SFN (15 µM, 6 h). mRNA levels of the indicated genes were determined by qRT-PCR and normalized to Actb levels. (E) nfe2l2-KO MEFs were transduced with NFE2L2ΔETGE-V5 or GFP-expressing lentivirus and mRNA levels of the indicated genes were analyzed by qRT-PCR following 3 and 10 after transduction. For (D) and (E), bars represent the fold of change normalized to the untreated condition (D), or GFP-lentivirus infection (E) depicted with the dashed lines. Data are mean ± SEM (n = 3). Statistical analysis was performed with the Student t test. *, p < 0.05; and **, p < 0.01 vs. control conditions. (F) Nfe2l2-WT and nfe2l2-KO cells were treated with the indicated concentrations of H2O2 during 6 h. Representative immunoblots for the indicated proteins of Nfe2l2-WT and nfe2l2-KO MEFs. (G) Densitometric quantification of representative blots from (F) relative to ACTB/β-actin levels. Data are mean ± SEM (n = 3). Statistical analysis was performed using Student t test. *, p < 0.05 vs. Nfe2l2-WT.
Figure 2. NFE2L2 deficiency results in decreased autophagy gene expression. (A) Expression levels of the indicated genes from Nfe2l2-WT and nfe2l2-KO mouse embryonic fibroblasts (MEFs) were determined by qRT-PCR and normalized by Actb levels. Data are mean ± SEM (n = 3). Statistical analysis was performed with the Student t test. *, p < 0.05; **, p < 0.01; and ***, p < 0.001 vs. Nfe2l2-WT MEFs. (B) Representative immunoblots for the indicated proteins of Nfe2l2-WT and nfe2l2-KO MEFs. (C) Densitometric quantification of representative blots from (B) relative to GAPDH levels. Data are mean ± SEM (n = 3). Statistical analysis was performed using the Student t test. *, p < 0.05; **, p < 0.01; and ***, p < 0.001 vs. Nfe2l2-WT MEFs. (D) Nfe2l2-WT and nfe2l2-KO MEFs were submitted to SFN (15 µM, 6 h). mRNA levels of the indicated genes were determined by qRT-PCR and normalized to Actb levels. (E) nfe2l2-KO MEFs were transduced with NFE2L2ΔETGE-V5 or GFP-expressing lentivirus and mRNA levels of the indicated genes were analyzed by qRT-PCR following 3 and 10 after transduction. For (D) and (E), bars represent the fold of change normalized to the untreated condition (D), or GFP-lentivirus infection (E) depicted with the dashed lines. Data are mean ± SEM (n = 3). Statistical analysis was performed with the Student t test. *, p < 0.05; and **, p < 0.01 vs. control conditions. (F) Nfe2l2-WT and nfe2l2-KO cells were treated with the indicated concentrations of H2O2 during 6 h. Representative immunoblots for the indicated proteins of Nfe2l2-WT and nfe2l2-KO MEFs. (G) Densitometric quantification of representative blots from (F) relative to ACTB/β-actin levels. Data are mean ± SEM (n = 3). Statistical analysis was performed using Student t test. *, p < 0.05 vs. Nfe2l2-WT.CC BY-NC · PubMed Central
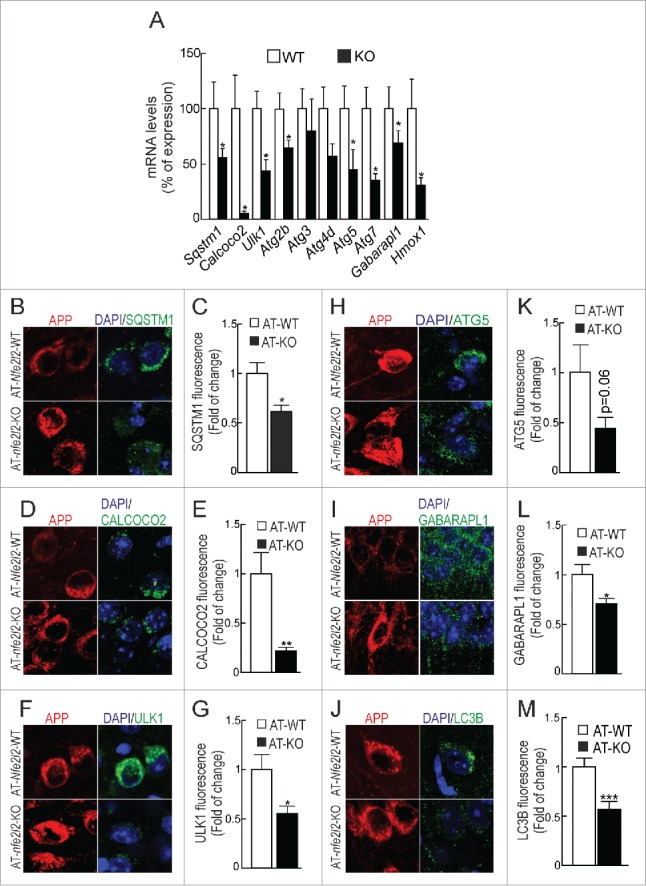
Figure 3. NFE2L2 deficiency impairs autophagy in neurons. (A) Expression levels of the indicated genes from Nfe2l2-WT and nfe2l2-KO primary hippocampal/cortical neurons were determined by qRT-PCR and normalized to Actb levels. Data are mean ± SEM (n = 3). Statistical analysis was performed with the Student t test. *, p <0.05 vs. Nfe2l2-WT neurons. (B-G) Confocal analysis of double immunofluorescence with anti-APP/Aβ (4G8, red) and anti-SQSTM1, CALCOCO2, ULK1, ATG5, GABARAPL1 or LC3B (green) antibodies in brain of AT-Nfe2l2-WT and AT-nfe2l2-KO. Fluorescence intensity was analyzed in the cytosol of 100 randomly chosen APP-positive neurons of each genotype. Quantification was derived from 3 independent experiments with 2 fields per experiment. Fluorescence intensity was quantified in 1.5-µm-thick stacks using ImageJ software. Data are mean ± SEM. Statistical analysis was performed with a Student t test. *, p < 0.05; **, p < 0.01; and ***, p < 0.001 vs. AT-Nfe2l2-WT mice.
Figure 3. NFE2L2 deficiency impairs autophagy in neurons. (A) Expression levels of the indicated genes from Nfe2l2-WT and nfe2l2-KO primary hippocampal/cortical neurons were determined by qRT-PCR and normalized to Actb levels. Data are mean ± SEM (n = 3). Statistical analysis was performed with the Student t test. *, p <0.05 vs. Nfe2l2-WT neurons. (B-G) Confocal analysis of double immunofluorescence with anti-APP/Aβ (4G8, red) and anti-SQSTM1, CALCOCO2, ULK1, ATG5, GABARAPL1 or LC3B (green) antibodies in brain of AT-Nfe2l2-WT and AT-nfe2l2-KO. Fluorescence intensity was analyzed in the cytosol of 100 randomly chosen APP-positive neurons of each genotype. Quantification was derived from 3 independent experiments with 2 fields per experiment. Fluorescence intensity was quantified in 1.5-µm-thick stacks using ImageJ software. Data are mean ± SEM. Statistical analysis was performed with a Student t test. *, p < 0.05; **, p < 0.01; and ***, p < 0.001 vs. AT-Nfe2l2-WT mice.CC BY-NC · PubMed Central
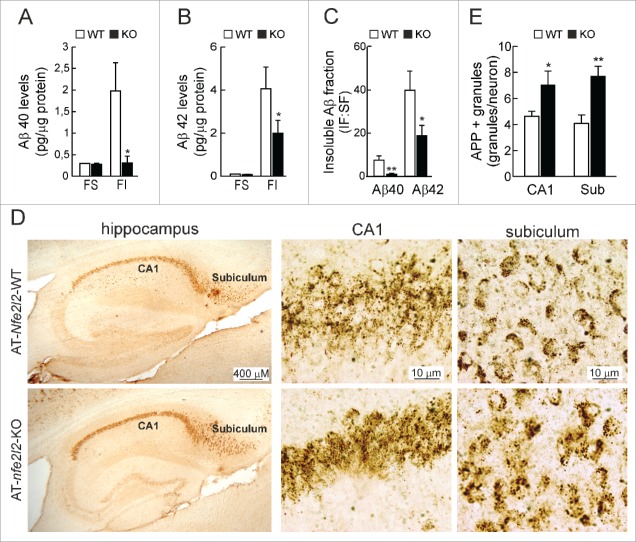
Figure 4. NFE2L2 deficiency leads to intracellular APP/Aβ accumulation. (A-B) Determination of Aβ levels by ELISA in hippocampal brain homogenates of 12–14 mo-old AT-Nfe2l2-WT and AT-nfe2l2-KO mice. Aβ40 and Aβ42 levels were measured in the soluble (FS) and insoluble (FI) fractions (formic acid extracted). Soluble and insoluble Aβ40 (A) and Aβ42 (B) levels were normalized by total protein amount. (C) Ratio IF:SF of Aβ40 and Aβ42 peptides. Data are mean ± SEM (n = 10). Statistical analysis was performed with a Student t test. *, p < 0.05; and **, p < 0.01 comparing AT-Nfe2l2-WT and AT-nfe2l2-KO mice. (D), Immunohistological analysis of APP/Aβ expression (4G8 antibody) in hippocampus of 13-mo-old AT-Nfe2l2-WT and AT-nfe2l2-KO mice. (E) Estimation of the number of APP/Aβ-positive granules in CA1 and subiculum from 12–14-mo-old AT-Nfe2l2-WT and AT-nfe2l2-KO mice. Data are mean ± SEM (n = 8). Statistical analysis was performed with the Student t test. *, p<0.05; and **, p < 0.01 comparing AT-Nfe2l2-WT vs. AT-nfe2l2-KO groups.
Figure 4. NFE2L2 deficiency leads to intracellular APP/Aβ accumulation. (A-B) Determination of Aβ levels by ELISA in hippocampal brain homogenates of 12–14 mo-old AT-Nfe2l2-WT and AT-nfe2l2-KO mice. Aβ40 and Aβ42 levels were measured in the soluble (FS) and insoluble (FI) fractions (formic acid extracted). Soluble and insoluble Aβ40 (A) and Aβ42 (B) levels were normalized by total protein amount. (C) Ratio IF:SF of Aβ40 and Aβ42 peptides. Data are mean ± SEM (n = 10). Statistical analysis was performed with a Student t test. *, p < 0.05; and **, p < 0.01 comparing AT-Nfe2l2-WT and AT-nfe2l2-KO mice. (D), Immunohistological analysis of APP/Aβ expression (4G8 antibody) in hippocampus of 13-mo-old AT-Nfe2l2-WT and AT-nfe2l2-KO mice. (E) Estimation of the number of APP/Aβ-positive granules in CA1 and subiculum from 12–14-mo-old AT-Nfe2l2-WT and AT-nfe2l2-KO mice. Data are mean ± SEM (n = 8). Statistical analysis was performed with the Student t test. *, p<0.05; and **, p < 0.01 comparing AT-Nfe2l2-WT vs. AT-nfe2l2-KO groups.CC BY-NC · PubMed Central
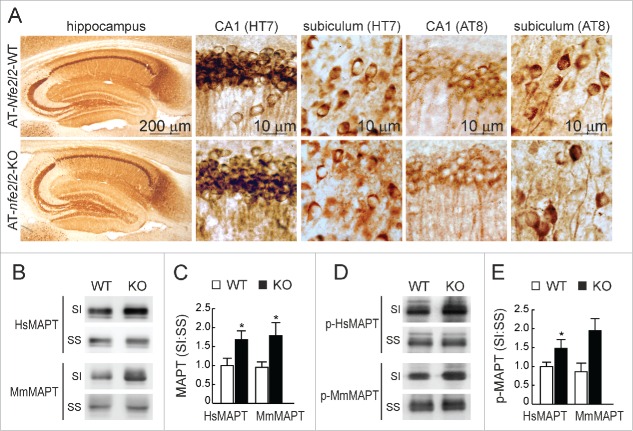
Figure 5. NFE2L2 deficiency leads to accumulation of aggregated HsMAPT. (A) Immunohistochemical analysis of HsMAPT expression in hippocampus of 13-mo-old AT-Nfe2l2-WT and AT-nfe2l2-KO mice stained with anti HT7 or AT8 antibodies that recognize total (HT7) or phosphorylated (AT8) HsMAPT. (B) Hippocampal tissue lysates from AT-Nfe2l2-WT and AT-nfe2l2-KO mice were separated into sarkosyl-soluble (SS) and sarkosyl-insoluble (SI) fractions. Total HsMAPT and MmMAPT levels were determined using anti-TAU46 antibody that recognizes MAPT from both species. (C) Densitometric quantification of representative blots from (B). (D) Hippocampal tissue lysates from AT-Nfe2l2-WT and AT-nfe2l2-KO mice were separated into sarkosyl-soluble (SS) and sarkosyl-insoluble (SI) fractions and analyzed with anti-PHF1 antibody that recognizes human p-HsMAPT. (E) Densitometric quantification of representative blots from (D). For (C) and (E), data are mean ± SEM (n = 6). Statistical analysis was performed with the Student t test. *, p < 0.05; comparing AT-Nfe2l2-WT and AT-nfe2l2-KO groups.
Figure 5. NFE2L2 deficiency leads to accumulation of aggregated HsMAPT. (A) Immunohistochemical analysis of HsMAPT expression in hippocampus of 13-mo-old AT-Nfe2l2-WT and AT-nfe2l2-KO mice stained with anti HT7 or AT8 antibodies that recognize total (HT7) or phosphorylated (AT8) HsMAPT. (B) Hippocampal tissue lysates from AT-Nfe2l2-WT and AT-nfe2l2-KO mice were separated into sarkosyl-soluble (SS) and sarkosyl-insoluble (SI) fractions. Total HsMAPT and MmMAPT levels were determined using anti-TAU46 antibody that recognizes MAPT from both species. (C) Densitometric quantification of representative blots from (B). (D) Hippocampal tissue lysates from AT-Nfe2l2-WT and AT-nfe2l2-KO mice were separated into sarkosyl-soluble (SS) and sarkosyl-insoluble (SI) fractions and analyzed with anti-PHF1 antibody that recognizes human p-HsMAPT. (E) Densitometric quantification of representative blots from (D). For (C) and (E), data are mean ± SEM (n = 6). Statistical analysis was performed with the Student t test. *, p < 0.05; comparing AT-Nfe2l2-WT and AT-nfe2l2-KO groups.CC BY-NC · PubMed Central
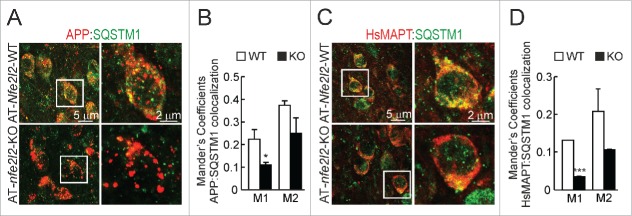
Figure 6. NFE2L2 modulates neuronal autophagy. (A) Confocal analysis of double immunofluorescence with anti-APP/Aβ (4G8, red) and anti-SQSTM1 (green) antibodies in subiculum of AT-Nfe2l2-WT and AT-nfe2l2-KO. (B) Quantification of colocalization between APP/Aβ and SQSTM1 staining expressed as Mander's coefficients. (C) Confocal analysis of double immunofluorescence with anti-HsMAPT (HT7, red) and anti-SQSTM1 (green) in subiculum neurons of AT-Nfe2l2-WT and AT-nfe2l2-KO. (D) Quantification of colocalization between HsMAPT and SQSTM1 expressed as Mander's coefficients. For (B) and (D), Mander's coefficients were derived from 3 independent experiments with 2 fields per experiment. Fluorescence was quantified in 1.5-µm-thick stacks using the JACoP plugin of ImageJ software. Data are mean ± SEM. Statistical analysis was performed with a Student t test. *, p < 0.05; and ***, p < 0.001, comparing M1 and M2 coefficients obtained from AT-Nfe2l2-WT and AT-nfe2l2-KO images.
Figure 6. NFE2L2 modulates neuronal autophagy. (A) Confocal analysis of double immunofluorescence with anti-APP/Aβ (4G8, red) and anti-SQSTM1 (green) antibodies in subiculum of AT-Nfe2l2-WT and AT-nfe2l2-KO. (B) Quantification of colocalization between APP/Aβ and SQSTM1 staining expressed as Mander's coefficients. (C) Confocal analysis of double immunofluorescence with anti-HsMAPT (HT7, red) and anti-SQSTM1 (green) in subiculum neurons of AT-Nfe2l2-WT and AT-nfe2l2-KO. (D) Quantification of colocalization between HsMAPT and SQSTM1 expressed as Mander's coefficients. For (B) and (D), Mander's coefficients were derived from 3 independent experiments with 2 fields per experiment. Fluorescence was quantified in 1.5-µm-thick stacks using the JACoP plugin of ImageJ software. Data are mean ± SEM. Statistical analysis was performed with a Student t test. *, p < 0.05; and ***, p < 0.001, comparing M1 and M2 coefficients obtained from AT-Nfe2l2-WT and AT-nfe2l2-KO images.CC BY-NC · PubMed Central
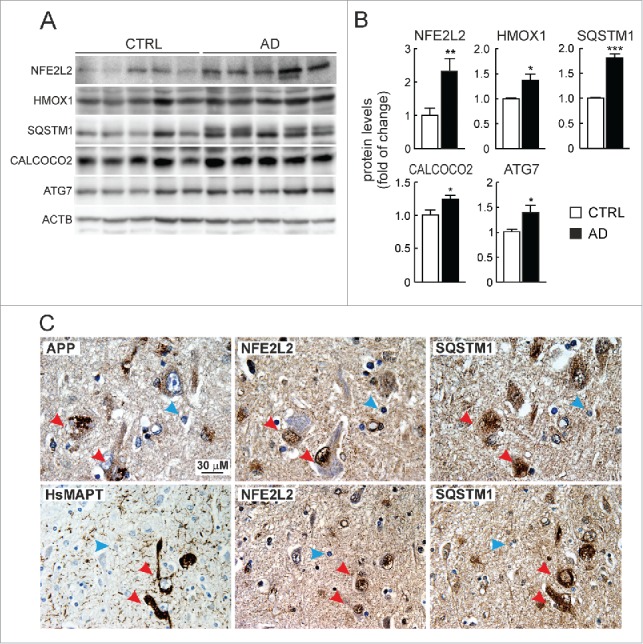
Figure 7. Evidence of NFE2L2 upregulation in neurons of AD subjects expressing high levels of HsAPP and HsMAPT. (A) Immunoblot analysis of NFE2L2, HMOX1, SQSTM1, CALCOCO2, and ATG7 in hippocampus of asymptomatic controls and patients with diagnosed AD who combined amyloidopathy and tauopathy. (B) Densitometric quantification of protein levels from representative immunoblots of (A) relative to ACTB. Data are represented as mean ± SEM (n = 5 controls and n = 5 AD subjects). Statistical analysis was performed with a Student t test. *, p < 0.05; **, p < 0.01; and ***, p < 0.001 comparing control vs. AD groups. (C) Adjacent 4-μm-thick brain sections from AD subjects were immunostained with anti-APP/Aβ (4G8), anti-HsMAPT (HT7), anti-NFE2L2 and anti-SQSTM1 antibodies as indicated. Red arrows point to the same neuron expressing HsAPP or HsMAPT, NFE2L2 and SQSTM1; blue arrows depict internal negative controls for cells that do not express HsAPP or HsMAPT and present basal staining for NFE2L2 and SQSTM1.
Figure 7. Evidence of NFE2L2 upregulation in neurons of AD subjects expressing high levels of HsAPP and HsMAPT. (A) Immunoblot analysis of NFE2L2, HMOX1, SQSTM1, CALCOCO2, and ATG7 in hippocampus of asymptomatic controls and patients with diagnosed AD who combined amyloidopathy and tauopathy. (B) Densitometric quantification of protein levels from representative immunoblots of (A) relative to ACTB. Data are represented as mean ± SEM (n = 5 controls and n = 5 AD subjects). Statistical analysis was performed with a Student t test. *, p < 0.05; **, p < 0.01; and ***, p < 0.001 comparing control vs. AD groups. (C) Adjacent 4-μm-thick brain sections from AD subjects were immunostained with anti-APP/Aβ (4G8), anti-HsMAPT (HT7), anti-NFE2L2 and anti-SQSTM1 antibodies as indicated. Red arrows point to the same neuron expressing HsAPP or HsMAPT, NFE2L2 and SQSTM1; blue arrows depict internal negative controls for cells that do not express HsAPP or HsMAPT and present basal staining for NFE2L2 and SQSTM1.CC BY-NC · PubMed Central

Verification

Claims the paper makes

The claims and statistics of this paper haven’t been checked yet.

Run the check — free, no account needed. It reads the open-access text and checks the sources it cites.

A few free checks a day · papers already verified open instantly · results are public

Claims other papers make about this one

Each is checked against this paper’s own text: does it say what the citing paper says it does?

Self-check

Percentages, sums and reported differences re-computed from the paper’s own numbers.

The self-check needs the paper’s full text.

Citations

Cites

Show all 15 references

Research works printed but not linked: 59

  1. 10.1016/j.cell.2011.07.030 · DOI · Paper page
  2. 10.1038/emm.2014.117 · DOI · Paper page
  3. 10.1126/science.290.5497.1717 · DOI
  4. 10.1038/nature13949 · DOI
  5. 10.1016/j.molcel.2013.01.024 · DOI · Paper page
  6. 10.1080/15548627.2015.1034410 · DOI
  7. 10.1016/j.tibs.2014.02.002 · DOI
  8. 10.1016/j.freeradbiomed.2015.06.014 · DOI
  9. 10.1016/j.molcel.2013.08.003 · DOI
  10. 10.1038/ncomms4496 · DOI · Paper page
  11. 10.1186/1750-1326-7-48 · DOI · Paper page
  12. 10.1038/nature04723 · DOI · Paper page
  13. 10.1016/j.bbadis.2010.03.005 · DOI
  14. 10.1242/jcs.019265 · DOI · Paper page
  15. 10.1523/JNEUROSCI.0800-08.2008 · DOI · Paper page
  16. 10.1155/2013/798401 · DOI
  17. 10.1016/j.ejcb.2015.05.001 · DOI
  18. 10.1016/j.neuroscience.2014.07.072 · DOI
  19. 10.1016/j.febslet.2014.06.036 · DOI
  20. 10.2353/ajpath.2008.070904 · DOI · Paper page
  21. 10.1016/j.neurobiolaging.2014.09.004 · DOI
  22. 10.1111/j.1471-4159.2006.04019.x · DOI
  23. 10.1042/BJ20150568 · DOI
  24. 10.4161/auto.7.11.17166 · DOI
  25. 10.4161/auto.25803 · DOI
  26. 10.1089/ars.2012.4754 · DOI
  27. 10.1128/MCB.15.8.4184 · DOI
  28. 10.1074/jbc.273.19.11783 · DOI
  29. 10.1080/03602530600971974 · DOI
  30. 10.1128/MCB.24.24.10941-10953.2004 · DOI
  31. 10.1038/nrd3802 · DOI
  32. 10.3233/JAD-2012-120001 · DOI
  33. 10.4161/auto.21861 · DOI
  34. 10.4161/auto.7.12.18051 · DOI
  35. 10.1083/jcb.200505082 · DOI · Paper page
  36. 10.1074/jbc.M304009200 · DOI
  37. 10.1016/j.ajpath.2014.10.011 · DOI
  38. 10.1111/acel.12057 · DOI · Paper page
  39. 10.1016/j.neuint.2013.01.014 · DOI · Paper page
  40. 10.4161/auto.1.1.1513 · DOI
  41. 10.1016/j.semcdb.2015.03.005 · DOI
  42. 10.1242/jcs.161216 · DOI
  43. 10.1212/WNL.0000000000001702 · DOI · Paper page
  44. 10.1097/nen.0b013e31802d6da9 · DOI · Paper page
  45. 10.1016/S0197-4580(00)00114-7 · DOI · Paper page
  46. 10.1016/j.neurobiolaging.2005.01.016 · DOI
  47. 10.1186/2051-5960-2-50 · DOI
  48. 10.1016/j.neurobiolaging.2004.09.016 · DOI
  49. 10.1016/j.mad.2009.12.007 · DOI
  50. 10.1186/s12881-014-0131-4 · DOI
  51. 10.3109/21678421.2013.839708 · DOI
  52. 10.1523/JNEUROSCI.3049-12.2012 · DOI
  53. 10.1089/ars.2015.6549 · DOI
  54. 10.1093/hmg/ddw073 · DOI
  55. 10.1074/jbc.M409876200 · DOI
  56. 10.1074/jbc.274.10.6483 · DOI · Paper page
  57. 10.1093/brain/awt323 · DOI · Paper page
  58. 10.1016/j.freeradbiomed.2011.11.003 · DOI
  59. 10.1002/glia.20947 · DOI

Cited by

Sorted by citations

Metadata

Authors
Pajares, M., Jiménez-Moreno, N., García-Yagüe, Á. J., Escoll, M., de Ceballos, M. L., Van Leuven, F., Rábano, A., Yamamoto, M., Rojo, A. I., & Cuadrado, A.
Affiliations
  • Instituto de Investigaciones Biomédicas “Alberto Sols” UAM-CSIC, Instituto de Investigación Sanitaria La Paz (IdiPaz) and Department of Biochemistry, Faculty of Medicine, Autonomous University of Madrid
  • Centro de Investigación Biomédica en Red sobre Enfermedades Neurodegenerativas (CIBERNED), ISCIII
  • Experimental Genetics Group-LEGTEGG, Department of Human Genetics, KU Leuven
  • Unidad de Investigación Proyecto Alzheimer, Fundación CIEN, Instituto de Salud Carlos III
  • Tohoku University Graduate School of Medicine
Venue
Autophagy
Published
2016-08-19
Volume
12
Issue
10
Pages
1902-1916
ISSN
  • 1554-8627
  • 1554-8635
Cited by
392
References
15
Language
en

About these checks

Registry, retraction, Cites and statistics results are computed, not judged, with one exception: a printed reference that no index lists is read once by a model before it counts as a citation error. Claims are extracted by a model and kept only when their quote appears verbatim in the text; each cited source is then checked, with a model’s help, for whether it says what the claim relies on. Those verdicts can be wrong — read the claim’s quote and the cited source before relying on one.

Statistics and arithmetic are recomputed, not judged.

Confidence bands are shown only for fields calibrated on our annotated test set. None is calibrated yet, so no band is shown.

What counts as a claim ›How we measure confidence ›How we check this ›

Are you an author, or do you see a problem with this page? Request a review