

The DOI matches its Crossref record; 75 of the 76 references it cites were found in a registry or an index, and 1 are not checked yet; none of the 28 sources its claims cite is checked for support yet.
Microplastics and nanoplastics science: collecting and characterizing airborne microplastics in fine particulate matter
Open accessAbstract
Microplastic (MP) pollution in the environment is increasing, leading to growing concerns about human exposures and the subsequent impact on health. Although marine MP research has received significant attention in recent years, only a few studies have attempted characterization of MP in air and examined the MP uptake and influence via inhalation on human health. Moreover, the methods used for MP characterization in the marine environment require further optimization to be applicable to MP in the air. This paper details method for collecting and characterizing MP < 2.5 μm in air samples for the purposes of toxicological assessment. The first phase of the study evaluated (a) the suitability of various filter types to collect respirable airborne MP <2.5 μm, and; (b) the ability of Raman and enhanced darkfield-hyperspectral spectroscopy methods to identify MP reference standards collected from spiked filters and in cells after exposure to reference MP. In the second phase, these methods were employed to characterize MP <2.5 μm in personal, indoor and outdoor filter air samples and in cells following exposure to filter extracted material. The results showed the presence of a variety of MP in the respirable size fraction (0.1–1 µm aerodynamic diameter). Silver membrane filters were found not suitable for collecting and analyzing MP <2.5 μm. While it was easy to detect reference MP in cells post-exposure, the identity of only two types of air-borne MP was confirmed in cells. The study highlighted possible sources of artifacts and inconsistencies in analyzing airborne MP.
Checked 2026-11-12 · 1 reference not checked yet
Overview
AI snapshot
Written from the paper’s full text.
TL;DR
This methods paper optimized collection and characterization of airborne microplastics <2.5 µm in PM2.5 using Raman spectroscopy and enhanced darkfield-hyperspectral imaging (EDF-HSI). It found silver membrane filters unsuitable, Teflon filters suitable, and confirmed diverse respirable microplastics in personal, indoor, and outdoor air and in A549 cells after exposure.
Key findings
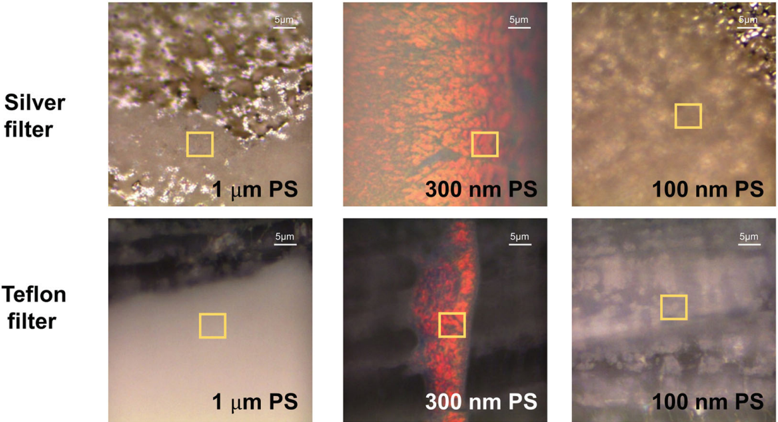
- Silver membrane filters were not suitable for collecting and analyzing microplastics <2.5 µm: silver interacted with polystyrene and LDPE, modified Raman spectra, and the mottled filter appearance hindered visualization; Teflon filters were suitable for extraction.
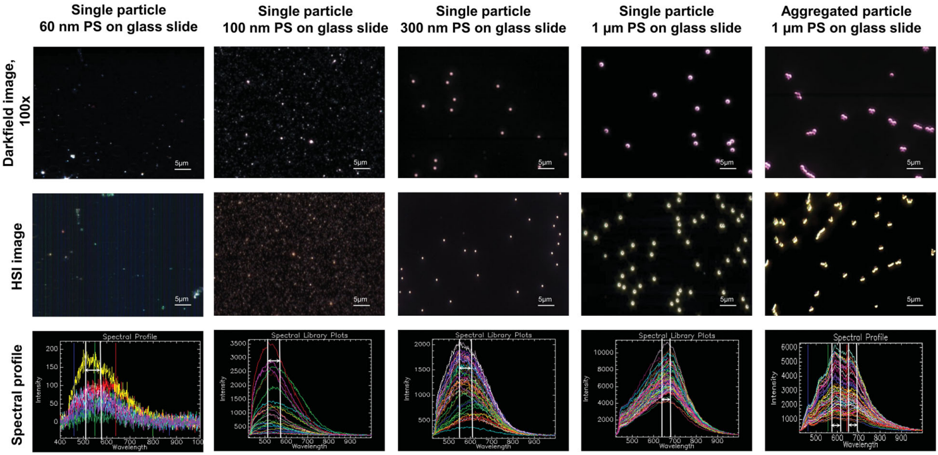
- Raman required CaF₂ slides and 532 nm excitation; the C–H stretching region was most useful because Carbon Black masked fingerprint regions. EDF-HSI gave size-specific polystyrene peaks at 515–575 nm (60 nm), 525–550 nm (100 nm), 560–610 nm (300 nm), and 665–675 nm (1 µm), with aggregated 1 µm particles showing a bimodal peak at 600 and 675 nm.
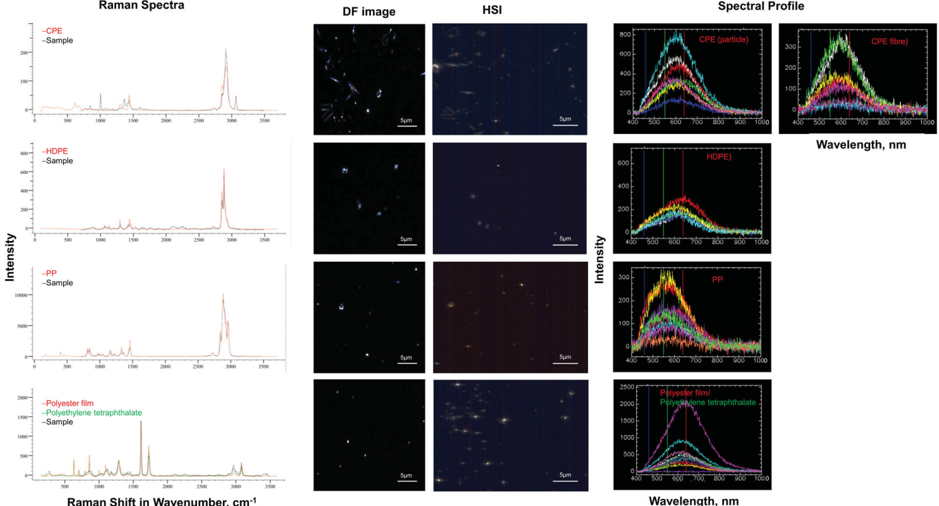
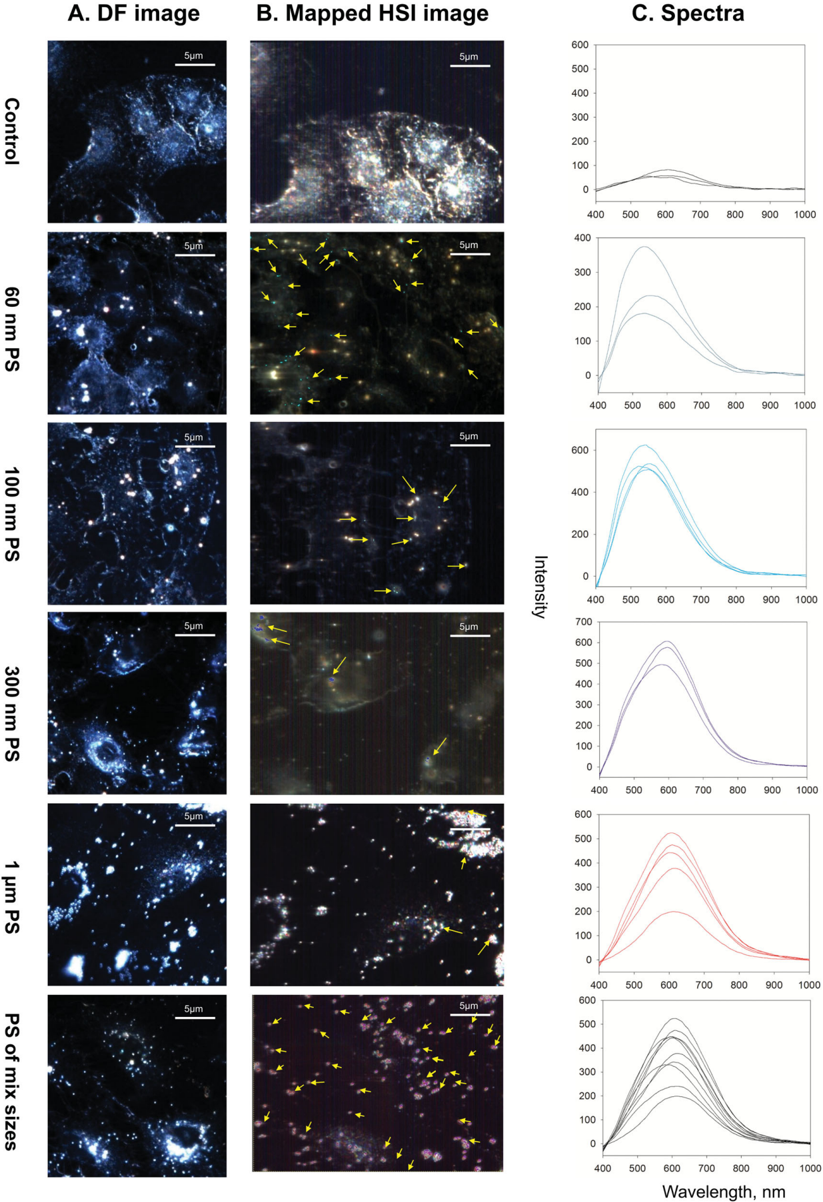
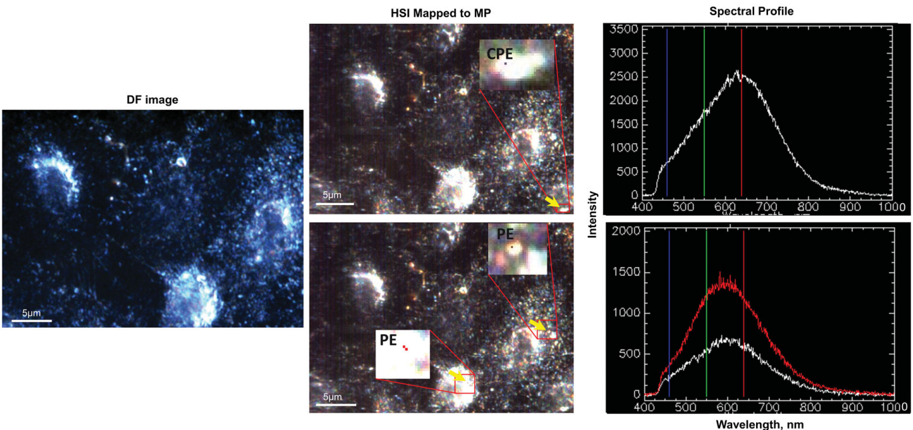
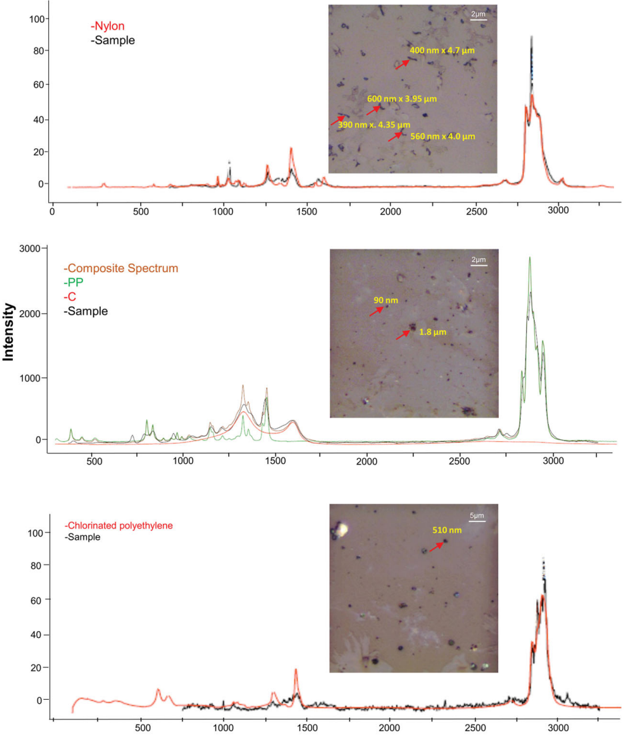
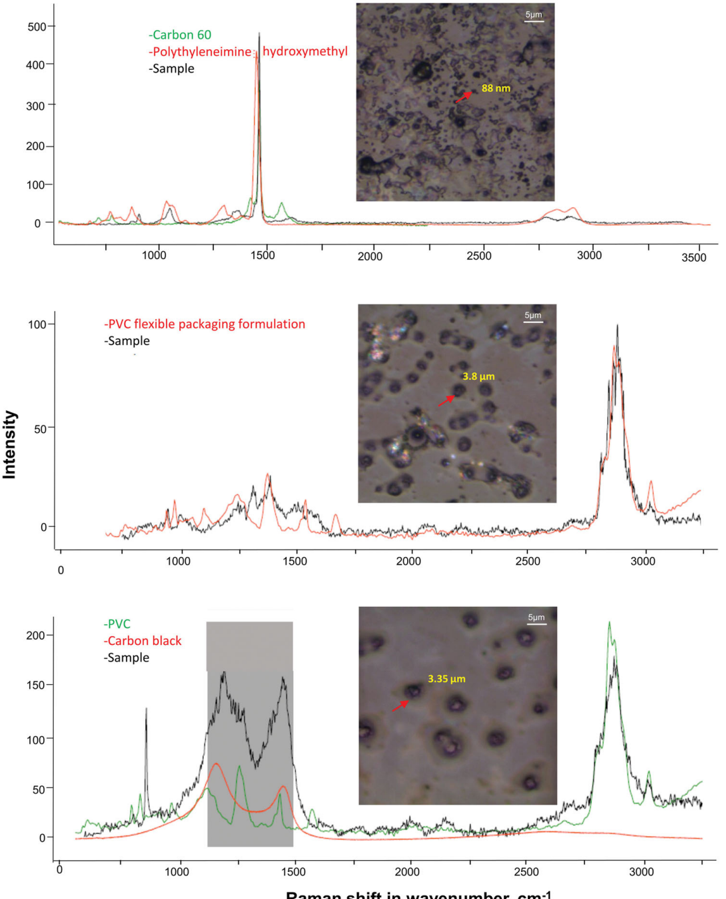
- In air samples, nylon was present in almost all samples and made up 72% of total microplastics identified, with about 30% of nylon being fibers; other polymers included PP, PE, CPE, styrene copolymer, PVC packaging formulation, and PUR. In cells exposed to air extracts, none of the reference polystyrene spectra matched, but two of four UV-irradiated plastic libraries—CPE and PE—matched particles.
- Automated Particle Finder identification had 99% success in spiked samples but only 30% in environmental samples; analyzing 20 particles took 15–30 min versus about 1.5 h manually. Reference microplastics at 25 or 50 µg/mL did not cause appreciable loss of A549 cell viability.
Methods
- Two-phase design: Phase 1 tested filter types and analytical methods with reference microplastics—polystyrene beads (1 µm, 300 nm, 100 nm, 60 nm), ETFE (~300 nm), LDPE, nylon, and PP—on Teflon, silver membrane, and CaF₂ substrates; Phase 2 characterized microplastics <2.5 µm in personal, indoor, and outdoor PM2.5 filters and in A549 cells exposed to filter extracts.
- Air samples included 24 h personal 37 mm Teflon filters from 54 children with asthma in Montreal, 7-day outdoor 47 mm Teflon and indoor/outdoor 37 mm Teflon filters from a Montreal congestive heart failure study, and new 96 h indoor 37 mm silver membrane filters. Extraction used methanol and 10 min sonication; Raman used 532 nm excitation with HQI >0.70 for identification, and EDF-HSI used spectral angle mapping at 0.1 radians.
- A549 cells were exposed for 24 h to 50 µg/mL individual or mixed polystyrene particles or to 10 µL of air filter extract; viability was measured by Trypan blue exclusion.
Limitations
- Stated in the paper: the microplastic list is not complete because of insufficient extracted material, high background chemical constituents, and time-consuming protocols; identified microplastics were not characterized for surface organic/inorganic composition; EDF-HSI requires a priori knowledge and reference spectral libraries that are not publicly available; extracted microplastics could not be quantified, so toxicity conclusions are premature; validation was performed only for clean filters spiked with polystyrene, not for real air samples.
- Evident from the text: silver membrane filters chemically transformed microplastics during extraction; 30% H₂O₂ damaged microplastics; sonication longer than 10 min degraded filters and contaminated samples; Raman could not detect individual 60 nm polystyrene, and Raman signatures below 1 µm on filters referred to concentrated aggregates rather than singular particles.
- Evident from the text: Carbon Black masked microplastic Raman signatures in many samples, and the study could not comprehensively analyze all potential airborne microplastics.
Model-written summary. Check it against the paper before relying on it.
Integrity signals
Registry
Cites
Statistics
Figures



Verification
Claims the paper makes
104 Own result · 36 Own interpretation · 9 Check pending · 9 Own method · 6 Not checked yet · 4 No full text of the sources · 4 No basis given · 1 Sources not found
A result the paper reports from its own data — it cites no other source for it, so there is none to check. The quote shows it is in the paper.
In the paper
“The results showed the presence of a variety of MP in the respirable size fraction (0.1-1 mm aerodynamic diameter).”
§ Microplastics and nanoplastics science: collecting and characterizing airborne microplastics in fine particulate matter > Abstract
plain- Asserted: passes — The authors put it forward as true.
- Checkable: passes — It can be checked against evidence.
- Load-bearing: passes — The paper’s conclusions depend on it.
- Based: passes — The paper gives a reason why it holds.
A result the paper reports from its own data — it cites no other source for it, so there is none to check. The quote shows it is in the paper.
In the paper
“Particles could be mapped to PS with 'KnowItAll' with higher accuracy (HQI > 0.95) when 1200 line mm À1 grating was applied.”
§ Microplastics and nanoplastics science: collecting and characterizing airborne microplastics in fine particulate matter > 3.1. Raman analysis of air sampling filters, substrates, and extracted MP
hedgedstates a cause- Asserted: passes — The authors put it forward as true.
- Checkable: passes — It can be checked against evidence.
- Load-bearing: unclear — It is unclear whether the paper’s conclusions depend on it.
- Based: passes — The paper gives a reason why it holds.
A result the paper reports from its own data — it cites no other source for it, so there is none to check. The quote shows it is in the paper.
In the paper
“While it was easy to detect reference MP in cells postexposure, the identity of only two types of air-borne MP was confirmed in cells.”
§ Microplastics and nanoplastics science: collecting and characterizing airborne microplastics in fine particulate matter > Abstract
plain- Asserted: passes — The authors put it forward as true.
- Checkable: passes — It can be checked against evidence.
- Load-bearing: passes — The paper’s conclusions depend on it.
- Based: passes — The paper gives a reason why it holds.
A result the paper reports from its own data — it cites no other source for it, so there is none to check. The quote shows it is in the paper.
In the paper
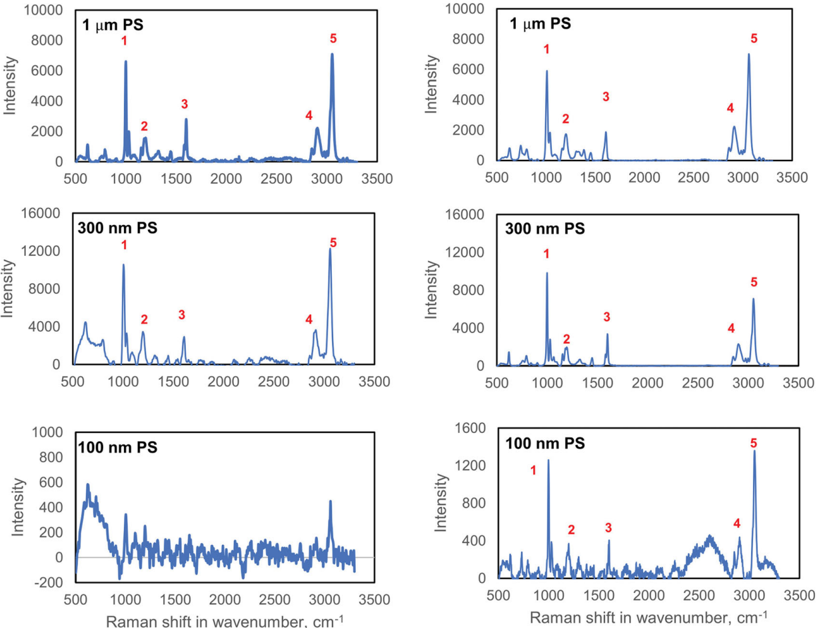
“Raman characterization of single PS particles deposited on silver membrane filter or on Teflon filter was not attainable.”
§ Microplastics and nanoplastics science: collecting and characterizing airborne microplastics in fine particulate matter > 3.1. Raman analysis of air sampling filters, substrates, and extracted MP
plain- Asserted: passes — The authors put it forward as true.
- Checkable: passes — It can be checked against evidence.
- Load-bearing: unclear — It is unclear whether the paper’s conclusions depend on it.
- Based: passes — The paper gives a reason why it holds.
A result the paper reports from its own data — it cites no other source for it, so there is none to check. The quote shows it is in the paper.
In the paper
“However, the band for an aromatic ring at $990 cm À1 , bands at 2900 cm À1 due to the aliphatic C-H stretching and at 3100 cm À1 due to the aromatic C-H stretching could be distinguished.”
§ Microplastics and nanoplastics science: collecting and characterizing airborne microplastics in fine particulate matter > 3.1. Raman analysis of air sampling filters, substrates, and extracted MP
hedged- Asserted: passes — The authors put it forward as true.
- Checkable: passes — It can be checked against evidence.
- Load-bearing: unclear — It is unclear whether the paper’s conclusions depend on it.
- Based: passes — The paper gives a reason why it holds.
A result the paper reports from its own data — it cites no other source for it, so there is none to check. The quote shows it is in the paper.
In the paper
“Raman signals for 100 nm PS deposited on silver membrane filter or on Teflon filter were very noisy (Figure 1(B) and 2(C)).”
§ Microplastics and nanoplastics science: collecting and characterizing airborne microplastics in fine particulate matter > 3.1. Raman analysis of air sampling filters, substrates, and extracted MP
plain- Asserted: passes — The authors put it forward as true.
- Checkable: passes — It can be checked against evidence.
- Load-bearing: passes — The paper’s conclusions depend on it.
- Based: passes — The paper gives a reason why it holds.
A result the paper reports from its own data — it cites no other source for it, so there is none to check. The quote shows it is in the paper.
In the paper
“The blank soda-lime-silica glass slide yielded strong Raman peaks at 579 cm À1 and 1100-1350 cm À1 , which poses interference concerns for MP analysis.”
§ Microplastics and nanoplastics science: collecting and characterizing airborne microplastics in fine particulate matter > 3.1. Raman analysis of air sampling filters, substrates, and extracted MP
plainstates a causeSingle case- Asserted: passes — The authors put it forward as true.
- Checkable: passes — It can be checked against evidence.
- Load-bearing: passes — The paper’s conclusions depend on it.
- Based: passes — The paper gives a reason why it holds.
A result the paper reports from its own data — it cites no other source for it, so there is none to check. The quote shows it is in the paper.
In the paper
“Since the spectra of MP obtained at 785 nm were weak and of low resolution even with 10 accumulations, 25 mW laser intensity (Supplementary Figure 2) the spectra of all samples were acquired at 532 nm.”
§ Microplastics and nanoplastics science: collecting and characterizing airborne microplastics in fine particulate matter > 3.1. Raman analysis of air sampling filters, substrates, and extracted MP
plain- Asserted: passes — The authors put it forward as true.
- Checkable: passes — It can be checked against evidence.
- Load-bearing: passes — The paper’s conclusions depend on it.
- Based: passes — The paper gives a reason why it holds.
A result the paper reports from its own data — it cites no other source for it, so there is none to check. The quote shows it is in the paper.
In the paper
“Silver membrane filters were found not suitable for collecting and analyzing MP <2.5 lm.”
§ Microplastics and nanoplastics science: collecting and characterizing airborne microplastics in fine particulate matter > Abstract
plain- Asserted: passes — The authors put it forward as true.
- Checkable: passes — It can be checked against evidence.
- Load-bearing: passes — The paper’s conclusions depend on it.
- Based: passes — The paper gives a reason why it holds.
A result the paper reports from its own data — it cites no other source for it, so there is none to check. The quote shows it is in the paper.
In the paper
“As ambient light produced a sharp band at 2400 cm À1 (Supplementary Figure 3), Raman analyses were conducted in the absence of ambient light.”
§ Microplastics and nanoplastics science: collecting and characterizing airborne microplastics in fine particulate matter > 3.1. Raman analysis of air sampling filters, substrates, and extracted MP
plainstates a cause- Asserted: passes — The authors put it forward as true.
- Checkable: passes — It can be checked against evidence.
- Load-bearing: passes — The paper’s conclusions depend on it.
- Based: passes — The paper gives a reason why it holds.
- It may state two separate claims as one. 50
- The quote only partly states this claim. 6
- Probably not a substantial claim. 23
A result the paper reports from its own data — it cites no other source for it, so there is none to check. The quote shows it is in the paper.
In the paper
“The CaF 2 slide showed a sharp band at 319 cm À1 (Supplementary Figure 1A bottom right panel), but no background signal in the region of interest for MP analysis (500-3400 cm À1 ) (Supplementary Figure 1A bottom right panel insert).”
§ Microplastics and nanoplastics science: collecting and characterizing airborne microplastics in fine particulate matter > 3.1. Raman analysis of air sampling filters, substrates, and extracted MP
plainSingle case- Asserted: passes — The authors put it forward as true.
- Checkable: passes — It can be checked against evidence.
- Load-bearing: passes — The paper’s conclusions depend on it.
- Based: passes — The paper gives a reason why it holds.
It may state two separate claims as one.
A result the paper reports from its own data — it cites no other source for it, so there is none to check. The quote shows it is in the paper.
In the paper
“The silver membrane filter showed a band at $235 cm À1 (Supplementary Figure 1B top right panel) but no other significant peaks in the region of 250 cm À1 to 3250 cm À1 (the region in which MP signature is expected).”
§ Microplastics and nanoplastics science: collecting and characterizing airborne microplastics in fine particulate matter > 3.1. Raman analysis of air sampling filters, substrates, and extracted MP
plain- Asserted: passes — The authors put it forward as true.
- Checkable: passes — It can be checked against evidence.
- Load-bearing: passes — The paper’s conclusions depend on it.
- Based: passes — The paper gives a reason why it holds.
It may state two separate claims as one.
A result the paper reports from its own data — it cites no other source for it, so there is none to check. The quote shows it is in the paper.
In the paper
“However, in this study, we found the C-H stretching region was most pertinent for MP classification, as the fingerprint regions (800-1800 cm À1 ) of the collected Raman spectra were impacted by Carbon Black present in airborne particulates.”
§ Microplastics and nanoplastics science: collecting and characterizing airborne microplastics in fine particulate matter > 3.1. Raman analysis of air sampling filters, substrates, and extracted MP
plainstates a cause- Asserted: passes — The authors put it forward as true.
- Checkable: passes — It can be checked against evidence.
- Load-bearing: passes — The paper’s conclusions depend on it.
- Based: passes — The paper gives a reason why it holds.
It may state two separate claims as one.
A result the paper reports from its own data — it cites no other source for it, so there is none to check. The quote shows it is in the paper.
In the paper
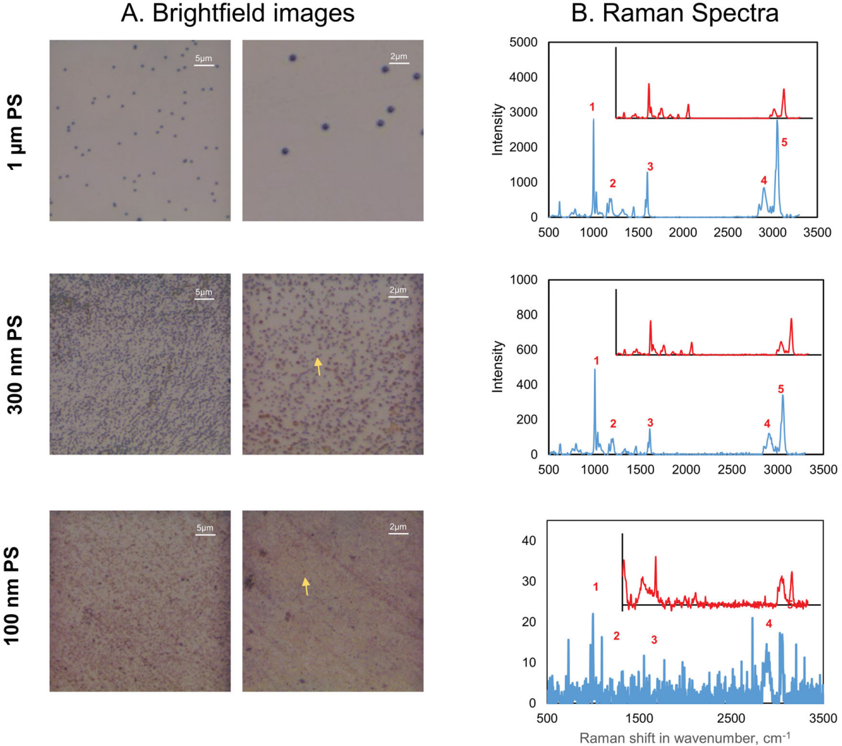
“Similar spectral profiles were obtained for single 1 mm and 300 nm PS particles deposited on CaF 2 slides (Figure 2(B)) using 600 and 1200 line mm À1 grating at 10 mW.”
§ Microplastics and nanoplastics science: collecting and characterizing airborne microplastics in fine particulate matter > 3.1. Raman analysis of air sampling filters, substrates, and extracted MP
plain- Asserted: passes — The authors put it forward as true.
- Checkable: passes — It can be checked against evidence.
- Load-bearing: unclear — It is unclear whether the paper’s conclusions depend on it.
- Based: passes — The paper gives a reason why it holds.
The quote only partly states this claim.
A result the paper reports from its own data — it cites no other source for it, so there is none to check. The quote shows it is in the paper.
In the paper
“The Teflon filter showed bands in the backbone fingerprint region (a strong band at $733 cm À1 and small bands at 1200-1350 cm À1 ) but no bands in the fingerprint C-H stretching region 2900-3300 cm À1 (Figure 1(B) bottom right panel).”
§ Microplastics and nanoplastics science: collecting and characterizing airborne microplastics in fine particulate matter > 3.1. Raman analysis of air sampling filters, substrates, and extracted MP
plain- Asserted: passes — The authors put it forward as true.
- Checkable: passes — It can be checked against evidence.
- Load-bearing: passes — The paper’s conclusions depend on it.
- Based: passes — The paper gives a reason why it holds.
It may state two separate claims as one.
A result the paper reports from its own data — it cites no other source for it, so there is none to check. The quote shows it is in the paper.
In the paper
“The spectra obtained for 100 nm PS from both filters were much noisier than those obtained for 1 mm and 300 nm PS (Figure 1(B,C)) due to the sensitivity limitations of the instrument.”
§ Microplastics and nanoplastics science: collecting and characterizing airborne microplastics in fine particulate matter > 3.1. Raman analysis of air sampling filters, substrates, and extracted MP
plainstates a cause- Asserted: passes — The authors put it forward as true.
- Checkable: passes — It can be checked against evidence.
- Load-bearing: passes — The paper’s conclusions depend on it.
- Based: passes — The paper gives a reason why it holds.
The quote only partly states this claim.
A result the paper states — it cites no source for it, so there is none to check. The quote shows it is in the paper.
In the paper
“Silver membrane filters were found more suitable to Teflon for direct mounting and enabled analysis of large single or aggregated MP of 5 mm or larger, deposited on the filter.”
§ Microplastics and nanoplastics science: collecting and characterizing airborne microplastics in fine particulate matter > 3.1. Raman analysis of air sampling filters, substrates, and extracted MP
plainstates a cause- Asserted: passes — The authors put it forward as true.
- Checkable: passes — It can be checked against evidence.
- Load-bearing: passes — The paper’s conclusions depend on it.
- Based: passes — The paper gives a reason why it holds.
It may state two separate claims as one.
A result the paper reports from its own data — it cites no other source for it, so there is none to check. The quote shows it is in the paper.
In the paper
“Nylon was present in almost all samples investigated being 72% of total MP identified.”
§ Microplastics and nanoplastics science: collecting and characterizing airborne microplastics in fine particulate matter > 4. Discussion
plain- Asserted: passes — The authors put it forward as true.
- Checkable: passes — It can be checked against evidence.
- Load-bearing: unclear — It is unclear whether the paper’s conclusions depend on it.
- Based: passes — The paper gives a reason why it holds.
It may state two separate claims as one.
A result the paper reports from its own data — it cites no other source for it, so there is none to check. The quote shows it is in the paper.
In the paper
“Aggregated 1 mm PS particles showed a bimodal broad peak with the first peak at 600 nm and the second peak at 675 nm.”
§ Microplastics and nanoplastics science: collecting and characterizing airborne microplastics in fine particulate matter > 3.2.1. EDF-HSI detection of reference MP in cells post-exposure
plain- Asserted: fails — The authors may not put it forward as true.
- Checkable: passes — It can be checked against evidence.
- Load-bearing: fails — The paper’s conclusions may not depend on it.
- Based: fails — The paper may give no reason why it holds.
Probably not a substantial claim. The authors may not put it forward as true. The paper’s conclusions may not depend on it. The paper may give no reason why it holds.
The paper states this without a source or data behind it here, so there is nothing to check it against. The quote shows it is in the paper.
In the paper
“Moreover, silver on the membrane interacted with MP and chemically transformed them during the extraction process, resulting in the loss of MP signature spectral signals.”
§ Microplastics and nanoplastics science: collecting and characterizing airborne microplastics in fine particulate matter > 4. Discussion
plainstates a cause- Asserted: passes — The authors put it forward as true.
- Checkable: passes — It can be checked against evidence.
- Load-bearing: passes — The paper’s conclusions depend on it.
- Based: unclear — It is unclear why the paper says it holds.
It may state two separate claims as one.
A result the paper reports from its own data — it cites no other source for it, so there is none to check. The quote shows it is in the paper.
In the paper
“These polymers include, Nylon fibers, particles of PP, PE, CPE, styrene copolymer, polyvinyl chloride (PVC) packaging formulation, and polyurethane (PUR) contaminated with Flex blue (especially rubber containing blue dye).”
§ Microplastics and nanoplastics science: collecting and characterizing airborne microplastics in fine particulate matter > 3.3. Detection and characterization of MP from air samples
plain- Asserted: passes — The authors put it forward as true.
- Checkable: passes — It can be checked against evidence.
- Load-bearing: unclear — It is unclear whether the paper’s conclusions depend on it.
- Based: passes — The paper gives a reason why it holds.
It may state two separate claims as one.
A result the paper reports from its own data — it cites no other source for it, so there is none to check. The quote shows it is in the paper.
In the paper
“Specific to air or environmental samples, the current study found the region between 400 and 2000 cm À1 is overwhelmed with contaminants (Carbon Black) possible arising from tire wear and thus, the less crowded regions from 2700-3300 cm À1 are required to characterize MP.”
§ Microplastics and nanoplastics science: collecting and characterizing airborne microplastics in fine particulate matter > 4. Discussion
hedgedstates a cause- Asserted: passes — The authors put it forward as true.
- Checkable: passes — It can be checked against evidence.
- Load-bearing: passes — The paper’s conclusions depend on it.
- Based: passes — The paper gives a reason why it holds.
It may state two separate claims as one.
A result the paper reports from its own data — it cites no other source for it, so there is none to check. The quote shows it is in the paper.
In the paper
“The results obtained from these analyses showed a high degree of accuracy in identifying MP from a field of view if (a) it was not crowded or consisted of less than 20 particles (Supplementary Figure 9) and (b) particles were of uniform size.”
§ Microplastics and nanoplastics science: collecting and characterizing airborne microplastics in fine particulate matter > 3.4. Automating the detection of MP using particle finder
plainstates an association- Asserted: passes — The authors put it forward as true.
- Checkable: passes — It can be checked against evidence.
- Load-bearing: passes — The paper’s conclusions depend on it.
- Based: passes — The paper gives a reason why it holds.
It may state two separate claims as one.
In the paper
“Though these interfering peaks become less dominating in the case of large MP ! 5 mm allowing characterization (Wright, Levermore, and Kelly 2019), they hinder the characterization of MP 2.5 mm.”
§ Microplastics and nanoplastics science: collecting and characterizing airborne microplastics in fine particulate matter > 4. Discussion
What the sources say
- Check pendingcites Wright, Levermore, and Kelly 2019 source
plainstates a cause- Asserted: passes — The authors put it forward as true.
- Checkable: passes — It can be checked against evidence.
- Load-bearing: passes — The paper’s conclusions depend on it.
- Based: passes — The paper gives a reason why it holds.
It may state two separate claims as one.
A result the paper reports from its own data — it cites no other source for it, so there is none to check. The quote shows it is in the paper.
In the paper
“The abundance of Carbon Black was much higher in the samples collected on the 37 mm filters compared to the samples collected on 47 mm filters for the MCHF study and hence it was very difficult to distinguish MP from other particles present on the 37 mm filters (Figure 9).”
§ Microplastics and nanoplastics science: collecting and characterizing airborne microplastics in fine particulate matter > 3.3. Detection and characterization of MP from air samples
plainstates a cause- Asserted: passes — The authors put it forward as true.
- Checkable: passes — It can be checked against evidence.
- Load-bearing: passes — The paper’s conclusions depend on it.
- Based: passes — The paper gives a reason why it holds.
It may state two separate claims as one.
None of the sources cited for this claim have been checked yet.
In the paper
“However, it was possible to obtain a clear Raman signature of an MP with a diameter smaller than 1 mm (spatial lateral resolution or $360 nm) on CaF 2 slide at 532 nm even though the diameter of the laser spot was larger by aligning the center of nano plastic (NP) and the center of the laser spot.”
§ Microplastics and nanoplastics science: collecting and characterizing airborne microplastics in fine particulate matter > 4. Discussion
hedgedstates a cause- Asserted: passes — The authors put it forward as true.
- Checkable: passes — It can be checked against evidence.
- Load-bearing: passes — The paper’s conclusions depend on it.
- Based: passes — The paper gives a reason why it holds.
The quote only partly states this claim.
A result the paper reports from its own data — it cites no other source for it, so there is none to check. The quote shows it is in the paper.
In the paper
“Sonication for more than 10 min caused degradation of the filters and contamination of the extracted samples with filter debris.”
§ Microplastics and nanoplastics science: collecting and characterizing airborne microplastics in fine particulate matter > 3.2. Extracting PS from the Teflon and silver membrane filters
plainstates a cause- Asserted: passes — The authors put it forward as true.
- Checkable: passes — It can be checked against evidence.
- Load-bearing: passes — The paper’s conclusions depend on it.
- Based: passes — The paper gives a reason why it holds.
It may state two separate claims as one.
A result the paper reports from its own data — it cites no other source for it, so there is none to check. The quote shows it is in the paper.
In the paper
“The fact that the background signal from the slide did not interfere with the Raman signal for MP also enabled confirmation of the presence of airborne MP.”
§ Microplastics and nanoplastics science: collecting and characterizing airborne microplastics in fine particulate matter > 4. Discussion
plainstates a cause- Asserted: passes — The authors put it forward as true.
- Checkable: passes — It can be checked against evidence.
- Load-bearing: passes — The paper’s conclusions depend on it.
- Based: passes — The paper gives a reason why it holds.
It may state two separate claims as one.
A result the paper states — it cites no source for it, so there is none to check. The quote shows it is in the paper.
In the paper
“The presence of carbonaceous materials was low in these samples, which facilitated the easy identification of plastic polymers.”
§ Microplastics and nanoplastics science: collecting and characterizing airborne microplastics in fine particulate matter > 3.3. Detection and characterization of MP from air samples
plainstates a cause- Asserted: passes — The authors put it forward as true.
- Checkable: passes — It can be checked against evidence.
- Load-bearing: unclear — It is unclear whether the paper’s conclusions depend on it.
- Based: passes — The paper gives a reason why it holds.
It may state two separate claims as one.
None of the sources cited for this claim have been checked yet.
In the paper
“Thus, the mottled appearance of silver membrane filters interferes with the direct visualization of particles deposited on the membrane and nanoarrays formed during the process of extraction interfere with Raman spectral mapping.”
§ Microplastics and nanoplastics science: collecting and characterizing airborne microplastics in fine particulate matter > 3.2. Extracting PS from the Teflon and silver membrane filters
plainstates a cause- Asserted: passes — The authors put it forward as true.
- Checkable: passes — It can be checked against evidence.
- Load-bearing: passes — The paper’s conclusions depend on it.
- Based: passes — The paper gives a reason why it holds.
It may state two separate claims as one.
A result the paper reports from its own data — it cites no other source for it, so there is none to check. The quote shows it is in the paper.
In the paper
“Most MP found were nylon with $30% of them being fibers (Figure 8), which is a cause for concern.”
§ Microplastics and nanoplastics science: collecting and characterizing airborne microplastics in fine particulate matter > 4. Discussion
plain- Asserted: passes — The authors put it forward as true.
- Checkable: passes — It can be checked against evidence.
- Load-bearing: passes — The paper’s conclusions depend on it.
- Based: passes — The paper gives a reason why it holds.
It may state two separate claims as one.
A result the paper reports from its own data — it cites no other source for it, so there is none to check. The quote shows it is in the paper.
In the paper
“The peak for the 300 nm ETFE was less skewed than those for the 300 nm PS and was observed at 575-605 nm (Supplementary Figure 5).”
§ Microplastics and nanoplastics science: collecting and characterizing airborne microplastics in fine particulate matter > 3.2.1. EDF-HSI detection of reference MP in cells post-exposure
plain- Asserted: passes — The authors put it forward as true.
- Checkable: passes — It can be checked against evidence.
- Load-bearing: unclear — It is unclear whether the paper’s conclusions depend on it.
- Based: passes — The paper gives a reason why it holds.
It may state two separate claims as one.
A result the paper reports from its own data — it cites no other source for it, so there is none to check. The quote shows it is in the paper.
In the paper
“The results showed that it was possible to detect the presence of multiple types of MP in outdoor, indoor and personal air samples, although the overabundance of Carbon Black impeded their detection in the outdoor air samples.”
§ Microplastics and nanoplastics science: collecting and characterizing airborne microplastics in fine particulate matter > 4. Discussion
hedgedstates a cause- Asserted: passes — The authors put it forward as true.
- Checkable: passes — It can be checked against evidence.
- Load-bearing: passes — The paper’s conclusions depend on it.
- Based: passes — The paper gives a reason why it holds.
It may state two separate claims as one.
A result the paper reports from its own data — it cites no other source for it, so there is none to check. The quote shows it is in the paper.
In the paper
“Sonication of filters in water (Supplementary Figure 4B) or methanol (data not shown) for 5 min resulted in insufficient material and weak and noisy Raman spectra.”
§ Microplastics and nanoplastics science: collecting and characterizing airborne microplastics in fine particulate matter > 3.2. Extracting PS from the Teflon and silver membrane filters
plainstates a cause- Asserted: passes — The authors put it forward as true.
- Checkable: passes — It can be checked against evidence.
- Load-bearing: passes — The paper’s conclusions depend on it.
- Based: passes — The paper gives a reason why it holds.
It may state two separate claims as one.
A result the paper states — it cites no source for it, so there is none to check. The quote shows it is in the paper.
In the paper
“The silver membrane filters were spectrally clean; however, their mottled appearance made it difficult to identify MP visually.”
§ Microplastics and nanoplastics science: collecting and characterizing airborne microplastics in fine particulate matter > 4. Discussion
plainstates a cause- Asserted: passes — The authors put it forward as true.
- Checkable: passes — It can be checked against evidence.
- Load-bearing: unclear — It is unclear whether the paper’s conclusions depend on it.
- Based: passes — The paper gives a reason why it holds.
It may state two separate claims as one.
A result the paper reports from its own data — it cites no other source for it, so there is none to check. The quote shows it is in the paper.
In the paper
“Broad skewed peaks were obtained at 515-575 nm, 525-550 nm, 560-610 nm and 665-675 nm for 60 nm, 100 nm, 300 nm and 1 mm PS particles, respectively (Figure 4).”
§ Microplastics and nanoplastics science: collecting and characterizing airborne microplastics in fine particulate matter > 3.2.1. EDF-HSI detection of reference MP in cells post-exposure
plainstates an association- Asserted: passes — The authors put it forward as true.
- Checkable: passes — It can be checked against evidence.
- Load-bearing: passes — The paper’s conclusions depend on it.
- Based: passes — The paper gives a reason why it holds.
It may state two separate claims as one.
A result the paper states — it cites no source for it, so there is none to check. The quote shows it is in the paper.
In the paper
“Even though PS particles of all sizes could be identified by directly analyzing the silver membrane or Teflon filters, it was difficult to distinguish the single PS particles.”
§ Microplastics and nanoplastics science: collecting and characterizing airborne microplastics in fine particulate matter > 3.1. Raman analysis of air sampling filters, substrates, and extracted MP
plain- Asserted: passes — The authors put it forward as true.
- Checkable: passes — It can be checked against evidence.
- Load-bearing: passes — The paper’s conclusions depend on it.
- Based: passes — The paper gives a reason why it holds.
It may state two separate claims as one.
The paper states this without a source or data behind it here, so there is nothing to check it against. The quote shows it is in the paper.
In the paper
“The diameters of the particles ranged from 0.2 to 3 mm.”
§ Microplastics and nanoplastics science: collecting and characterizing airborne microplastics in fine particulate matter > 3.4. Automating the detection of MP using particle finder
plain- Asserted: fails — The authors may not put it forward as true.
- Checkable: passes — It can be checked against evidence.
- Load-bearing: fails — The paper’s conclusions may not depend on it.
- Based: fails — The paper may give no reason why it holds.
Probably not a substantial claim. The authors may not put it forward as true. The paper’s conclusions may not depend on it. The paper may give no reason why it holds.
A result the paper states — it cites no source for it, so there is none to check. The quote shows it is in the paper.
In the paper
“In cells exposed to air extracts, the HSI obtained from the field of view of the darkfield images were mapped to all available spectral libraries.”
§ Microplastics and nanoplastics science: collecting and characterizing airborne microplastics in fine particulate matter > 3.2.1. EDF-HSI detection of reference MP in cells post-exposure
plain- Asserted: passes — The authors put it forward as true.
- Checkable: passes — It can be checked against evidence.
- Load-bearing: passes — The paper’s conclusions depend on it.
- Based: passes — The paper gives a reason why it holds.
Probably not a substantial claim.
A result the paper reports from its own data — it cites no other source for it, so there is none to check. The quote shows it is in the paper.
In the paper
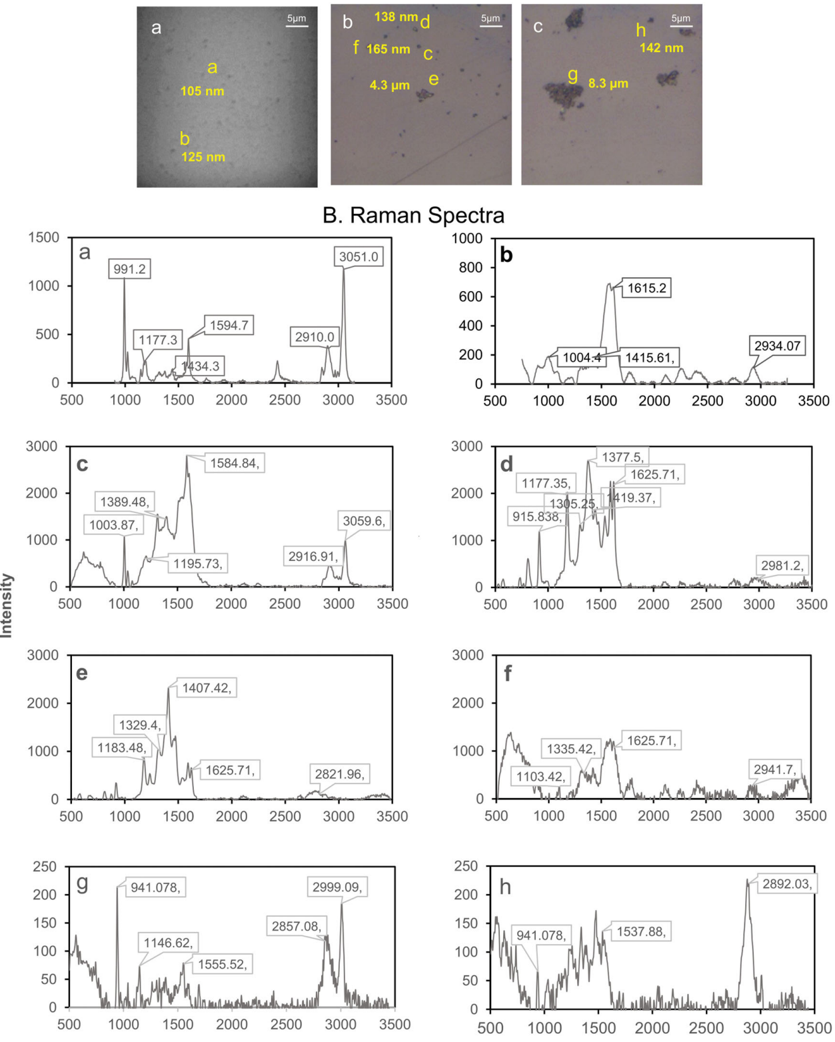
“The Raman spectra of some particles extracted at 2 h post-deposition showed typical signatures known for PS (Figure 3(B-a)) and for other particles, the band representing the aromatic C-H stretch at $3050 cm À1 , typical of PS was no longer observed (Figure 3(B-b)).”
§ Microplastics and nanoplastics science: collecting and characterizing airborne microplastics in fine particulate matter > 3.2. Extracting PS from the Teflon and silver membrane filters
plain- Asserted: passes — The authors put it forward as true.
- Checkable: passes — It can be checked against evidence.
- Load-bearing: passes — The paper’s conclusions depend on it.
- Based: passes — The paper gives a reason why it holds.
It may state two separate claims as one.
A result the paper reports from its own data — it cites no other source for it, so there is none to check. The quote shows it is in the paper.
In the paper
“The amount of MP in extracted air samples was too low and complexed with other contaminants, because of which spectra libraries for the individual MP types could not be established.”
§ Microplastics and nanoplastics science: collecting and characterizing airborne microplastics in fine particulate matter > 3.5. Hyperspectral imaging for MP in air samples
plainstates a cause- Asserted: passes — The authors put it forward as true.
- Checkable: passes — It can be checked against evidence.
- Load-bearing: passes — The paper’s conclusions depend on it.
- Based: passes — The paper gives a reason why it holds.
It may state two separate claims as one.
A result the paper reports from its own data — it cites no other source for it, so there is none to check. The quote shows it is in the paper.
In the paper
“Many different types of MP compositions were discovered (Table 1) in the MAS samples and consisted mainly of nylon fibers, and particles of PP, PE, CPE, styrene copolymer, PVC packaging formulation, and PUR.”
§ Microplastics and nanoplastics science: collecting and characterizing airborne microplastics in fine particulate matter > 4. Discussion
plain- Asserted: passes — The authors put it forward as true.
- Checkable: passes — It can be checked against evidence.
- Load-bearing: unclear — It is unclear whether the paper’s conclusions depend on it.
- Based: passes — The paper gives a reason why it holds.
It may state two separate claims as one.
A result the paper reports from its own data — it cites no other source for it, so there is none to check. The quote shows it is in the paper.
In the paper
“Similar to what was observed for PS particles, the Raman spectra of some extracted LDPE particles showed typical signatures (Figure 3(B-g)) and some showed enhanced band activities in the 1200-1625 cm À1 region (Figure 3(B-h)).”
§ Microplastics and nanoplastics science: collecting and characterizing airborne microplastics in fine particulate matter > 3.2. Extracting PS from the Teflon and silver membrane filters
plain- Asserted: passes — The authors put it forward as true.
- Checkable: passes — It can be checked against evidence.
- Load-bearing: unclear — It is unclear whether the paper’s conclusions depend on it.
- Based: passes — The paper gives a reason why it holds.
It may state two separate claims as one.
A result the paper reports from its own data — it cites no other source for it, so there is none to check. The quote shows it is in the paper.
In the paper
“An adequate sample was extracted by sonicating filters for 10 min both in water (Supplementary Figure 4C) or methanol (Supplementary Figure 4D-E) and spectra were readily identified as PS with high accuracy (greater than 90%) with KnowItAll software.”
§ Microplastics and nanoplastics science: collecting and characterizing airborne microplastics in fine particulate matter > 3.2. Extracting PS from the Teflon and silver membrane filters
plainstates a cause- Asserted: passes — The authors put it forward as true.
- Checkable: passes — It can be checked against evidence.
- Load-bearing: passes — The paper’s conclusions depend on it.
- Based: passes — The paper gives a reason why it holds.
It may state two separate claims as one.
A result the paper reports from its own data — it cites no other source for it, so there is none to check. The quote shows it is in the paper.
In the paper
“Both micron (1 mm) size and nano-size (300 nm) PS particles could be accur- ately identified by the Raman technique (Supplementary Figure 4C-D).”
§ Microplastics and nanoplastics science: collecting and characterizing airborne microplastics in fine particulate matter > 3.2. Extracting PS from the Teflon and silver membrane filters
hedged- Asserted: passes — The authors put it forward as true.
- Checkable: passes — It can be checked against evidence.
- Load-bearing: passes — The paper’s conclusions depend on it.
- Based: passes — The paper gives a reason why it holds.
It may state two separate claims as one. The quote only partly states this claim.
A result the paper reports from its own data — it cites no other source for it, so there is none to check. The quote shows it is in the paper.
In the paper
“Sonication using a probe sonicator for any duration damaged the filters and contaminated the samples with filter debris (data not shown).”
§ Microplastics and nanoplastics science: collecting and characterizing airborne microplastics in fine particulate matter > 3.2. Extracting PS from the Teflon and silver membrane filters
plainstates a cause- Asserted: passes — The authors put it forward as true.
- Checkable: passes — It can be checked against evidence.
- Load-bearing: passes — The paper’s conclusions depend on it.
- Based: passes — The paper gives a reason why it holds.
It may state two separate claims as one.
A conclusion the paper draws from its own results — it cites no other source for it, so there is none to check. The quote shows it is in the paper.
In the paper
“However, the limitations of current methods for analyzing MP exposure in air together with lack of MP exposure data have impeded the progress in the field of MP inhalation toxicology.”
§ Microplastics and nanoplastics science: collecting and characterizing airborne microplastics in fine particulate matter > 1. Introduction
plainstates a cause- Asserted: passes — The authors put it forward as true.
- Checkable: passes — It can be checked against evidence.
- Load-bearing: passes — The paper’s conclusions depend on it.
- Based: passes — The paper gives a reason why it holds.
It may state two separate claims as one.
A conclusion the paper draws from its own results — it cites no other source for it, so there is none to check. The quote shows it is in the paper.
In the paper
“However, these studies reported fibers larger than the respirable size fraction, highlighting the need for improved methods for conducting human health-relevant MP research in the air.”
§ Microplastics and nanoplastics science: collecting and characterizing airborne microplastics in fine particulate matter > 1. Introduction
plain- Asserted: passes — The authors put it forward as true.
- Checkable: passes — It can be checked against evidence.
- Load-bearing: passes — The paper’s conclusions depend on it.
- Based: passes — The paper gives a reason why it holds.
It may state two separate claims as one.
What the paper did — it cites no source for this, so there is none to check. The quote shows it is in the paper.
In the paper
“To avoid MP contamination with plastics arising from experimental procedures, the use of labware made of plastic materials was minimized and instead, cotton lab coats, glass tubes and Hamilton syringes were used.”
§ Microplastics and nanoplastics science: collecting and characterizing airborne microplastics in fine particulate matter > 2.4. Extraction of MP from air sampling filters
plainstates a cause- Asserted: passes — The authors put it forward as true.
- Checkable: passes — It can be checked against evidence.
- Load-bearing: passes — The paper’s conclusions depend on it.
- Based: passes — The paper gives a reason why it holds.
Probably not a substantial claim. It may state two separate claims as one.
What the paper did — it cites no source for this, so there is none to check. The quote shows it is in the paper.
In the paper
“The ocular micrometer in the Raman imaging system was calibrated for each objective lens once during instrument setup to confirm the visual resolution.”
§ Microplastics and nanoplastics science: collecting and characterizing airborne microplastics in fine particulate matter > 2.3.1. Reference materials and sample preparation
plain- Asserted: passes — The authors put it forward as true.
- Checkable: passes — It can be checked against evidence.
- Load-bearing: fails — The paper’s conclusions may not depend on it.
- Based: passes — The paper gives a reason why it holds.
Probably not a substantial claim. The paper’s conclusions may not depend on it.
A conclusion the paper draws from its own results — it cites no other source for it, so there is none to check. The quote shows it is in the paper.
In the paper
“Thus, the current state of knowledge of MP in the air is inconsistent and unclear.”
§ Microplastics and nanoplastics science: collecting and characterizing airborne microplastics in fine particulate matter > 1. Introduction
plain- Asserted: passes — The authors put it forward as true.
- Checkable: unclear — It is unclear whether it could be checked against evidence.
- Load-bearing: passes — The paper’s conclusions depend on it.
- Based: passes — The paper gives a reason why it holds.
It may state two separate claims as one.
What the paper did — it cites no source for this, so there is none to check. The quote shows it is in the paper.
In the paper
“Three biological replicates were used.”
§ Microplastics and nanoplastics science: collecting and characterizing airborne microplastics in fine particulate matter > 2.5.3. Cell viability assay
plain- Asserted: passes — The authors put it forward as true.
- Checkable: passes — It can be checked against evidence.
- Load-bearing: fails — The paper’s conclusions may not depend on it.
- Based: passes — The paper gives a reason why it holds.
Probably not a substantial claim. The paper’s conclusions may not depend on it.
In the paper
“A few studies have investigated exposure to MP from indoor and outdoor air but with substantial limitations (Abbasi et al. 2019;Bergmann et al. 2019;Cai et al. 2017;Dris et al. 2017;Klein and Fischer 2019;Liu et al. 2019).”
§ Microplastics and nanoplastics science: collecting and characterizing airborne microplastics in fine particulate matter > 1. Introduction
What the sources say
plain- Asserted: passes — The authors put it forward as true.
- Checkable: passes — It can be checked against evidence.
- Load-bearing: passes — The paper’s conclusions depend on it.
- Based: passes — The paper gives a reason why it holds.
It may state two separate claims as one.
In the paper
“Both FPA-FTIR and Raman spectroscopy methods can be used to determine MP composition, size and morphology, with detection limits of 10 mm (Joachim et al. 2015;Vianello et al. 2019) and ! 2 mm (Ballent et al. 2016;Enders et al. 2015;Fr ere et al. 2016;Zada et al. 2018), respectively.”
§ Microplastics and nanoplastics science: collecting and characterizing airborne microplastics in fine particulate matter > 1. Introduction
What the sources say
plainstates a cause- Asserted: passes — The authors put it forward as true.
- Checkable: passes — It can be checked against evidence.
- Load-bearing: unclear — It is unclear whether the paper’s conclusions depend on it.
- Based: passes — The paper gives a reason why it holds.
It may state two separate claims as one.
What the paper did — it cites no source for this, so there is none to check. The quote shows it is in the paper.
In the paper
“adequate procedural blanks (blank PM 2.5 samples) were analyzed to confirm that MP detected in environmental samples are not introduced during sample collection or analysis procedures.”
§ Microplastics and nanoplastics science: collecting and characterizing airborne microplastics in fine particulate matter > 2.4. Extraction of MP from air sampling filters
plain- Asserted: passes — The authors put it forward as true.
- Checkable: passes — It can be checked against evidence.
- Load-bearing: passes — The paper’s conclusions depend on it.
- Based: passes — The paper gives a reason why it holds.
Probably not a substantial claim.
What the paper did — it cites no source for this, so there is none to check. The quote shows it is in the paper.
In the paper
“The Raman system was auto-calibrated each day for system validation using a patented Raman objective (Standard PRO), prior to spectral acquisition.The calibration standard used was a NIST-certified PS material.”
§ Microplastics and nanoplastics science: collecting and characterizing airborne microplastics in fine particulate matter > 2.3.1. Reference materials and sample preparation
plain- Asserted: passes — The authors put it forward as true.
- Checkable: passes — It can be checked against evidence.
- Load-bearing: fails — The paper’s conclusions may not depend on it.
- Based: passes — The paper gives a reason why it holds.
Probably not a substantial claim. The paper’s conclusions may not depend on it.
None of the sources cited for this claim have been checked yet.
In the paper
“A wide variety of MP polymers are released into the environment, including primary MP manufactured intentionally for industrial and consumer applications (e.g.clothing, cosmetics, skin care products, pharmaceuticals) (Gregory 1996) and secondary MP resulting from the fragmentation or weathering of larger plastics due to photochemical, biological, chemical and mechanical processes (Gewert, Plassman”
§ Microplastics and nanoplastics science: collecting and characterizing airborne microplastics in fine particulate matter > 1. Introduction
What the sources say
plain- Asserted: passes — The authors put it forward as true.
- Checkable: passes — It can be checked against evidence.
- Load-bearing: fails — The paper’s conclusions may not depend on it.
- Based: passes — The paper gives a reason why it holds.
Probably not a substantial claim. The paper’s conclusions may not depend on it. It may state two separate claims as one.
What the paper did — it cites no source for this, so there is none to check. The quote shows it is in the paper.
In the paper
“A laminar flow hood was used during sample preparation”
§ Microplastics and nanoplastics science: collecting and characterizing airborne microplastics in fine particulate matter > 2.4. Extraction of MP from air sampling filters
plain- Asserted: passes — The authors put it forward as true.
- Checkable: passes — It can be checked against evidence.
- Load-bearing: fails — The paper’s conclusions may not depend on it.
- Based: passes — The paper gives a reason why it holds.
Probably not a substantial claim. The paper’s conclusions may not depend on it.
The paper states this without a source or data behind it here, so there is nothing to check it against. The quote shows it is in the paper.
In the paper
“Since MP can be contaminated with biological and organic matter in environmental samples, removal of this contamination is crucial as such particulates can impede MP identification.”
§ Microplastics and nanoplastics science: collecting and characterizing airborne microplastics in fine particulate matter > 2.4. Extraction of MP from air sampling filters
plainstates a cause- Asserted: passes — The authors put it forward as true.
- Checkable: passes — It can be checked against evidence.
- Load-bearing: passes — The paper’s conclusions depend on it.
- Based: fails — The paper may give no reason why it holds.
Probably not a substantial claim. The paper may give no reason why it holds. It may state two separate claims as one.
A conclusion the paper draws from its own results — it cites no other source for it, so there is none to check. The quote shows it is in the paper.
In the paper
“The results of the outdoor air sample analysis suggested that further processing may be required to separate Carbon Black and other contaminants from MP in air samples.”
§ Microplastics and nanoplastics science: collecting and characterizing airborne microplastics in fine particulate matter > 4. Discussion
hedgedstates a possible cause- Asserted: passes — The authors put it forward as true.
- Checkable: passes — It can be checked against evidence.
- Load-bearing: fails — The paper’s conclusions may not depend on it.
- Based: passes — The paper gives a reason why it holds.
Probably not a substantial claim. The paper’s conclusions may not depend on it.
A conclusion the paper draws from its own results — it cites no other source for it, so there is none to check. The quote shows it is in the paper.
In the paper
“However, general population exposures are expected to be much lower than those found around the occupational area.”
§ Microplastics and nanoplastics science: collecting and characterizing airborne microplastics in fine particulate matter > 4. Discussion
hedged- Asserted: passes — The authors put it forward as true.
- Checkable: passes — It can be checked against evidence.
- Load-bearing: fails — The paper’s conclusions may not depend on it.
- Based: fails — The paper may give no reason why it holds.
Probably not a substantial claim. The paper’s conclusions may not depend on it. The paper may give no reason why it holds.
- Rests on an assumption: General population exposures to MP are much lower than occupational exposures.
In the paper
“Silver membrane filters have been previously identified as suitable for MP research (Wright et al. 2020).”
§ Microplastics and nanoplastics science: collecting and characterizing airborne microplastics in fine particulate matter > 5. Conclusions
What the sources say
- Not checked yetcites Wright et al. 2020 source
plain- Asserted: passes — The authors put it forward as true.
- Checkable: passes — It can be checked against evidence.
- Load-bearing: passes — The paper’s conclusions depend on it.
- Based: passes — The paper gives a reason why it holds.
Probably not a substantial claim.
A conclusion the paper draws from its own results — it cites no other source for it, so there is none to check. The quote shows it is in the paper.
In the paper
“This was the first study to confirm the presence of respirable, airborne MP in indoor, personal, and outdoor samples, and to subsequently characterize the composition of MP ˂2.5 mm.”
§ Microplastics and nanoplastics science: collecting and characterizing airborne microplastics in fine particulate matter > 5. Conclusions
plain- Asserted: passes — The authors put it forward as true.
- Checkable: passes — It can be checked against evidence.
- Load-bearing: passes — The paper’s conclusions depend on it.
- Based: passes — The paper gives a reason why it holds.
It may state two separate claims as one.
A conclusion the paper draws from its own results — it cites no other source for it, so there is none to check. The quote shows it is in the paper.
In the paper
“Since it was not possible to quantify the MP extracted from air samples, it is premature to conclude on the potential or lack of toxicity of environmentally relevant MP.”
§ Microplastics and nanoplastics science: collecting and characterizing airborne microplastics in fine particulate matter > 4. Discussion
plain- Asserted: passes — The authors put it forward as true.
- Checkable: passes — It can be checked against evidence.
- Load-bearing: passes — The paper’s conclusions depend on it.
- Based: passes — The paper gives a reason why it holds.
Probably not a substantial claim. It may state two separate claims as one.
In the paper
“The types of MP found, i.e. nylon varieties have been associated with human respiratory diseases, including granulomatous lesions in lungs of workers exposed occupationally to nylon, polyester and acrylic fiber dusts (Pimentel, Avila, and Lourenco 1975); and chronic lung diseases including a rare lung interstitial disease (Flock worker's lung) is observed in nylon textile workers (Kern et al. 1998”
§ Microplastics and nanoplastics science: collecting and characterizing airborne microplastics in fine particulate matter > 4. Discussion
What the sources say
plainstates an association- Asserted: passes — The authors put it forward as true.
- Checkable: passes — It can be checked against evidence.
- Load-bearing: passes — The paper’s conclusions depend on it.
- Based: passes — The paper gives a reason why it holds.
It may state two separate claims as one.
A conclusion the paper draws from its own results — it cites no other source for it, so there is none to check. The quote shows it is in the paper.
In the paper
“This could be because of the colloidal instability of nano PS in the presence of larger particles in cells.”
§ Microplastics and nanoplastics science: collecting and characterizing airborne microplastics in fine particulate matter > 3.2.1. EDF-HSI detection of reference MP in cells post-exposure
hedgedstates a possible cause- Asserted: passes — The authors put it forward as true.
- Checkable: passes — It can be checked against evidence.
- Load-bearing: fails — The paper’s conclusions may not depend on it.
- Based: passes — The paper gives a reason why it holds.
Probably not a substantial claim. The paper’s conclusions may not depend on it.
A conclusion the paper draws from its own results — it cites no other source for it, so there is none to check. The quote shows it is in the paper.
In the paper
“As the Raman intensity is dependent on the particle size, the”
§ Microplastics and nanoplastics science: collecting and characterizing airborne microplastics in fine particulate matter > 3.4. Automating the detection of MP using particle finder
plainstates a cause- Asserted: passes — The authors put it forward as true.
- Checkable: passes — It can be checked against evidence.
- Load-bearing: fails — The paper’s conclusions may not depend on it.
- Based: passes — The paper gives a reason why it holds.
Probably not a substantial claim. The paper’s conclusions may not depend on it. The quote only partly states this claim.
- Rests on an assumption: Raman intensity is dependent on particle size.
What the paper did — it cites no source for this, so there is none to check. The quote shows it is in the paper.
In the paper
“Identification validation experiments were performed for clean filters deposited with PS spheres but not for real air samples.”
§ Microplastics and nanoplastics science: collecting and characterizing airborne microplastics in fine particulate matter > 4. Discussion
plain- Asserted: passes — The authors put it forward as true.
- Checkable: passes — It can be checked against evidence.
- Load-bearing: passes — The paper’s conclusions depend on it.
- Based: passes — The paper gives a reason why it holds.
It may state two separate claims as one.
A conclusion the paper draws from its own results — it cites no other source for it, so there is none to check. The quote shows it is in the paper.
In the paper
“Raman is suitable for detecting and characterizing MP in personal, indoor and outdoor air samples, while here we suggest EDF-HSI is most suitable for detecting MP in biological matrices.”
§ Microplastics and nanoplastics science: collecting and characterizing airborne microplastics in fine particulate matter > 4. Discussion
hedged- Asserted: passes — The authors put it forward as true.
- Checkable: passes — It can be checked against evidence.
- Load-bearing: passes — The paper’s conclusions depend on it.
- Based: passes — The paper gives a reason why it holds.
Probably not a substantial claim. It may state two separate claims as one.
A conclusion the paper draws from its own results — it cites no other source for it, so there is none to check. The quote shows it is in the paper.
In the paper
“The caveat of EDF-HSI is that it requires a priori knowledge of the MP being investigated.”
§ Microplastics and nanoplastics science: collecting and characterizing airborne microplastics in fine particulate matter > 3.5. Hyperspectral imaging for MP in air samples
plain- Asserted: passes — The authors put it forward as true.
- Checkable: passes — It can be checked against evidence.
- Load-bearing: fails — The paper’s conclusions may not depend on it.
- Based: passes — The paper gives a reason why it holds.
Probably not a substantial claim. The paper’s conclusions may not depend on it.
A conclusion the paper draws from its own results — it cites no other source for it, so there is none to check. The quote shows it is in the paper.
In the paper
“These samples contained significant levels of Carbon Black potentially from outdoor traffic and combustion-related sources or associated with MP as it is used as a dye or reinforcing material in plastics.”
§ Microplastics and nanoplastics science: collecting and characterizing airborne microplastics in fine particulate matter > 4. Discussion
hedgedstates an association- Asserted: passes — The authors put it forward as true.
- Checkable: passes — It can be checked against evidence.
- Load-bearing: unclear — It is unclear whether the paper’s conclusions depend on it.
- Based: passes — The paper gives a reason why it holds.
It may state two separate claims as one.
A conclusion the paper draws from its own results — it cites no other source for it, so there is none to check. The quote shows it is in the paper.
In the paper
“As the type of MP in air samples are diverse, and reference spectral libraries for plastic particles are not publicly available, this technique might not be suitable for the identification of new MP in air samples.”
§ Microplastics and nanoplastics science: collecting and characterizing airborne microplastics in fine particulate matter > 4. Discussion
hedgedstates a possible cause- Asserted: passes — The authors put it forward as true.
- Checkable: passes — It can be checked against evidence.
- Load-bearing: passes — The paper’s conclusions depend on it.
- Based: passes — The paper gives a reason why it holds.
It may state two separate claims as one.
A conclusion the paper draws from its own results — it cites no other source for it, so there is none to check. The quote shows it is in the paper.
In the paper
“Also, spectral libraries for the MP present in the air are not available, making it very difficult to apply EDF-HSI to real exposure scenarios.”
§ Microplastics and nanoplastics science: collecting and characterizing airborne microplastics in fine particulate matter > 4. Discussion
plainstates a cause- Asserted: passes — The authors put it forward as true.
- Checkable: passes — It can be checked against evidence.
- Load-bearing: passes — The paper’s conclusions depend on it.
- Based: passes — The paper gives a reason why it holds.
It may state two separate claims as one.
- Rests on an assumption: The MP signature is expected in the region 250-3250 cm-1.
In the paper
“However, with darkfield illumination using a 100x oil objective (NA ¼ 1.4) the spatial resolution can be increased up to 232 nm and much greater contrast can be achieved (Bodermann et al. 2003).”
§ Microplastics and nanoplastics science: collecting and characterizing airborne microplastics in fine particulate matter > 4. Discussion
What the sources say
- Not checked — no full text of the sourcecites Bodermann et al. 2003 source
plainstates a cause- Asserted: passes — The authors put it forward as true.
- Checkable: passes — It can be checked against evidence.
- Load-bearing: passes — The paper’s conclusions depend on it.
- Based: passes — The paper gives a reason why it holds.
It may state two separate claims as one.
In the paper
“The form or shape (particles, fiber) of MP, their size (macro, nano), chemical composition and the surface content (adsorbed chemicals & microbes) contribute to their toxicity (Toussaint et al. 2019).”
§ Microplastics and nanoplastics science: collecting and characterizing airborne microplastics in fine particulate matter > 4. Discussion
What the sources say
- Not checked yetcites Toussaint et al. 2019 source
plainstates a cause- Asserted: passes — The authors put it forward as true.
- Checkable: passes — It can be checked against evidence.
- Load-bearing: passes — The paper’s conclusions depend on it.
- Based: passes — The paper gives a reason why it holds.
It may state two separate claims as one.
A conclusion the paper draws from its own results — it cites no other source for it, so there is none to check. The quote shows it is in the paper.
In the paper
“Finally, the study, by identifying the specific types of MP in air samples, lays the foundation for future MP toxicological studies.”
§ Microplastics and nanoplastics science: collecting and characterizing airborne microplastics in fine particulate matter > 5. Conclusions
plainstates a cause- Asserted: passes — The authors put it forward as true.
- Checkable: fails — It may be too vague to check against evidence.
- Load-bearing: passes — The paper’s conclusions depend on it.
- Based: passes — The paper gives a reason why it holds.
Probably not a substantial claim. It may be too vague to check against evidence.
A conclusion the paper draws from its own results — it cites no other source for it, so there is none to check. The quote shows it is in the paper.
In the paper
“According to Rayleigh Criterion, using a 100x objective in the air (NA¼ 0.90) at 532 nm laser excitation the smallest diameter of a laser spot would be 791 nm and using a 50x objective in the air (NA¼ 0.55) at 532 nm the smallest diameter of a laser spot would be 1180 nm.”
§ Microplastics and nanoplastics science: collecting and characterizing airborne microplastics in fine particulate matter > 4. Discussion
hedgedstates a cause- Asserted: passes — The authors put it forward as true.
- Checkable: passes — It can be checked against evidence.
- Load-bearing: passes — The paper’s conclusions depend on it.
- Based: passes — The paper gives a reason why it holds.
It may state two separate claims as one.
In the paper
“The structures of nano arrays are governed by the ratio of molar volumes of the MPs and silver particles and the duration of interactions (Lv et al. 2020).”
§ Microplastics and nanoplastics science: collecting and characterizing airborne microplastics in fine particulate matter > 3.2. Extracting PS from the Teflon and silver membrane filters
What the sources say
- Not matchedcites Lv et al. 2020
Couldn’t be matched to a paper in Crossref, so it can’t be checked.
plainstates a cause- Asserted: passes — The authors put it forward as true.
- Checkable: passes — It can be checked against evidence.
- Load-bearing: fails — The paper’s conclusions may not depend on it.
- Based: passes — The paper gives a reason why it holds.
Probably not a substantial claim. The paper’s conclusions may not depend on it.
- Not matched
A conclusion the paper draws from its own results — it cites no other source for it, so there is none to check. The quote shows it is in the paper.
In the paper
“likely from sources unrelated to the MP.”
§ Microplastics and nanoplastics science: collecting and characterizing airborne microplastics in fine particulate matter > 3.3. Detection and characterization of MP from air samples
hedgedstates a possible cause- Asserted: passes — The authors put it forward as true.
- Checkable: passes — It can be checked against evidence.
- Load-bearing: fails — The paper’s conclusions may not depend on it.
- Based: fails — The paper may give no reason why it holds.
Probably not a substantial claim. The paper’s conclusions may not depend on it. The paper may give no reason why it holds.
A conclusion the paper draws from its own results — it cites no other source for it, so there is none to check. The quote shows it is in the paper.
In the paper
“Theoretically, it would not be possible to get a Raman signature of a single MP particle with a diameter smaller than 1 mm using the current setup.”
§ Microplastics and nanoplastics science: collecting and characterizing airborne microplastics in fine particulate matter > 4. Discussion
hedged- Asserted: unclear — It is unclear whether the authors put it forward as true.
- Checkable: passes — It can be checked against evidence.
- Load-bearing: unclear — It is unclear whether the paper’s conclusions depend on it.
- Based: unclear — It is unclear why the paper says it holds.
The quote only partly states this claim.
What the paper did — it cites no source for this, so there is none to check. The quote shows it is in the paper.
In the paper
“Owing to the issues related to sample collection, e.g.insufficient amount of filter extracted material, high levels of background chemical constituents with competing spectral signatures and time onerous protocols, the study was not able to conduct a comprehensive analysis of all potential MP present in air matrices and thus, the list of MP identified is not complete.”
§ Microplastics and nanoplastics science: collecting and characterizing airborne microplastics in fine particulate matter > 4. Discussion
plainstates a cause- Asserted: passes — The authors put it forward as true.
- Checkable: passes — It can be checked against evidence.
- Load-bearing: passes — The paper’s conclusions depend on it.
- Based: passes — The paper gives a reason why it holds.
It may state two separate claims as one.
A conclusion the paper draws from its own results — it cites no other source for it, so there is none to check. The quote shows it is in the paper.
In the paper
“Thus, the knowledge of the Physico-chemical properties of airborne, respirable MP is critical.”
§ Microplastics and nanoplastics science: collecting and characterizing airborne microplastics in fine particulate matter > 4. Discussion
plain- Asserted: passes — The authors put it forward as true.
- Checkable: fails — It may be too vague to check against evidence.
- Load-bearing: passes — The paper’s conclusions depend on it.
- Based: passes — The paper gives a reason why it holds.
Probably not a substantial claim. It may be too vague to check against evidence.
The paper relies on this without support.
Most people spend approximately 90% of their time indoors.
“As most people spend approximately 90% of their time indoors, data on both indoor and outdoor MP exposures will be required to understand their sources, pathways, fate, and distribution.”
The paper relies on this without support.
Commercially available reference MP does not represent what is present in the air.
“Since commercially available reference MP does not represent what is present in the air, in addition to reference materials, MP was prepared from UV weathering of the commonly used plastic materials.”
The paper relies on this without support.
MP and NP in environmental samples are expected to undergo weathering and/or may be complexed with other contaminants, which may result in lower HQI.
“However, MP and NP in environmental samples are expected to undergo weathering and/or may be complexed with other contaminants, which may result in lower HQI.”
The paper relies on this without support.
The HQI value for homogeneous and unweathered samples will always be high.
“The HQI value for homogeneous and unweathered samples will always be high.”
The paper relies on this without support.
MP is ubiquitous in the environment.
“MP is ubiquitous in the environment.”
The paper relies on this without support.
The toxicity of silver ions in cells and bacteria is well-known.
“However, MP collection on silver membrane filters for use in toxicological studies should be avoided due to the well-known toxicity of silver ions in cells and bacteria.”
The paper relies on this without support.
General population exposures to MP are much lower than occupational exposures.
“However, general population exposures are expected to be much lower than those found around the occupational area.”
The paper relies on this without support.
Raman intensity is dependent on particle size.
“As the Raman intensity is dependent on the particle size, the”
The paper relies on this without support.
Spectral libraries for MP present in air are not available.
“Also, spectral libraries for the MP present in the air are not available, making it very difficult to apply EDF-HSI to real exposure scenarios.”
The paper relies on this without support.
The MP signature is expected in the region 250-3250 cm-1.
“The silver membrane filter showed a band at $235 cm À1 (Supplementary Figure 1B top right panel) but no other significant peaks in the region of 250 cm À1 to 3250 cm À1 (the region in which MP signature is expected).”
The paper relies on this without support.
Teflon filters are routinely used in air pollution research and regulatory monitoring.
“Since Teflon filters are routinely used in air pollution research and regulatory monitoring, this optimized method will enable the ability for researchers to retrospectively investigate collected MP samples.”
Self-check
Percentages, sums and reported differences re-computed from the paper’s own numbers.
Each contradiction between two passages listed here was confirmed by an independent check.
Rated minor: it would not touch a result — a value no result rests on, a p-value that stays on the same side of the significance level, or a conflict that is clerical, resolved elsewhere in the paper, or outside its own findings.
In the paper
§ Microplastics and nanoplastics science: collecting and characterizing airborne microplastics in fine particulate matter > 4. Discussion
“The other outdoor and indoor samples collected on 47 mm Teflon filter were highly dominated by the presence of Carbon Black”
§ Microplastics and nanoplastics science: collecting and characterizing airborne microplastics in fine particulate matter > 2.2.2. Outdoor and indoor air sample collection
“In the same study, 7-day indoor and outdoor PM 2.5 samples were collected on 37 mm Teflon filters using Harvard cascade impactors (HSPH, Boston, MA) at 5 L/min.”
Citations
Cites
A tutorial on particle filters for online nonlinear/non-Gaussian Bayesian tracking
Arulampalam, M. S., Maskell, S. R., Gordon, N., & Clapp, T. C. (2002) · IEEE Transactions on Signal Processing · doi:10.1109/78.978374 · Cited by 11,531
Plasticenta: First evidence of microplastics in human placenta
Ragusa, A., Svelato, A., Santacroce, C., Catalano, P., Notarstefano, V., Carnevali, O., Papa, F., Rongioletti, M. C. A., Baiocco, F., Draghi, S., et al. (2021) · Environment International · doi:10.1016/j.envint.2020.106274 · Cited by 3,474
Beiträge zur Theorie des Mikroskops und der mikroskopischen Wahrnehmung
Abbe, E. (1873) · Archiv für Mikroskopische Anatomie · doi:10.1007/bf02956173 · Cited by 2,841
Atmospheric transport and deposition of microplastics in a remote mountain catchment
Allen, S., Allen, D., Phoenix, V. R., Le Roux, G., Durántez Jiménez, P., Simonneau, A., Binet, S., & Galop, D. (2019) · Nature Geoscience · doi:10.1038/s41561-019-0335-5 · Cited by 2,319
Pathways for degradation of plastic polymers floating in the marine environment
Gewert, B., Plassmann, M. M., & MacLeod, M. (2015) · Environmental Science: Processes & Impacts · doi:10.1039/c5em00207a · Cited by 2,168
Microplastic contamination in an urban area: a case study in Greater Paris
Dris, R., Gasperi, J., Rocher, V., Saad, M., Renault, N., & Tassin, B. (2015) · Environmental Chemistry · doi:10.1071/en14167 · Cited by 1,764
A first overview of textile fibers, including microplastics, in indoor and outdoor environments
Dris, R., Gaspéri, J., Mirande-Bret, C., Mandin, C., Guerrouache, M., Langlois, V., & Tassin, B. (2016) · Environmental Pollution · doi:10.1016/j.envpol.2016.12.013 · Cited by 1,635
Jung, M. R., Horgen, F. D., Orski, S. V., Rodriguez C., V., Beers, K. L., Balazs, G. H., Jones, T. T., Work, T. M., Brignac, K. C., Royer, S.-J., et al. (2018) · Marine Pollution Bulletin · doi:10.1016/j.marpolbul.2017.12.061 · Cited by 1,466
White and wonderful? Microplastics prevail in snow from the Alps to the Arctic
Bergmann, M., Mützel, S., Primpke, S., Tekman, M. B., Trachsel, J., & Gerdts, G. (2019) · Science Advances · doi:10.1126/sciadv.aax1157 · Cited by 1,359
Presence of airborne microplastics in human lung tissue
Amato-Lourenço, L. F., Carvalho-Oliveira, R., Júnior, G. R., dos Santos Galvão, L., Ando, R. A., & Mauad, T. (2021) · Journal of Hazardous Materials · doi:10.1016/j.jhazmat.2021.126124 · Cited by 1,329
Atmospheric microplastic deposition in an urban environment and an evaluation of transport
Wright, S. L., Ulke, J., Font, A., Chan, K. L. A., & Kelly, F. J. (2020) · Environment International · doi:10.1016/j.envint.2019.105411 · Cited by 1,222
Analysis of environmental microplastics by vibrational microspectroscopy: FTIR, Raman or both?
Kaeppler, A., Fischer, D., Oberbeckmann, S., Schernewski, G., Labrenz, M., Eichhorn, K., & Voit, B. I. (2016) · Analytical and Bioanalytical Chemistry · doi:10.1007/s00216-016-9956-3 · Cited by 1,112
Identification of microplastics using Raman spectroscopy: Latest developments and future prospects
Araujo, C. F., Nolasco, M. M., Ribeiro, A. M. P., & Ribeiro-Claro, P. J. A. (2018) · Water Research · doi:10.1016/j.watres.2018.05.060 · Cited by 1,059
Hurley, R. R., Lusher, A. L., Olsen, M., & Nizzetto, L. (2018) · Environmental Science & Technology · doi:10.1021/acs.est.8b01517 · Cited by 992
Cai, L., Wang, J., Peng, J., Tan, Z., Zhan, Z., Tan, X., & Chen, Q. (2017) · Environmental Science and Pollution Research · doi:10.1007/s11356-017-0116-x · Cited by 902
Microplastic abundance in atmospheric deposition within the Metropolitan area of Hamburg, Germany
Klein, M., & Fischer, E. K. (2019) · The Science of The Total Environment · doi:10.1016/j.scitotenv.2019.05.405 · Cited by 880
Gallo, F., Fossi, M. C., Weber, R., Santillo, D. J., Sousa, J., Ingram, I., Nadal, Á., & Romano, D. (2018) · Environmental Sciences Europe · doi:10.1186/s12302-018-0139-z · Cited by 877
Simon, M., van Alst, N., & Vollertsen, J. (2018) · Water Research · doi:10.1016/j.watres.2018.05.019 · Cited by 874
Lenz, R., Enders, K., Stedmon, C. A., Mackenzie, D. M. A., & Nielsen, T. G. (2015) · Marine Pollution Bulletin · doi:10.1016/j.marpolbul.2015.09.026 · Cited by 843
Enders, K., Lenz, R., Stedmon, C. A., & Nielsen, T. G. (2015) · Marine Pollution Bulletin · doi:10.1016/j.marpolbul.2015.09.027 · Cited by 775
Abbasi, S., Keshavarzi, B., Moore, F., Turner, A., Kelly, F. J., Dominguez, A. O., & Jaafarzadeh, N. (2019) · Environmental Pollution · doi:10.1016/j.envpol.2018.10.039 · Cited by 770
Simulating human exposure to indoor airborne microplastics using a Breathing Thermal Manikin
Vianello, A., Jensen, R. L., Liu, L., & Vollertsen, J. (2019) · Scientific Reports · doi:10.1038/s41598-019-45054-w · Cited by 766
Sources and sinks of microplastics in Canadian Lake Ontario nearshore, tributary and beach sediments
Ballent, A., Corcoran, P. L., Madden, O., Helm, P. A., & Longstaffe, F. J. (2016) · Marine Pollution Bulletin · doi:10.1016/j.marpolbul.2016.06.037 · Cited by 700
Fischer, M., & Scholz‐Böttcher, B. M. (2017) · Environmental Science & Technology · doi:10.1021/acs.est.6b06362 · Cited by 690
The fate of microplastics in an Italian Wastewater Treatment Plant
Magni, S., Binelli, A., Pittura, L., Avio, C. G., Torre, C. D., Parenti, C. C., Gorbi, S., & Regoli, F. (2018) · The Science of The Total Environment · doi:10.1016/j.scitotenv.2018.10.269 · Cited by 655
Review of micro- and nanoplastic contamination in the food chain
Toussaint, B., Raffael, B., Angers-Loustau, A., Gilliland, D., Kestens, V., Petrillo, M., Rio-Echevarria, I. M., & Van den Eede, G. (2019) · Food Additives & Contaminants: Part A · doi:10.1080/19440049.2019.1583381 · Cited by 643
Dümichen, E., Eisentraut, P., Bannick, C. G., Barthel, A.-K., Senz, R., & Braun, U. (2017) · Chemosphere · doi:10.1016/j.chemosphere.2017.02.010 · Cited by 641
Löder, M. G. J., Kuczera, M., Mintenig, S. M., Lorenz, C., & Gerdts, G. (2015) · Environmental Chemistry · doi:10.1071/en14205 · Cited by 605
Weinstein, J. E., Crocker, B. K., & Gray, A. D. (2016) · Environmental Toxicology and Chemistry · doi:10.1002/etc.3432 · Cited by 553 · cited 1×
“Microplastics (MP) are plastic polymer particles measuring less than five millimeters in length (Huppertsberg and Knepper 2018; Ivleva, Wiesheu, and Niessner 2017; Weinstein, Crocker, and Gray 2016).”
BackgroundLusher, A. L., Hernandez-Milian, G., O'Brien, J., Berrow, S., O'Connor, I., & Officer, R. (2015) · Environmental Pollution · doi:10.1016/j.envpol.2015.01.023 · Cited by 551
Liu, C., Jia, L., Zhang, Y., Wang, L., Deng, J., Gao, Y., Yu, L., Zhang, J., & Sun, H. (2019) · Environment International · doi:10.1016/j.envint.2019.04.024 · Cited by 537
Primpke, S., Lorenz, C., Rascher-Friesenhausen, R., & Gerdts, G. (2017) · Analytical Methods · doi:10.1039/c6ay02476a · Cited by 504
Dümichen, E., Barthel, A.-K., Braun, U., Bannick, C. G., Brand, K., Jekel, M. R., & Senz, R. (2015) · Water Research · doi:10.1016/j.watres.2015.09.002 · Cited by 485
Fournier, S. B., D’Errico, J. N., Adler, D. S., Kollontzi, S., Goedken, M. J., Fabris, L., Yurkow, E. J., & Stapleton, P. A. (2020) · Particle and Fibre Toxicology · doi:10.1186/s12989-020-00385-9 · Cited by 482 · cited 2×
“Recently, Enhanced Darkfield (EDF) nanoscale hyperspectral spectroscopic imaging (HSI) has shown promise for MP detection in complex matrices as it can detect MP in the range of ultrafine nanometer size fraction (Fournier et al. 2020).”
BackgroundMethodFrontiers in Environmental Science
Simha, P., Karlsson, C., Viskari, E.-L., Malila, R., & Vinnerås, B. (2021) · doi:10.3389/fenvs · Cited by 430
Plastic ‘scrubbers’ in hand cleansers: a further (and minor) source for marine pollution identified
Gregory, M. R. (1996) · Marine Pollution Bulletin · doi:10.1016/s0025-326x(96)00047-1 · Cited by 381
Lv, L., He, L., Jiang, S., Chen, J., Zhou, C., Qu, J., Lu, Y., Hong, P., Sun, S., & Li, C. (2020) · The Science of The Total Environment · doi:10.1016/j.scitotenv.2020.138449 · Cited by 379
Asensio, R. C., Moya, M. S. A., de la Roja, J. M. D. L. R., & Gómez, M. (2009) · Analytical and Bioanalytical Chemistry · doi:10.1007/s00216-009-3201-2 · Cited by 364
Mintenig, S. M., Bäuerlein, P. S., Koelmans, A. A., Dekker, S. C., & van Wezel, A. P. (2018) · Environmental Science Nano · doi:10.1039/c8en00186c · Cited by 348
Identification and visualisation of microplastics/nanoplastics by Raman imaging (i): Down to 100 nm
Sobhani, Z., Zhang, X., Gibson, C., Naidu, R., Megharaj, M., & Fang, C. (2020) · Water Research · doi:10.1016/j.watres.2020.115658 · Cited by 305
Goodman, K. E., Hare, J. T., Khamis, Z. I., Hua, T., & Sang, Q. A. (2021) · Chemical Research in Toxicology · doi:10.1021/acs.chemrestox.0c00486 · Cited by 304
Eisentraut, P., Dümichen, E., Ruhl, A. S., Jekel, M. R., Albrecht, M., Gehde, M., & Braun, U. (2018) · Environmental Science & Technology Letters · doi:10.1021/acs.estlett.8b00446 · Cited by 273
Instrumental analysis of microplastics—benefits and challenges
Huppertsberg, S., & Knepper, T. P. (2018) · Analytical and Bioanalytical Chemistry · doi:10.1007/s00216-018-1210-8 · Cited by 255
Identification and visualisation of microplastics by Raman mapping
Sobhani, Z., Al Amin, M., Naidu, R., Megharaj, M., & Fang, C. (2019) · Analytica Chimica Acta · doi:10.1016/j.aca.2019.05.021 · Cited by 232
Zhao, S.-Y., Danley, M., Ward, J., Li, D.-J., & Mincer, T. (2017) · Analytical Methods · doi:10.1039/c6ay02302a · Cited by 231
Haegerbaeumer, A., Mueller, M.-T., Fueser, H., & Traunspurger, W. (2019) · Frontiers in Environmental Science · doi:10.3389/fenvs.2019.00017 · Cited by 228
Group Frequency Assignments for Major Infrared Bands Observed in Common Synthetic Polymers
Noda, I., Dowrey, A. E., Haynes, J. L., & Marcott, C. A. (2007) · Springer eBooks · doi:10.1007/978-0-387-69002-5_22 · Cited by 203
Frère, L., Paul-Pont, I., Moreau, J., Soudant, P., Christophe Lambert, B., Huvet, A., & Rinnert, E. (2016) · Marine Pollution Bulletin · doi:10.1016/j.marpolbul.2016.10.051 · Cited by 200
Levermore, J. M., Smith, T. E. L., Kelly, F. J., & Wright, S. (2020) · Analytical Chemistry · doi:10.1021/acs.analchem.9b05445 · Cited by 194
Prata, J. C., Castro, J. L., da Costa, J. P., Duarte, A. C., Rocha‐Santos, T., & Cerqueira, M. (2020) · Marine Pollution Bulletin · doi:10.1016/j.marpolbul.2020.111522 · Cited by 188
Optimizing UV laser focus profiles for improved MALDI performance
Holle, A., Haase, A., Kayser, M., & Höhndorf, J. (2006) · Journal of Mass Spectrometry · doi:10.1002/jms.1041 · Cited by 173
Fast microplastics identification with stimulated Raman scattering microscopy
Zada, L., Leslie, H. A., Vethaak, A. D., Tinnevelt, G. H., Jansen, J. J., de Boer, J. F., & Ariese, F. (2018) · Journal of Raman Spectroscopy · doi:10.1002/jrs.5367 · Cited by 171
Wright, S. L., Levermore, J. M., & Kelly, F. J. (2019) · Environmental Science & Technology · doi:10.1021/acs.est.8b06663 · Cited by 153
Flock Worker's Lung: Chronic Interstitial Lung Disease in the Nylon Flocking Industry
Kern, D. G., Crausman, R. S., Durand, K. T. H., Nayer, A., & Kuhn III, C. (1998) · Annals of Internal Medicine · doi:10.7326/0003-4819-129-4-199808150-00001 · Cited by 150
Oßmann, B. E., Sarau, G., Schmitt, S. W., Holtmannspötter, H., Christiansen, S. H., & Dicke, W. (2017) · Analytical and Bioanalytical Chemistry · doi:10.1007/s00216-017-0358-y · Cited by 140
Kerr, L. T., Byrne, H. J., & Hennelly, B. M. (2015) · Analytical Methods · doi:10.1039/c5ay00327j · Cited by 137
Respiratory disease caused by synthetic fibres: a new occupational disease.
Pimentel, J. C., Avila, R., & Lourenco, A. G. (1975) · Thorax · doi:10.1136/thx.30.2.204 · Cited by 137
Stone, N., Prieto, M. C., Crow, P., Uff, J., & Ritchie, A. W. (2006) · Analytical and Bioanalytical Chemistry · doi:10.1007/s00216-006-0937-9 · Cited by 131
Raman spectral imaging of single living cancer cells: a preliminary study
Draux, F., Jeannesson, P., Beljebbar, A., Tfayli, A. M., Fourré, N., Manfait, M., Sulé‐Suso, J., & Sockalingum, G. D. (2008) · The Analyst · doi:10.1039/b812610k · Cited by 128
Fang, C., Sobhani, Z., Zhang, X., Gibson, C. T., Tang, Y., & Naidu, R. (2020) · Water Research · doi:10.1016/j.watres.2020.116046 · Cited by 114
Non‐invasive time‐course imaging of apoptotic cells by confocal Raman micro‐spectroscopy
Zoladek, A., Pascut, F. C., Patel, P. M., & Notingher, I. (2010) · Journal of Raman Spectroscopy · doi:10.1002/jrs.2707 · Cited by 107
Duemichen, E., Braun, U., Senz, R., Fabian, G., & Stürm, H. (2014) · Journal of Chromatography A · doi:10.1016/j.chroma.2014.05.057 · Cited by 103
Light microscopy: an ongoing contemporary revolution
Weisenburger, S., & Sandoghdar, V. (2015) · Contemporary Physics · doi:10.1080/00107514.2015.1026557 · Cited by 101
The substrate matters in the Raman spectroscopy analysis of cells
Mikoliunaite, L., Rodriguez, R. D., Sheremet, E., Kolchuzhin, V., Mehner, J., Ramanavicius, A., & Zahn, D. R. T. (2015) · Scientific Reports · doi:10.1038/srep13150 · Cited by 87
Raman imaging of floating cells
Creely, C. M., Volpe, G., Singh, G., Soler, M., & Petrov, D. V. (2005) · Optics Express · doi:10.1364/opex.13.006105 · Cited by 72
Decan, N., Wu, D., Williams, A., Bernatchez, S., Johnston, M., Hill, M., & Halappanavar, S. S. (2015) · Mutation Research/Genetic Toxicology and Environmental Mutagenesis · doi:10.1016/j.mrgentox.2015.11.011 · Cited by 64
Self-citationMechanisms for the modification of nylon 6,12 by gamma irradiation
Campos, C. M., Alvarez‐Castillo, A., Martínez‐Barrera, G., López-Valdivia, H., Carrasco, H., & Castaño, V. M. (2003) · International Journal of Materials and Product Technology · doi:10.1504/ijmpt.2003.003468 · Cited by 50
Shan, J., Zhang, Y., Wang, J., Ren, T., Jin, M., & Wang, X. (2020) · Journal of Hazardous Materials · doi:10.1016/j.jhazmat.2020.123202 · Cited by 46
Nethery, E., Mallach, G., Rainham, D. G. C., Goldberg, M. S., & Wheeler, A. J. (2014) · Environmental Health · doi:10.1186/1476-069x-13-33 · Cited by 41
Self-citationRaman spectroscopy of bladder tissue in the presence of 5-aminolevulinic acid
Grimbergen, M. C. M., van Swol, C. F. P., van Moorselaar, R. J. A., Uff, J., Mahadevan-Jansen, A. M., & Stone, N. (2009) · Journal of Photochemistry and Photobiology B Biology · doi:10.1016/j.jphotobiol.2009.03.002 · Cited by 39
Lim, H. S., Fraser, A., & Knights, A. M. (2020) · Environmental Research Letters · doi:10.1088/1748-9326/ab83ae · Cited by 36
Lovera, P., Creedon, N., Alatawi, H., Mitchell, M., Burke, M., Quinn, A. J., & O’Riordan, A. (2014) · Nanotechnology · doi:10.1088/0957-4484/25/17/175502 · Cited by 32
Calleja, G., Houdayer, A., Calas-Etienne, S., Bourgogne, D., Flaud, V., Silly, G., Shibahara, S., Takahara, A., Jourdan, A., Hamwi, A., et al. (2011) · Journal of Polymer Science Part A Polymer Chemistry · doi:10.1002/pola.24588 · Cited by 29
Mikroplastik in aquatischen Ökosystemen
Ivleva, N. P., Wiesheu, A. C., & Nießner, R. (2016) · Angewandte Chemie · doi:10.1002/ange.201606957 · Cited by 25
Boyadzhiev, A., Trevithick‐Sutton, C. C., Wu, D., Decan, N., Bazin, M., Shah, G. M., & Halappanavar, S. S. (2020) · Chemical Research in Toxicology · doi:10.1021/acs.chemrestox.0c00090 · Cited by 12
Self-citationNew methods for CD measurements on photomasks using dark field optical microscopy:
Bodermann, B., Michaelis, W., Diener, A., & Mirande, W. (2003) · SPIE Proceedings · doi:10.1117/12.514956 · Cited by 2
Research works printed but not linked: 2
- Chen Qiqing, 2021, MedRxiv
- Pauly John L., 1998, Cancer Epidemiology and Prevention Biomarkers, 7, 419
Cited by
Sorted by citations
Evaluation of Potential Toxicity of Polyethylene Microplastics on Human Derived Cell Lines
Gautam, R., Jo, J., Acharya, M., Maharjan, A., Lee, D., C, P. B. K., Kim, C., Kim, K., Kim, H., & Heo, Y. (2022) · The Science of The Total Environment · doi:10.1016/j.scitotenv.2022.156089 · Cited by 206
Luo, D., Chu, X., Wu, Y., Wang, Z., Liao, Z., Ji, X., Ju, J., Yang, B., Chen, Z., Dahlgren, R. A., et al. (2024) · Journal of Hazardous Materials · doi:10.1016/j.jhazmat.2023.133412 · Cited by 142
Zhu, Y., Che, R., Zong, X., Wang, J., Li, J., Zhang, C., & Wang, F. (2024) · Journal of Environmental Management · doi:10.1016/j.jenvman.2024.120039 · Cited by 128
Casella, C., Cornelli, U., Ballaz, S., Zanoni, G., Merlo, G., & Ramos, L. A. (2025) · Toxics · doi:10.3390/toxics13050387 · Cited by 69
Dewika, M., Markandan, K., Irfan, N. A., Abdah, M. A. A. M., Ruwaida, J. N., Sara, Y. Y., & Khalid, M. (2023) · Chemosphere · doi:10.1016/j.chemosphere.2023.138270 · Cited by 66
Metadata
- Authors
- Rahman, L., Mallach, G., Kulka, R., & Halappanavar, S.
- Affiliations
- Health Canada (CA)
- Corresponding author
- Mallach, Gary
- Halappanavar, Sabina
- ORCID
- Halappanavar, Sabina
- Venue
- Nanotoxicology
- Publisher
- Informa UK Limited
- Published
- 2021-10-21
- Volume
- 15
- Issue
- 9
- Pages
- 1253-1278
- ISSN
- 1743-5390 (ISSN-L)
- 1743-5404
- OpenAlex
- W4206493315
- Semantic Scholar
- 0325e858b094610782e28cd99005753f4247865e
- Cited by
- 79
- References
- 75
- Citations by year
- 2026: 18 · 2025: 14 · 2024: 24 · 2023: 16 · 2022: 5
- FWCI
- 2.80
- Type
- journal article
- Language
- en
- Open access
- hybrid
- doi.org
- Licence
- Locations
- Nanotoxicology (publishedVersion, cc-by-nc-nd)
- PubMed (publishedVersion)
- Funders
- Health Canada
- Topics
- Physical Sciences › Environmental Science › Pollution › Microplastics and Plastic Pollution
- Physical Sciences › Environmental Science › Health, Toxicology and Mutagenesis › Air Quality and Health Impacts
- Physical Sciences › Environmental Science › Pollution › Pharmaceutical and Antibiotic Environmental Impacts
- Keywords
- airborne microplastics, nanoplastics, PM2.5, respirable particles, filter type, Raman spectroscopy, microplastic characterization, indoor air, cell exposure
- MeSH terms
- Microplastics, Environmental Monitoring, Humans, Plastics, Particulate Matter
About these checks
Registry, retraction, Cites and statistics results are computed, not judged, with one exception: a printed reference that no index lists is read once by a model before it counts as a citation error. Claims are extracted by a model and kept only when their quote appears verbatim in the text; each cited source is then checked, with a model’s help, for whether it says what the claim relies on. Those verdicts can be wrong — read the claim’s quote and the cited source before relying on one.
A language model drew the claims from the paper on 2026-11-12, under version 3 of the claim definition (model deepseek-v4.1-flash, prompt extract-v3).
A second model labelled each claim on 2026-11-12 (model jev-1.13-20260917, definition revision gold-guideline-v0.2).
Statistics and arithmetic are recomputed, not judged.
Confidence bands are shown only for fields calibrated on our annotated test set. None is calibrated yet, so no band is shown.
What counts as a claim ›How we measure confidence ›How we check this ›
Are you an author, or do you see a problem with this page? Request a review
