

The DOI matches its Crossref record; 57 of the 57 references it cites were found in a registry or an index.
T cell lipid peroxidation induces ferroptosis and prevents immunity to infection
Open accessAbstract
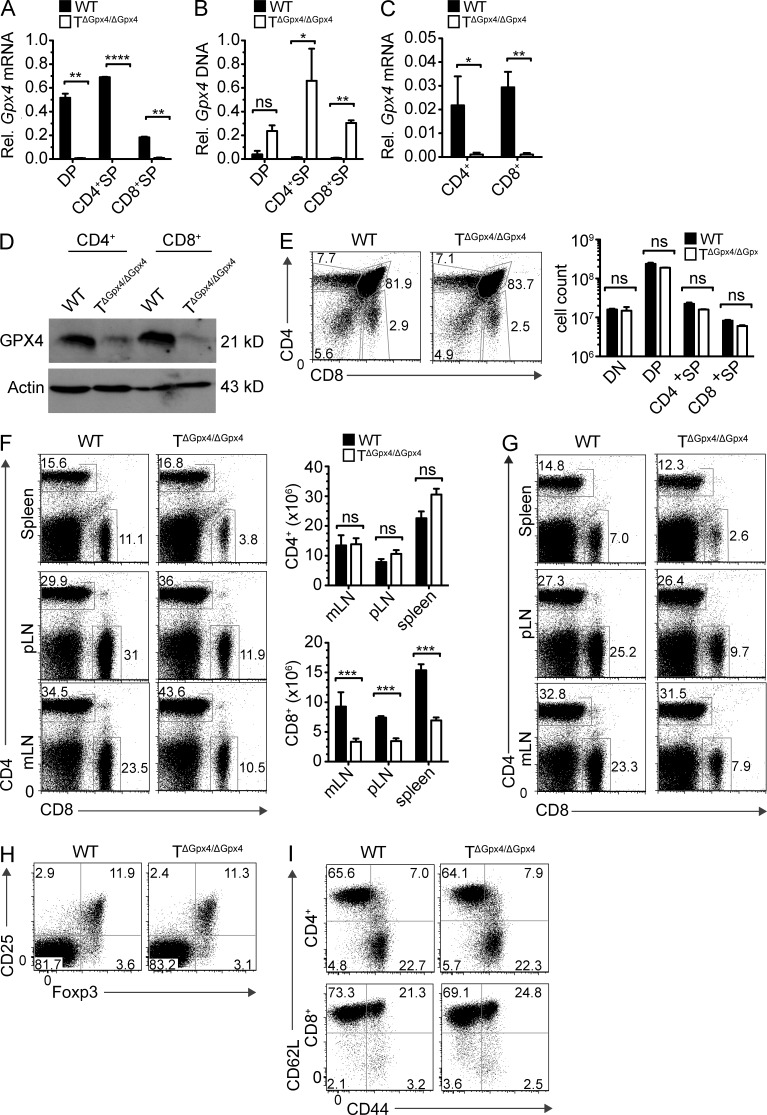
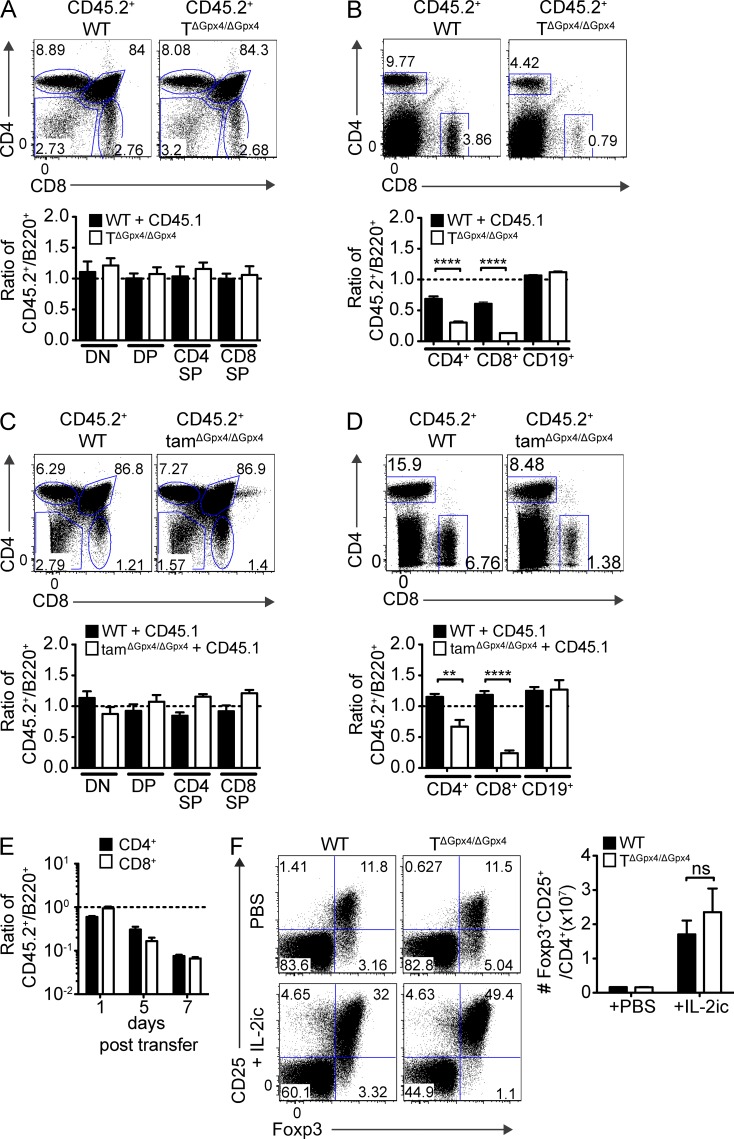
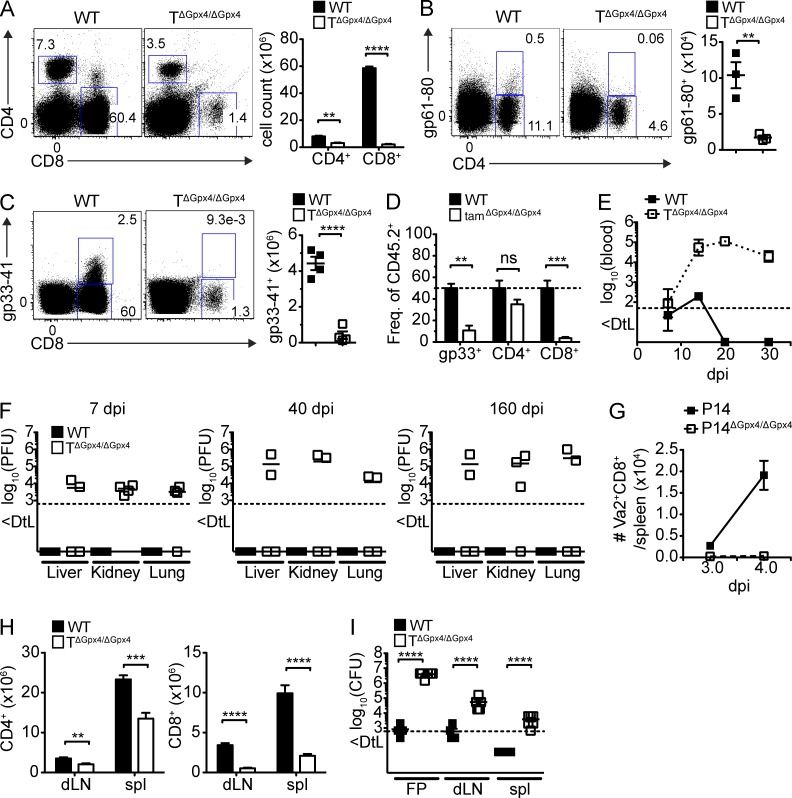
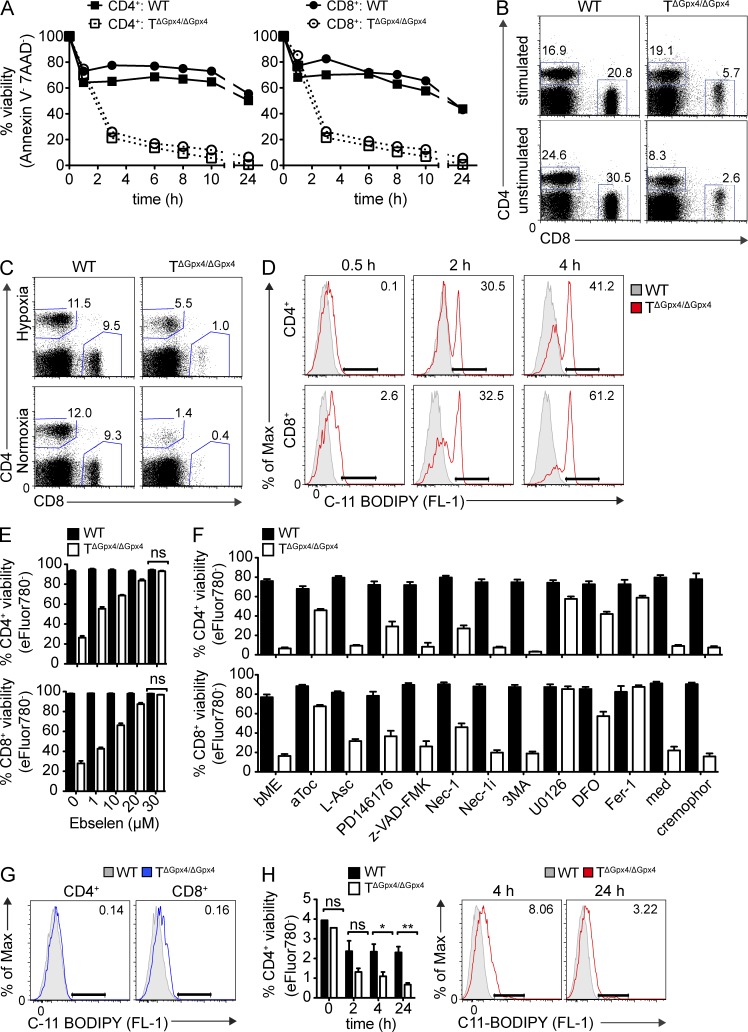
The selenoenzyme glutathione peroxidase 4 (Gpx4) is a major scavenger of phospholipid hydroperoxides. Although Gpx4 represents a key component of the reactive oxygen species-scavenging network, its relevance in the immune system is yet to be defined. Here, we investigated the importance of Gpx4 for physiological T cell responses by using T cell–specific Gpx4-deficient mice. Our results revealed that, despite normal thymic T cell development, CD8+ T cells from TΔGpx4/ΔGpx4 mice had an intrinsic defect in maintaining homeostatic balance in the periphery. Moreover, both antigen-specific CD8+ and CD4+ T cells lacking Gpx4 failed to expand and to protect from acute lymphocytic choriomeningitis virus and Leishmania major parasite infections, which were rescued with diet supplementation of high dosage of vitamin E. Notably, depletion of the Gpx4 gene in the memory phase of viral infection did not affect T cell recall responses upon secondary infection. Ex vivo, Gpx4-deficient T cells rapidly accumulated membrane lipid peroxides and concomitantly underwent cell death driven by ferroptosis but not necroptosis. These studies unveil an essential role of Gpx4 for T cell immunity.
Overview
The claims and statistics of this paper haven’t been checked yet.
Run the check — free, no account needed. It reads the open-access text and checks the sources it cites.
Integrity signals
Registry
Cites
Statistics
Figures
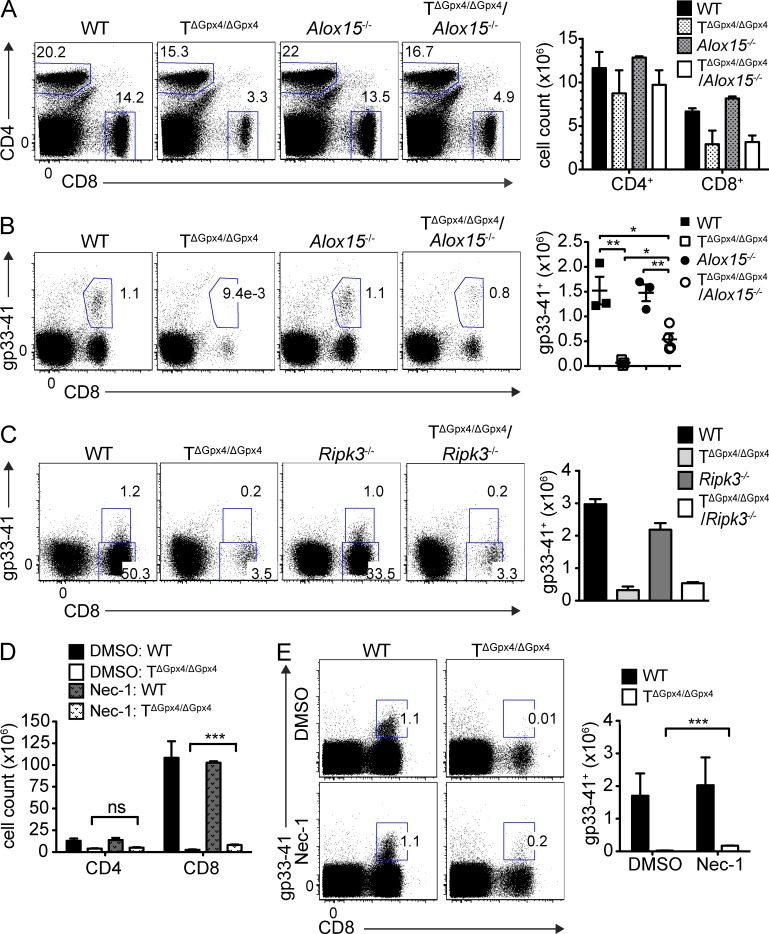
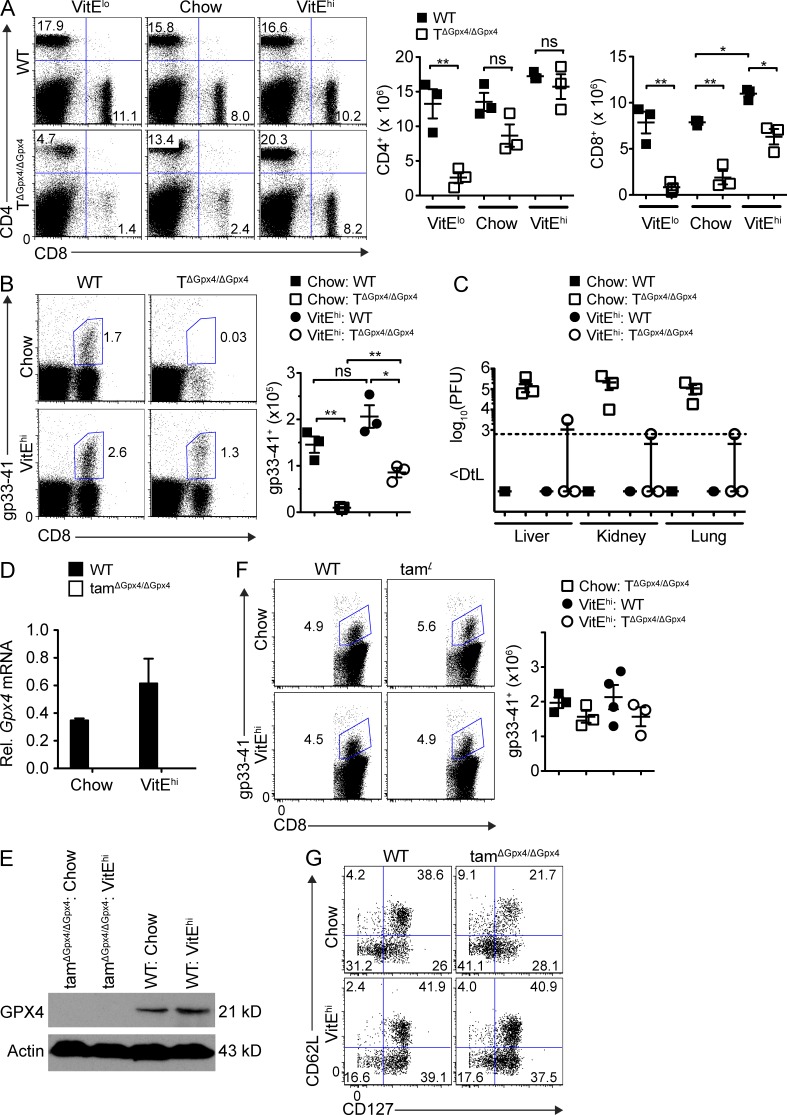
Verification
Claims the paper makes
The claims and statistics of this paper haven’t been checked yet.
Run the check — free, no account needed. It reads the open-access text and checks the sources it cites.
Claims other papers make about this one
Each is checked against this paper’s own text: does it say what the citing paper says it does?
In the citing paper
“the inducible or tissue-specific ablation of Gpx4 in mice provokes a variety of pathological conditions, including acute renal or hepatic injury [547, 563, 589], neurodegeneration [550, 590, 591], and defective immunity to infection [567], all of which can be prevented or mitigated by ferroptosis-inhibiting strategies.”
From Molecular mechanisms of cell death: recommendations of the nomenclature committee on cell death 2018. (2018) · cites this paper as [567]
In the citing paper
“GPX4 is essential for the survival and expansion of recently activated T cells, indicating the importance of preventing lipid peroxidation and of iron dysregulation resulting in ferroptosis, in T cell proliferation (Matsushita et al., 2015).”
From The Role of Iron Regulation in Immunometabolism and Immune-Related Disease (2019) · cites this paper as Matsushita et al., 2015
In the citing paper
“GPX4 is essential for the survival and expansion of recently activated T cells, indicating the importance of preventing lipid peroxidation and of iron dysregulation resulting in ferroptosis, in T cell proliferation (Matsushita et al., 2015).”
From The Role of Iron Regulation in Immunometabolism and Immune-Related Disease (2019) · cites this paper as Matsushita et al., 2015
In the citing paper
“Gpx4 exerts important effects on the immune system as it is crucial for the survival of CD8+ T cells and for the expansion of both CD4+ and CD8+ T cells upon T cell receptor triggering in response to infection by preventing membrane lipid peroxidation and ferroptosis”
From Iron in immune cell function and host defense (2021) · cites this paper as [112]
In the citing paper
“and high levels of reactive oxygen species in T cells impair cytotoxicity, perhaps mediated by T cell lipid peroxidation, resulting in failure to control viruses (Henson et al. 2014; Matsushita et al. 2015).”
From Is immunosenescence influenced by our lifetime “dose” of exercise? (2016) · cites this paper as Matsushita et al. 2015
Self-check
Percentages, sums and reported differences re-computed from the paper’s own numbers.
The self-check needs the paper’s full text.
Citations
Cites
Ferroptosis: An Iron-Dependent Form of Nonapoptotic Cell Death
Dixon, S. J., Lemberg, K. M., Lamprecht, M. R., Skouta, R., Zaitsev, E. M., Gleason, C. E., Patel, D. N., Bauer, A. J., Cantley, A. M., Yang, W. S., et al. (2012) · Cell · doi:10.1016/j.cell.2012.03.042 · Cited by 18,691 · cited 1×
“Cystine in the extracellular space is transported exclusively by the xc and converted to cysteine, which facilitates the synthesis of intracellular glutathione (GSH), a major cellular antioxidant (Fahey and Sundquist, 1991).”
BackgroundBiochemistry and molecular cell biology of diabetic complications
Brownlee, M. (2001) · Nature · doi:10.1038/414813a · Cited by 9,107
Regulation of Ferroptotic Cancer Cell Death by GPX4
Yang, W. S., SriRamaratnam, R., Welsch, M. E., Shimada, K., Skouta, R., Viswanathan, V. S., Cheah, J. H., Clemons, P. A., Shamji, A. F., Clish, C. B., et al. (2014) · Cell · doi:10.1016/j.cell.2013.12.010 · Cited by 7,713 · cited 1×
“The central importance for cellular physiology and normal development of the cytosolic form is highlighted by the embryonic lethality observed in mice with a homozygous Gpx4 deletion (Yant et al., 2003).”
BackgroundMitochondrial Dysfunction and Oxidative Stress in Neurodegenerative Diseases
Lin, M. T., & Beal, M. F. (2006) · Nature · doi:10.1038/nature05292 · Cited by 6,455
Death Receptors: Signaling and Modulation
Ashkenazi, A., & Dixit, V. M. (1998) · Science · doi:10.1126/science.281.5381.1305 · Cited by 5,866 · cited 1×
“After immune responses to infections, T cell populations are controlled and maintained by programmed cell death, one of which is initiated by the death receptor ligation, involving Fas-associated death domain protein (FADD) and caspase 8 (Ashkenazi and Dixit, 1998).”
BackgroundReactive oxygen species (ROS) homeostasis and redox regulation in cellular signaling
Ray, P. D., Huang, B.-W., & Tsuji, Y. (2012) · Cellular Signalling · doi:10.1016/j.cellsig.2012.01.008 · Cited by 4,373 · cited 1×
“Concurrently, it is well appreciated that ROS are at the interface of several cell signaling pathways that regulate cell proliferation, differentiation, and death (D’Autréaux and Toledano, 2007; Finkel, 2011; Ray et al., 2012).”
BackgroundROS as signalling molecules: Mechanisms that generate specificity in ROS homeostasis
D'Autréaux, B., & Toledano, M. B. (2007) · Nature Reviews Molecular Cell Biology · doi:10.1038/nrm2256 · Cited by 3,642 · cited 1×
“Although apoptosis has long been considered the primary form of programmed cell death, recent studies have identified that necroptosis can also occur by inactivation of caspase 8 and complex formation of RIP kinase 1 and 3 (Cho et al., 2009; Declercq et al., 2009).”
BackgroundChemical inhibitor of nonapoptotic cell death with therapeutic potential for ischemic brain injury
Degterev, A., Huang, Z., Boyce, M., Li, Y., Jagtap, P., Mizushima, N., Cuny, G. D., Mitchison, T. J., Moskowitz, M. A., & Yuan, J. (2005) · Nature Chemical Biology · doi:10.1038/nchembio711 · Cited by 3,068 · cited 1×
“ERK1/2 phosphorylation upon TCR triggering depends on the generation of hydrogen peroxide and stimulates glutamine uptake (Devadas et al., 2002; Carr et al., 2010).”
BackgroundReconciling the chemistry and biology of reactive oxygen species
Winterbourn, C. C. (2008) · Nature Chemical Biology · doi:10.1038/nchembio.85 · Cited by 2,504 · cited 2×
“Indeed, RAS–RAF–MEK signaling has been shown to be required for erastin-induced ferroptosis of tumor cells (Yagoda et al., 2007).”
BackgroundCho, Y., Challa, S., Moquin, D., Genga, R., Ray, T. D., Guildford, M., & Chan, F. K.-M. (2009) · Cell · doi:10.1016/j.cell.2009.05.037 · Cited by 2,435 · cited 1×
“Although apoptosis has long been considered the primary form of programmed cell death, recent studies have identified that necroptosis can also occur by inactivation of caspase 8 and complex formation of RIP kinase 1 and 3 (Cho et al., 2009; Declercq et al., 2009).”
Background
Cited by
Sorted by citations
Items 301–400 of 677
The Potential Role of Ferroptosis in Systemic Lupus Erythematosus
Chen, Q., Wang, J., Xiang, M., Wang, Y., Zhang, Z., Liang, J. F., & Xu, J. (2022) · Frontiers in Immunology · doi:10.3389/fimmu.2022.855622 · Cited by 38
“Besides, both CD4 and CD8 T cells that lack GPX4 would rapidly accumulate membrane lipid ROS, and undergo ferroptosis, leading to their inability to expand and protect against viral and parasite infections (44).”
BackgroundHu, Z., Zhang, H., Liu, W., Yin, Y., Jiang, J., Yan, C., Wang, Y., & Li, L. (2022) · Translational Cancer Research · doi:10.21037/tcr-22-96 · Cited by 38
“For example, lipid peroxidation-induced T-cell death promotes viral or parasitic infection (39).”
BackgroundMolecular Mechanisms of Ferroptosis and Updates of Ferroptosis Studies in Cancers and Leukemia
Akiyama, H., Carter, B. Z., Andreeff, M., & Ishizawa, J. (2023) · Cells · doi:10.3390/cells12081128 · Cited by 38
“However, in later studies, the knockout of ALOX15 failed to rescue GPX4 inhibition–induced ferroptosis in different cell models [86,87], indicating alternative pathways of lipid peroxidation.”
Ferroptosis: Biology and Role in Gastrointestinal Disease
Escuder‐Rodríguez, J.-J., Liang, D., Jiang, X., & Sinicrope, F. A. (2024) · Gastroenterology · doi:10.1053/j.gastro.2024.01.051 · Cited by 41
NFE2L2 and ferroptosis resistance in cancer therapy
Tang, D., & Kang, R. (2024) · Cancer Drug Resistance · doi:10.20517/cdr.2024.123 · Cited by 41
Ferroptosis in Cancer and Inflammatory Diseases: Mechanisms and Therapeutic Implications
Shen, G., Liu, J., Wang, Y., Deng, Z., & Deng, F. (2025) · MedComm · doi:10.1002/mco2.70349 · Cited by 47
Li, W., Zhou, X., Xu, S., Cao, N., Li, B., Chen, W., Yang, B., Yuan, M., & Xu, D. (2022) · Poultry Science · doi:10.1016/j.psj.2022.101725 · Cited by 37
“It has been shown that T cell death induced by GPX4 deficiency is caused by a lipid peroxide-mediated pathway involving ferroptosis (Matsushita et al., 2015).”
BackgroundYong, Y.-Y., Yan, L., Wang, B.-D., Fan, D., Guo, M., Yu, L., Wu, J., Qin, D., Law, B. Y. K., Wong, V. K.-W., et al. (2024) · Phytomedicine · doi:10.1016/j.phymed.2024.155463 · Cited by 37
Unlocking ferroptosis in prostate cancer — the road to novel therapies and imaging markers
Cao, P. H. A., Dominic, A., Lujan, F. E., Senthilkumar, S., Bhattacharya, P. K., Frigo, D. E., & Subramani, E. (2024) · Nature Reviews Urology · doi:10.1038/s41585-024-00869-9 · Cited by 43
“Nonetheless, caution should be exerted with the use of ferroptosis inducers, as results from previous studies showed that T cells are also susceptible to ferroptosis 202 .”
Mechanism and role of regulated cell death in tumor immunity and immunotherapy
Hu, J., Li, Y., Lian, B., Mao, Y., & Zhao, L. (2025) · 癌症:英文版 · doi:10.1002/cac2.70064 · Cited by 40
“Complementarily reduced GPX4 activity generates pro-inflammatory lipids, specifically 5-hydroxyeicosatetraenoic acid (5-HETE) and leukotriene B4 (LTB4), which drive ferroptosis-associated T cell responses [56, 57].”
Iuchi, K., Nishimaki, K., Kamimura, N., & Ohta, S. (2019) · Canadian Journal of Physiology and Pharmacology · doi:10.1139/cjpp-2018-0741 · Cited by 36
“Moreover, ferroptosis occurs in Gpx4-deficient T cells (Matsushita et al. 2015).”
BackgroundFerroptosis Is a Potential Novel Diagnostic and Therapeutic Target for Patients With Cardiomyopathy
Zhai, Z., Zou, P., Liu, F., Xia, Z., & Li, J. (2021) · Frontiers in Cell and Developmental Biology · doi:10.3389/fcell.2021.649045 · Cited by 38
Emerging roles of ferroptosis in infectious diseases
Bagayoko, S., & Meunier, É. (2021) · FEBS Journal · doi:10.1111/febs.16244 · Cited by 36
Naidu, S. A. G., Clemens, R., & Naidu, A. S. (2022) · Journal of Dietary Supplements · doi:10.1080/19390211.2022.2075072 · Cited by 40
“kocyte subsets and compromise the immune function (99).”
BackgroundZhang, H., Li, S., Liu, S. M., Liao, Y., Liu, H., Yang, M., & Chen, P. (2025) · Molecular Cancer · doi:10.1186/s12943-025-02491-8 · Cited by 44
Sakai, O., Yasuzawa, T., Yoshie, S., Ueta, T., Imai, H., Sawabe, A., & Ueshima, S. (2016) · Pathophysiology · doi:10.1016/j.pathophys.2016.11.002 · Cited by 35
The relevance of selenium to viral disease with special reference to SARS-CoV-2 and COVID-19
Rayman, M. P., Taylor, E. W., & Zhang, J. (2022) · Proceedings of The Nutrition Society · doi:10.1017/s0029665122002646 · Cited by 34
“SARS-CoV-2 suppresses GPX4 gene expression; GPX4 is vital in the survival and expansion of recently activated T-cells by prevention of lipid peroxidation and ferroptotic cell death((72)).”
BackgroundFerroptosis: A mixed blessing for infectious diseases
Xiao, L.-Y., Huang, H., Fan, S., Zheng, B., Wu, J., Zhang, J., Pi, J., & Xu, J.-F. (2022) · Frontiers in Pharmacology · doi:10.3389/fphar.2022.992734 · Cited by 37
“Infection of GPX4-deficient mice with Leishmania could lead to a reduction in the number of CD4 T cells, which contributes to the maintenance of Leishmania in vivo (Matsushita et al., 2015).”
BackgroundNanomedicine targeting ferroptosis to overcome anticancer therapeutic resistance
Cai, J., Xu, X., & Saw, P. E. (2023) · Science China Life Sciences · doi:10.1007/s11427-022-2340-4 · Cited by 34
“For example, the ferroptosis inducers might inhibit abundant of CD8 + T cells in inflamed tumors and cripple the antigen-presenting cells (APCs), leading to the low immunotherapy efficacy of immune checkpoint inhibitors (ICIs) (Matsushita et al., 2015).”
Ferroptosis of T cell in inflammation and tumour immunity
Xia, X., Wu, H., Chen, Y., Peng, H., & Wang, S. (2025) · Clinical and Translational Medicine · doi:10.1002/ctm2.70253 · Cited by 34
“22 Additionally, GPX4 absence impairs the viability of proliferating T cells under non-inflammatory conditions.”
InfluentialLiu, R., Wang, J., Liu, Y., Gao, Y., & Yang, R. (2024) · Cancer Letters · doi:10.1016/j.canlet.2024.217115 · Cited by 33
Cheng, K., Guo, Q., Shen, Z., Yang, W., Zhou, Y., Sun, Z., Yao, X., & Wu, H. (2022) · Frontiers in Oncology · doi:10.3389/fonc.2022.948389 · Cited by 33
“Meanwhile, ferroptosis can expose tumor antigens and improve the immunogenicity of tumor microenvironment and thereby promoting T-cell activation and facilitating antitumor T-cell immune response (87, 88).”
BackgroundPhysiological Effects of Ferroptosis on Organ Fibrosis
Du, X., Dong, R., Wu, Y., & Ni, B. (2022) · Oxidative Medicine and Cellular Longevity · doi:10.1155/2022/5295434 · Cited by 33
“Knockout of ALOX15 does not rescue ferropto-sis and its serious pathological consequences caused by GPX4 deletion [35 – 37].”
Ferroptosis in immune cells: Implications for tumor immunity and cancer therapy
Gao, J., Zhang, X., Liu, Y., & Gu, X. (2025) · Cytokine & Growth Factor Reviews · doi:10.1016/j.cytogfr.2025.06.007 · Cited by 34
Immune cells dying from ferroptosis: mechanisms and therapeutic opportunities
Liu, J., Dong, R., Yuan, B., Xie, Y., Feng, Z., Zhou, S., Luan, F., & Chen, Y. (2025) · Cell Death and Disease · doi:10.1038/s41419-025-08204-9 · Cited by 32
“Altretamine for advanced ovarian cancer has been shown to inhibit GPX4 activity and induce intracellular lipid peroxide accumulation [110].”
Nrf2 Suppresses Allergic Lung Inflammation by Attenuating the Type 2 Innate Lymphoid Cell Response
Nagashima, R., Kosai, H., Masuo, M., Izumiyama, K., Noshikawaji, T., Morimoto, M., Kumaki, S., Miyazaki, Y., Motohashi, H., Yamamoto, M. P., et al. (2019) · The Journal of Immunology · doi:10.4049/jimmunol.1801180 · Cited by 32
“We suspected that ferroptosis, an iron-dependent nonapoptotic cell death caused by cellular lipid peroxide accumulation (27, 28), was involved in the ILC2 cell death because a number of antiferroptotic genes are among Nrf2’s target genes (13, 29).”
BackgroundT Cell Metabolism in Cancer Immunotherapy
Aksoylar, H., Tijaro-Ovalle, N. M., Boussiotis, V. A., & Patsoukis, N. (2020) · Immunometabolism · doi:10.20900/immunometab20200020 · Cited by 31
“Ferroptosis can be induced in T cells by deficiency in the detoxifying enzyme glutathione peroxidase resulting in membrane accumulation of lipid peroxides and cell death [98].”
BackgroundImmunogenetic Metabolomics Reveals Key Enzymes That Modulate CAR T-cell Metabolism and Function
Renauer, P. A., Park, J. J.-Y., Bai, M., Acosta, A., Lee, W., Lin, G. H., Zhang, Y., Dai, X., Wang, G., Errami, Y., et al. (2023) · Cancer Immunology Research · doi:10.1158/2326-6066.cir-22-0565 · Cited by 32
Ferroptosis in cardiovascular diseases: role and mechanism
Zhang, Q., Luo, Y., Peng, L., Rong, X., Liu, Y., Li, J., & Luo, J. (2023) · Cell & Bioscience · doi:10.1186/s13578-023-01169-2 · Cited by 33
“Vitamin E supplementation is a treatment option for GPX4 insufficiency because it prevents CD4 + or CD8 + T cells from expanding in the event of an acute infection [95].”
BackgroundZhu, W., Liu, X., Yang, L., He, Q., Huang, D., & Tan, X. (2023) · European Journal of Pharmacology · doi:10.1016/j.ejphar.2023.176124 · Cited by 34
The role of ferroptosis in virus infections
Wang, J., Zhu, J., Ren, S., Zhang, Z., Niu, K., Li, H., Wu, W., & Chen, P. (2023) · Frontiers in Microbiology · doi:10.3389/fmicb.2023.1279655 · Cited by 33
Yan, Q., Zheng, W., Jiang, Y., Zhou, P., Lai, Y., Liu, C., Wu, P., Zhuang, H., Huang, H.-T., Li, G., et al. (2022) · Journal of Medical Virology · doi:10.1002/jmv.28386 · Cited by 32
“T‐cell activation is redox dependent, T‐cell receptor stimulation induces ROS production, and mitochondrial ROS are critical for T‐cell activation and expansion.(53,54) The CD8 T cells in flaviviruses, including ZIKV, may play a dual role.”
BackgroundMetalloptosis: metal ions-induced programmed cell death based on nanomaterials for cancer therapy
Wang, S., Ma, R., Mei, Z., & Hou, Y. (2024) · MedMat. · doi:10.1097/mm9.0000000000000004 · Cited by 30
Zhang, X., Zhu, H., & Zhang, J. (2025) · Antioxidants · doi:10.3390/antiox14020231 · Cited by 29
“Matsushita et al. found that the lipid peroxidation of T cells induced iron death and prevented the immune response to infection [46].”
Ferroptosis and Cancer Immunotherapy
Yin, J., Meng, X., Peng, L., Xie, W., Liu, X., He, W., & Li, S. (2022) · Current Molecular Medicine · doi:10.2174/1566524022666220509124608 · Cited by 28
The Role of Cellular Defense Systems of Ferroptosis in Parkinson’s Disease and Alzheimer’s Disease
Chu, J., Li, J., Sun, L., & Wei, J. (2023) · International Journal of Molecular Sciences · doi:10.3390/ijms241814108 · Cited by 29
Mechanisms of Vitamins Inhibiting Ferroptosis
Zhang, M., Chen, X., & Zhang, Y. (2024) · Antioxidants · doi:10.3390/antiox13121571 · Cited by 32
“The anti-ferroptosis properties of vitamin E were first elucidated by Matsushita et al., who demonstrated that vitamin E ( α TOH) mitigates T cell ferroptosis induced by the deletion of the Gpx4 gene [136].”
Wang, L., ChenLiu, Z., Wang, D., & Tang, D. (2025) · International Journal of Biological Macromolecules · doi:10.1016/j.ijbiomac.2025.140523 · Cited by 32
A new checkpoint against ferroptosis
Liang, D., Deng, L., & Jiang, X. (2019) · Cell Research · doi:10.1038/s41422-019-0258-0 · Cited by 29
Sesamin attenuates PM 2.5 -induced cardiovascular injury by inhibiting ferroptosis in rats
Ren, J., Yin, B., Li, X., Zhu, S., Deng, J.-L., Sun, Y., Zhang, Z.-A., Guo, Z., Pei, H., Zhang, F., et al. (2021) · Food & Function · doi:10.1039/d1fo02913d · Cited by 28
Wang, Y., Han, J., Luo, L., Kasim, V., & Wu, S. (2023) · Biomedicine & Pharmacotherapy · doi:10.1016/j.biopha.2023.114245 · Cited by 28
DEPDC5 protects CD8+ T cells from ferroptosis by limiting mTORC1-mediated purine catabolism
Li, S., Ouyang, X., Sun, H., Jin, J., Chen, Y., Li, L., Wang, Q., He, Y., Wang, J., Chen, T., et al. (2024) · Cell Discovery · doi:10.1038/s41421-024-00682-z · Cited by 28
“Similar to the immune defect observed in Depdc5 - de fi cient mice, T cell-speci fi c deletion of anti-ferroptosis gene Gpx4 can also impair homeostasis of the CD8 + subset while sparing the CD4 + compartment 23 .”
InfluentialResearch progress on the mechanism of ferroptosis and its clinical application
Xia, J., Si, H., Yao, W., Li, C., Guo, Y., Tian, Y., & Hao, C. (2021) · Experimental Cell Research · doi:10.1016/j.yexcr.2021.112932 · Cited by 27
Emerging insights into the role of ferroptosis in the pathogenesis of autoimmune diseases
Fan, J., Jiang, T., & He, D. (2023) · Frontiers in Immunology · doi:10.3389/fimmu.2023.1120519 · Cited by 27
Host-targeted Interventions as an Exciting Opportunity to Combat Malaria
Vijayan, K., Wei, L., Glennon, E. K. K., Mattocks, C., Bourgeois, N. M., Staker, B. L., & Kaushansky, A. (2021) · Chemical Reviews · doi:10.1021/acs.chemrev.1c00062 · Cited by 28
Insight into the Double-Edged Role of Ferroptosis in Disease
Zhang, L., Jia, R., Li, H., Yu, H., Ren, K., Jia, S., Li, Y., & Wang, Q. (2021) · Biomolecules · doi:10.3390/biom11121790 · Cited by 26
Molecular Mechanisms of Ferroptosis and Its Role in Viral Pathogenesis
Huang, R.-W., Wu, J., Ma, Y., & Kang, K. (2023) · Viruses · doi:10.3390/v15122373 · Cited by 26
Formation of singlet oxygen in addition to hydroxyl radical via the Fenton reaction
Shimizu, R., Watanabe, H., Iida, S., Yamamoto, Y., & Fujisawa, A. (2025) · Redox Biology · doi:10.1016/j.redox.2025.103687 · Cited by 25
Ferroptosis-Mediated Formation of Tumor-Promoting Immune Microenvironment
Bi, Q., Sun, Z.-J., Wu, J., & Wang, W. (2022) · Frontiers in Oncology · doi:10.3389/fonc.2022.868639 · Cited by 25
Ferroptosis: A potential therapeutic target in autoimmune disease (Review)
Shen, L., Wang, X., Zhai, C., & Chen, Y. (2023) · Experimental and Therapeutic Medicine · doi:10.3892/etm.2023.12067 · Cited by 27
“In a study investigating ferroptosis in immunity, both antigen‐specific CD8+ and CD4+ T cells failed to expand and protect infection in T cell‐specific GPX4‐deficient mice (TΔGpx4/ΔGpx4), whereas GPX4‐deficient T cells rapidly accumulated lipid peroxides and underwent ferroptosis in vitro (21).”
Ferroptosis: a potential target for the treatment of atherosclerosis
Li, C., Liu, R., Xiong, Z., Bao, X., Liang, S., Zeng, H., Wei, J. J., Gong, Q., Liu, L., & Guo, J. (2024) · Acta Biochimica et Biophysica Sinica · doi:10.3724/abbs.2024016 · Cited by 25
“For example, ferroptosis induces lipid peroxidation in T cells and promotes viral and parasitic infections [94].”
BackgroundTargeting lipoxygenases to suppress ferroptotic cell death
Pratt, D. A. (2023) · Proceedings of the National Academy of Sciences · doi:10.1073/pnas.2309317120 · Cited by 26
“Although LOXs have been found to be dispensable for ferroptosis both in vitro (12) and in vivo (2, 13, 14), cells which express substantial levels may be sensitized to ferroptosis induction (12).”
BackgroundThe interplay of transition metals in ferroptosis and pyroptosis
Vana, F., Szabo, Z., Masařík, M., & Kratochvílová, M. (2024) · Cell Division · doi:10.1186/s13008-024-00127-9 · Cited by 26
“This was further supported by the study where T-lymphocytes without functional GPX4 were not capable of clonal expansion and did not protect against choriomeningitis virus or para-sitical Leishmanias infection [23].”
ResultImmunometabolism of ferroptosis in the tumor microenvironment
Lupica-Tondo, G. L., Arner, E. N., Mogilenko, D. A., & Voss, K. (2024) · Frontiers in Oncology · doi:10.3389/fonc.2024.1441338 · Cited by 30
“Interestingly, biallelic deletion of GPX4 using a CD4 promoter-Cre system signi fi cantly decreased CD8 T cell numbers in the periphery while keeping CD4 T cells intact (91).”
MethodGPX4 is a key ferroptosis regulator orchestrating T cells and CAR-T-cells sensitivity to ferroptosis
Kłopotowska, M., Baranowska, I., Hajduk, S., Jurga, A., Leśniowska, N., Łaźniewski, M., Granica, M., Krawczyk, M., Dziewicka, M., Graczyk‐Jarzynka, A., et al. (2025) · Cancer Immunology Immunotherapy · doi:10.1007/s00262-025-04133-w · Cited by 26
A double-edged sword with a therapeutic target: iron and ferroptosis in immune regulation
Ni, S., Yuan, Y., Song, S., & Li, X. (2022) · Nutrition Reviews · doi:10.1093/nutrit/nuac071 · Cited by 24
The emerging role of ferroptosis in the pathological development and progression of sepsis
Zhou, H., Huang, J., Liu, Y., Wang, J., & Wang, J. (2025) · Military Medical Research · doi:10.1186/s40779-025-00665-5 · Cited by 29
“GPX4 -knockout CD8 + and CD4 + T cells failed to expand effectively during acute infections, but this defect can be reversed with vitamin E supplementation [142].”
Cashing in on ferroptosis against tumor cells: Usher in the next chapter
Valashedi, M. R., Najafi-Ghalehlou, N., Nikoo, A., Bamshad, C., Tomita, K., Kuwahara, Y., Sato, T., Roushandeh, A. M., & Roudkenar, M. H. (2021) · Life Sciences · doi:10.1016/j.lfs.2021.119958 · Cited by 26
Identification of a group of bisbenzylisoquinoline (BBIQ) compounds as ferroptosis inhibitors
Fan, Y., Zhang, Y., Shi, K., Cheng, S., Pei, D., & Shu, X. (2022) · Cell Death and Disease · doi:10.1038/s41419-022-05447-8 · Cited by 23
“However, ALOX15 has been shown to be dispensable for ferroptosis induced by GPX4-depletion in fibroblasts, T-cells, or renal tissues [10, 25] and a prevailing role of ALOX15 in ferroptosis Fig.”
BackgroundFerroptosis Detection: From Approaches to Applications
Zeng, F., Nijiati, S., Tang, L., Ye, J., Zhou, Z., & Chen, X. S. (2023) · Angewandte Chemie · doi:10.1002/ange.202300379 · Cited by 25
Zhao, Q., Yu, H., Shi, M., Wang, X., Fan, Z., & Wang, Z. (2024) · International Immunopharmacology · doi:10.1016/j.intimp.2024.112433 · Cited by 22
Research progress of ferroptosis in female infertility
Fan, P., yuxian, W., jiali, Z., & jian, X. (2024) · Journal of Ovarian Research · doi:10.1186/s13048-024-01508-y · Cited by 25
Regulation of Ferroptosis in Cancer and Immune Cells
Jang, N., Kim, I., Jung, D., Chung, Y., & Kang, Y. P. (2025) · Immune Network · doi:10.4110/in.2025.25.e6 · Cited by 26
“In contrast, Treg cells do not depend on GPX4 for their expansion, but critically require it to maintain their immunosuppressive function (47,50).”
InfluentialFerroptosis: a novel perspective on tumor immunotherapy
Xu, Y., Ge, M., Xu, Y., & Yin, K. (2025) · Frontiers in Immunology · doi:10.3389/fimmu.2025.1524711 · Cited by 24
Ferroptosis and bone health: bridging the gap between mechanisms and therapy
Xiao, R., Han, Z., Peng, J., Li, P., Gong, M., Cai, Y., Pang, L., Ye, X., & Jin, S. (2025) · Frontiers in Immunology · doi:10.3389/fimmu.2025.1634516 · Cited by 24
Muri, J., Corak, B., Matsushita, M., Baes, M. I., & Köpf, M. (2022) · The Journal of Immunology · doi:10.4049/jimmunol.2100518 · Cited by 23
Self-citationChen, Y., Liao, X., Jing, P., Hu, L., Yang, Z., Yao, Y., Liao, C., & Zhang, S. (2022) · Molecular Pharmaceutics · doi:10.1021/acs.molpharmaceut.2c00333 · Cited by 22
Deciphering the link: ferroptosis and its role in glioma
Wang, H., Liu, Y., Che, S., Li, X., Tang, D., Lv, S., & Hai, Z. (2024) · Frontiers in Immunology · doi:10.3389/fimmu.2024.1346585 · Cited by 24
Morel, L. M., & Scindia, Y. M. (2024) · Clinical Immunology · doi:10.1016/j.clim.2024.110181 · Cited by 21
CAR-NK Cells for Cancer Therapy: Molecular Redesign of the Innate Antineoplastic Response
Rojas‐Martínez, A., Cienfuegos-Jiménez, O., & Vázquez‐Garza, E. (2021) · Current Gene Therapy · doi:10.2174/1566523222666211217091724 · Cited by 21
Xing, X., Liu, Y., Liu, J., Zhou, H., Zhang, H., Zuo, Q., Bu, P., Duan, T., Zhou, Y., & Xiao, Z. (2022) · Frontiers in Immunology · doi:10.3389/fimmu.2022.851312 · Cited by 21
Montanari, M., Burattini, S., Ciacci, C., Ambrogini, P., Carloni, S., Balduini, W., Lopez, D., Panza, G., Papa, S., & Canonico, B. (2022) · Biomolecules · doi:10.3390/biom12050701 · Cited by 22
“We also evaluated ROS content (Figure 2O), since mitochondrial ROS are implicated in the modulation of immune responses [50,51].”
BackgroundMethodZhang, L., Hou, N., Chen, B., Kan, C., Han, F., Zhang, J., & Sun, X. (2022) · Frontiers in Pharmacology · doi:10.3389/fphar.2022.908772 · Cited by 21
Ferroptosis and multi-organ complications in COVID-19: mechanisms and potential therapies
Li, Q., Chen, Z., Zhou, X., Li, G., Zhang, C., & Yang, Y. (2023) · Frontiers in Genetics · doi:10.3389/fgene.2023.1187985 · Cited by 25
“Notably, GPX4-deficient T cells undergo rapid accumulation of lipid peroxide (Matsushita et al., 2015).”
BackgroundPeng, X., Hou, L., Wu, X. F., Liu, Z., Wang, Y., Zeng, P., Yang, Y., Ma, W., & Yang, P. (2023) · Journal of Molecular Medicine · doi:10.1007/s00109-023-02361-0 · Cited by 22
“Recently, some studies have shown that apoptosis is often accompanied by ferroptosis [31], apoptosis and necrosis inducers can trigger ferroptosis [32], and T lymphocytes and macrophages also accelerate the occurrence of ferroptosis [33, 34].”
BackgroundP53 together with ferroptosis: a promising strategy leaving cancer cells without escape
Zhan, J., Wang, J., Liang, Y., Zeng, X., Li, E., & Wang, H. (2023) · Acta Biochimica et Biophysica Sinica · doi:10.3724/abbs.2023270 · Cited by 22
“However, other studies have shown that in kidney and T lymphocytes, the inhibition of GPX4 is more significant than the activation of ALOX15 to induce ferroptosis [50,51].”
BackgroundAFB1 and OTA Promote Immune Toxicity in Human LymphoBlastic T Cells at Transcriptomic Level
Frangiamone, M., Lozano, M., Cimbalo, A., Font, G., & Manyes, L. (2023) · Foods · doi:10.3390/foods12020259 · Cited by 20
Inflammasome activation occurs in CD4+ and CD8+ T cells during graft-versus-host disease
Talley, S., Rademacher, D. J., & Campbell, E. M. (2023) · Cell Death and Disease · doi:10.1038/s41419-023-06138-8 · Cited by 22
Development of therapies for rare genetic disorders of GPX4: roadmap and opportunities
Cheff, D. M., Muotri, A. R., Stockwell, B. R., Schmidt, E. E., Ran, Q., Kartha, R. V., Johnson, S. C., Mittal, P., Arnér, E. S. J., Wigby, K. M., et al. (2021) · Orphanet Journal of Rare Diseases · doi:10.1186/s13023-021-02048-0 · Cited by 24
Oleic Acid Inhibits SDC4 and Promotes Ferroptosis in Lung Cancer Through GPX4/ACSL4
Dong, J., Qi, F., Qie, H.-J., Du, S., Li, L., Zhang, Y., Xu, K., Li, D., & Xu, Y. (2024) · The Clinical Respiratory Journal · doi:10.1111/crj.70014 · Cited by 19
Wang, J., Xin, Y., Dong, Z., Li, S., & Yang, G. (2025) · Experimental Gerontology · doi:10.1016/j.exger.2025.112974 · Cited by 22
Lipid metabolism drives dietary effects on T cell ferroptosis and immunity
Wang, N., Chen, Z., Yao, Y., Sun, C., Wei, W., Sun, L., Zhang, H., Li, F., Butcher, D. A., Sun, S., et al. (2026) · Nature · doi:10.1038/s41586-026-10193-4 · Cited by 19
Pacheco‐Fernández, T., Markle, H. L., Verma, C., Huston, R. H., Gannavaram, S., Nakhasi, H. L., & Satoskar, A. R. (2023) · Research and Reports in Tropical Medicine · doi:10.2147/rrtm.s392606 · Cited by 19
“In adaptive immunity, GPX4 knockout mice showed the presence of antigen specific CD8+ and CD4+ cells, yet failed to expand T cell counts during chronic infection.(127) Mechanically, IFN-γ released from CD8+ T cells triggers lipid peroxidation and ferroptosis through the inhibition of system Xc.”
BackgroundInfluentialOxidative Stress, Selenium Redox Systems Including GPX/TXNRD Families
Ingold, I., & Conrad, M. (2018) · Molecular and integrative toxicology · doi:10.1007/978-3-319-95390-8_6 · Cited by 19
Self-citationChen, Y., Pan, G., Wu, F., Zhang, Y., Li, Y., & Luo, D. (2024) · Biomedicine & Pharmacotherapy · doi:10.1016/j.biopha.2024.116971 · Cited by 25
Bridging the gap: ferroptosis of immune cells in the tumor microenvironment
Wang, W., Li, H., Liang, S., Hu, Y., Ding, J., Wu, X., & Hua, D. (2025) · Frontiers in Immunology · doi:10.3389/fimmu.2025.1648432 · Cited by 19
“Emerging evidence reveals a dichotomy: studies have shown that macrophages, CD8+T cells, B cells and Treg cells tend to resist ferroptosis through the canonical GPX4-regulated ferroptosis pathway and neutrophils, DCs and NK cells prefer the GPX4-independent surveillance pathways (33 – 36).”
Ferroptosis: potential targets and emerging roles in pancreatic diseases
Huang, Z., Ma, Y., Sun, Z., Cheng, L., & Wang, G. (2023) · Archives of Toxicology · doi:10.1007/s00204-023-03625-x · Cited by 19
“For example, glutathione peroxidase 4 (GPX4) depletion induces lipid peroxidation and ferroptosis in T cells, preventing T cells from effectively protecting against parasitic and viral infections (Matsushita et al. 2015).”
CD4 + T cells ferroptosis is associated with the development of sepsis in severe polytrauma patients
Kong, Z., Cai, S., Xie, W., Chen, J., Xie, J., Yang, F., Li, Z., Bai, X., & Liu, T. (2023) · International Immunopharmacology · doi:10.1016/j.intimp.2023.111377 · Cited by 18
Zheng, B., Niu, Z., Si, S., Zhao, G., Wang, J., Yao, Z., Cheng, F., & He, W. (2021) · Aging · doi:10.18632/aging.203390 · Cited by 18
“Many studies have also reported that dysregulated ferroptosis may affect multiple pathological processes, such as cancer cell death, renal failure, and T cell immunity [14, 15, 30].”
BackgroundTong, J., Wang, H., Xu, X., Wan, Z., Fang, H., Chen, J., Mu, X., Liu, Z., Chen, J., Su, H., et al. (2022) · Frontiers in Immunology · doi:10.3389/fimmu.2022.885829 · Cited by 18
Research progress on ferroptosis in colorectal cancer
Li, Y., Bi, Y., Li, W., Piao, Y., Piao, J., Wang, T., & Ren, X. (2024) · Frontiers in Immunology · doi:10.3389/fimmu.2024.1462505 · Cited by 17
“…shown that after transfer of GPX4-de fi cient CD4 + and CD8 + T cells into a mouse model, both types of cells are rapidly lost and undergo ferroptosis at 7 days post-transfer, suggesting that the survival and proliferation of CD4 + and CD8 + T lymphocytes are signi fi cantly in fl uenced by GPX4 (42).”
BackgroundThe Regulation Role of Ferroptosis Mechanism of Anti-Cancer Drugs and Noncoding RNAs
Ensoy, M., Bumin, Z. S., Jama, H. A., & Cansaran‐Duman, D. (2022) · Current Medicinal Chemistry · doi:10.2174/0929867329666220629154418 · Cited by 17
Li, H., Zeng, Y., Luo, S., Li, Z., Huang, F., & Liu, Z. (2022) · Biochemical and Biophysical Research Communications · doi:10.1016/j.bbrc.2022.12.034 · Cited by 17
Nutritional deficiencies that may predispose to long COVID
Schloss, J. V. (2023) · Inflammopharmacology · doi:10.1007/s10787-023-01183-3 · Cited by 19
“The T cell GPX4 is essential for preventing T cell death by MPO-induced ferroptosis with concomitant loss of effective immune response (Matsushita et al. 2015).”
BackgroundDong, B., Wang, Y., Wei, H., Kong, X., Li, S., & Yue, T. (2023) · Analytica Chimica Acta · doi:10.1016/j.aca.2023.341571 · Cited by 17
Jia, M., Chai, L., Wang, J., Wang, M., Qin, D., Song, H., Fu, Y., Zhao, C., Gao, C., Jia, J., et al. (2024) · Nature Communications · doi:10.1038/s41467-024-46212-z · Cited by 18
Advances in the study of ferroptosis and its relationship to autoimmune diseases
Dong, W., Xu, H., Wei, W., Ning, R., & Chang, Y. Z. (2024) · International Immunopharmacology · doi:10.1016/j.intimp.2024.112819 · Cited by 18
Sok, S. P. M., Pipkin, K., Popescu, N. I., Reidy, M. A., Li, B., Remmen, H. V., Kinter, M., Sun, X.-H., Fan, Z., & Zhao, M. (2024) · The Journal of Immunology · doi:10.4049/jimmunol.2400246 · Cited by 17
Different functions of vitamin E homologues in the various types of cell death induced by oxysterols
Suzuki, A., Urano, Y., Ishida, T., & Noguchi, N. (2021) · Free Radical Biology and Medicine · doi:10.1016/j.freeradbiomed.2021.10.008 · Cited by 18
Lancaster, G. I., & Murphy, A. J. (2025) · Journal of Lipid Research · doi:10.1016/j.jlr.2025.100765 · Cited by 16
“T cells lacking Gpx4 appear to develop and mature normally within the thymus, suggesting that ferroptosis does not contribute to thymic T cell development (35).”
Metadata
- Authors
- Matsushita, M., Freigang, S., Schneider, C., Conrad, M., Bornkamm, G. W., & Kopf, M.
- Affiliations
- ETH Zurich (CH)
- Helmholtz Munich (DE)
- Molecular Biomedicine, Institute of Molecular Health Science, Department of Biology, ETH Zurich, 8093 Zurich, Switzerland 1
- Venue
- Journal of Experimental Medicine
- Publisher
- Rockefeller University Press
- Published
- 2015-03-30
- Volume
- 212
- Issue
- 4
- Pages
- 555-568
- ISSN
- 0022-1007 (ISSN-L)
- 1540-9538
- PMC
- PMC4387287
- OpenAlex
- W2065934830
- Cited by
- 672
- References
- 57
- Citations by year
- 2026: 65 · 2025: 77 · 2024: 90 · 2023: 90 · 2022: 95 · 2021: 92 · 2020: 56 · 2019: 28 · 2018: 25 · 2017: 22 · 2016: 24 · 2015: 8
- FWCI
- 12.96
- Type
- journal article
- Language
- en
- Open access
- bronze
- doi.org
- Locations
- The Journal of Experimental Medicine (publishedVersion)
- Europe PMC (PubMed Central) (publishedVersion, cc-by-nc-sa)
- PubMed Central (publishedVersion, cc-by-nc-sa)
- PubMed (publishedVersion)
- Repository for Publications and Research Data (ETH Zurich) (publishedVersion, cc-by-nc-sa)
- Bern Open Repository and Information System (University of Bern) (submittedVersion, cc-by-nc-sa)
- Site cant be reached (submittedVersion)
- PuSH - Publication Server of Helmholtz Zentrum München (submittedVersion)
- ETH Zürich Research Collection
- Funders
- Schweizerischer Nationalfonds zur Förderung der Wissenschaftlichen Forschung (141175, 310030B_141175/1)
- National Institutes of Health
- Topics
- Life Sciences › Immunology and Microbiology › Immunology › T-cell and B-cell Immunology
- Life Sciences › Biochemistry, Genetics and Molecular Biology › Cancer Research › Ferroptosis and cancer prognosis
- Health Sciences › Nursing › Nutrition and Dietetics › Selenium in Biological Systems
- Keywords
- GPX4, ferroptosis, lipid peroxidation, T cell immunity, CD8+ T cells, CD4+ T cells, phospholipid hydroperoxides, vitamin E, lymphocytic choriomeningitis virus, Leishmania major, antiviral immunity, antiparasitic immunity, T cell homeostasis, T cell-specific knockout mice
- MeSH terms
- Phospholipid Hydroperoxide Glutathione Peroxidase, Animals, Cell Membrane, Glutathione Peroxidase, Immunologic Memory, Lymphocytic Choriomeningitis, Lymphocytic choriomeningitis virus, Thymus Gland, Vitamin E, Vitamins, Lipid Peroxidation, CD4-Positive T-Lymphocytes, Leishmaniasis, Cutaneous, Cell Death, Leishmania major, Mice, Knockout, CD8-Positive T-Lymphocytes, Mice
About these checks
Registry, retraction, Cites and statistics results are computed, not judged, with one exception: a printed reference that no index lists is read once by a model before it counts as a citation error. Claims are extracted by a model and kept only when their quote appears verbatim in the text; each cited source is then checked, with a model’s help, for whether it says what the claim relies on. Those verdicts can be wrong — read the claim’s quote and the cited source before relying on one.
Statistics and arithmetic are recomputed, not judged.
Confidence bands are shown only for fields calibrated on our annotated test set. None is calibrated yet, so no band is shown.
What counts as a claim ›How we measure confidence ›How we check this ›
Are you an author, or do you see a problem with this page? Request a review
