

The DOI matches its Crossref record; 41 of the 41 references it cites were found in a registry or an index; 5 of the 38 sources its claims cite were checked for support.
Increased Time in Range and Fewer Missed Bolus Injections After Introduction of a Smart Connected Insulin Pen
Open accessAbstract
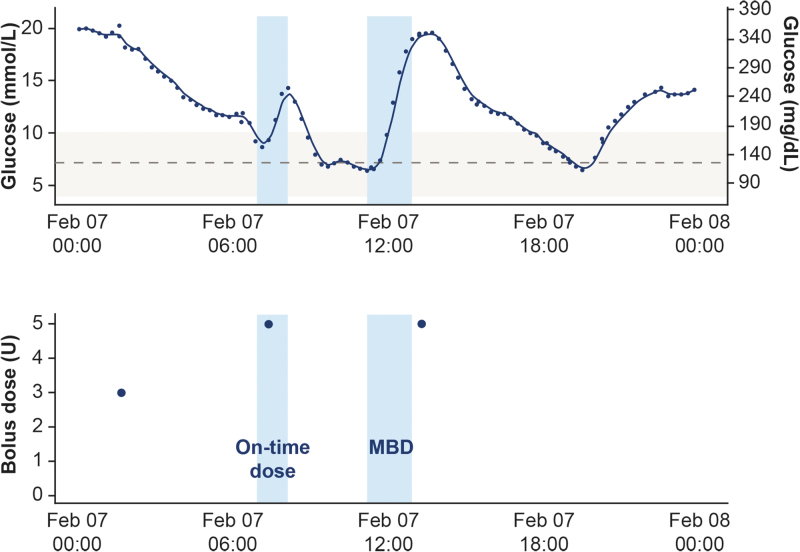
Background: This observational study investigated whether the connected NovoPen ® 6 could influence insulin regimen management and glycemic control in people with type 1 diabetes (T1D) using a basal-bolus insulin regimen and continuous glucose monitoring in a real-world setting. Methods: Participants from 12 Swedish diabetes clinics downloaded pen data at each visit (final cohort: n = 94). Outcomes included time in range (TIR; sensor glucose 3.9–10.0 mmol/L), time in hyperglycemia (>10 mmol/L), and hypoglycemia (L1: 3.0– <3.9 mmol/L; L2: <3.0 mmol/L). Missed bolus dose (MBD) injections were meals without bolus injection within −15 and +60 min from the start of a meal. Outcomes were compared between the baseline and follow-up periods (≥5 health care professional visits). Data were analyzed from the first 14 days following each visit. For the TIR and total insulin dose analyses ( n = 94), a linear mixed model was used, and for the MBD analysis ( n = 81), a mixed Poisson model was used. Results: TIR significantly increased (+1.9 [0.8; 3.0] 95% CI h/day; P < 0.001) from baseline to follow-up period, with a corresponding reduction in time in hyperglycemia (−1.8 [−3.0; −0.6] 95% CI h/day; P = 0.003) and L2 hypoglycemia (−0.3 [−0.6; −0.1] 95% CI h/day; P = 0.005), and no change in time in L1 hypoglycemia. MBD injections decreased by 43% over the study ( P = 0.002). Change in MBD injections corresponded to a decrease from 25% to 14% based on the assumption that participants had three main meals per day. Conclusions: Our study highlights the potential benefit on glycemic control and dosing behavior when reliable insulin dose data from a connected pen contribute to insulin management in people with T1D.
Overview
AI snapshot
Written from the paper’s full text.
TL;DR
In a one-arm real-world study of adults with type 1 diabetes using CGM, introducing the connected NovoPen® 6 was associated with improved time in range and fewer missed bolus injections. The authors conclude connected pen data may support insulin regimen management, but the observational design cannot prove causality.
Key findings
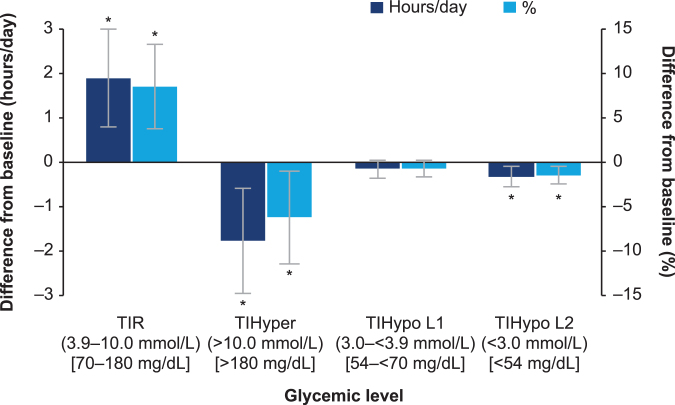
- Time in range increased by 1.9 h/day (95% CI 0.8; 3.0; P < 0.001), or 8.5% of the day (95% CI 3.7; 13.3; P < 0.001), from baseline to after ≥5 HCP visits.
- Time in hyperglycemia decreased by 1.8 h/day (95% CI −3.0; −0.6; P = 0.003), and L2 hypoglycemia (<3.0 mmol/L) decreased by 0.3 h/day (95% CI −0.6; −0.1; P = 0.005); L1 hypoglycemia did not change significantly (P = 0.181).
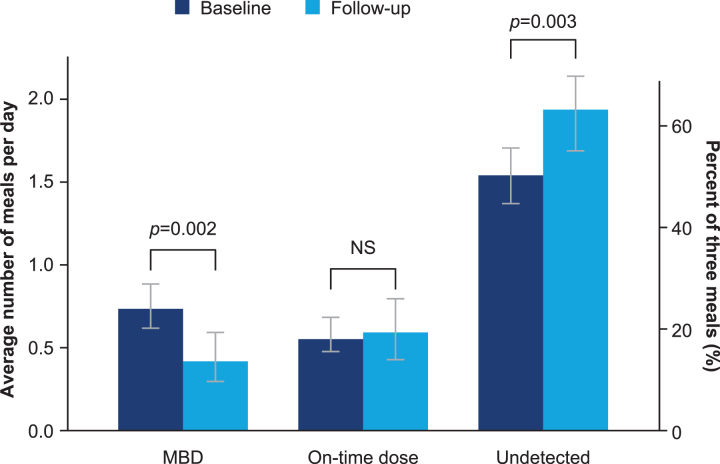
- Missed bolus dose injections decreased by 43% (estimated relative change −43.1%, 95% CI −60.5; −18.0; P = 0.002), from 0.74 to 0.42 daily MBD injections, corresponding to a decrease from 24.7% to 14.1% assuming three meals/day.
- Bolus insulin dose increased by 28% (95% CI 9.4; 49.5; P = 0.002), while basal dose did not change significantly; coefficient of variation decreased by 3.8% (95% CI −6.1; −1.6; P = 0.001).
Methods
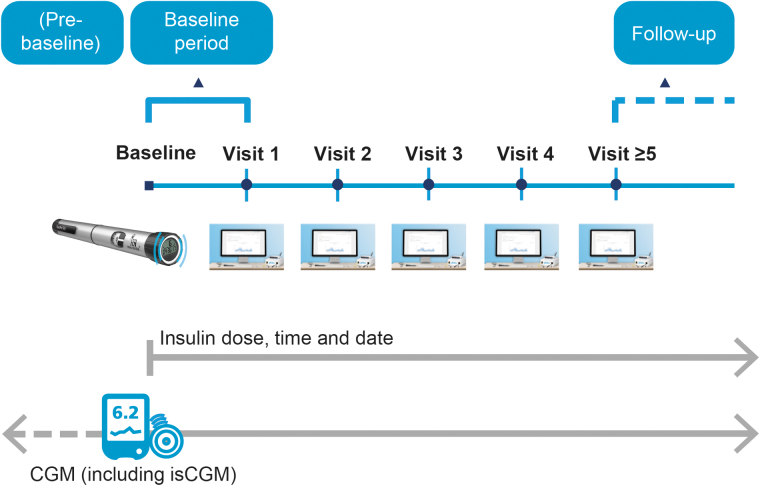
- One-arm, prospective, observational proof-of-concept study across 12 Swedish diabetes clinics from May 2017 to April 2019; analyses used data from May 2017 to October 2018.
- Final cohort: 94 adults with type 1 diabetes using CGM and the connected NovoPen® 6 (48 men, 46 women; mean age 40.1 years, range 18–83); MBD analysis included 81 participants with bolus pen data.
- Outcomes compared baseline with follow-up after ≥5 HCP visits using the first 14 days after each visit and days with ≥70% CGM coverage; linear mixed models for TIR/total insulin dose and a mixed Poisson model for MBD injections, with meals detected by the GRID algorithm.
Limitations
- The paper states this was a short, single-arm observational study, so it cannot conclude with certainty that connected pen use directly improved glycemic control; longer studies are needed to assess durability.
- The paper states visit frequency and study duration varied by local practice, possibly causing selection bias, and many participant IDs (65%) were excluded during data cleaning; only 14 participants had TIR data at visit 5 or later, and 10 had MBD data at ≥5 visits.
- Evident from the text: there was no control group, HbA1c was not recorded, most participants used isCGM with 15-min readings resampled from rtCGM, and the GRID algorithm was designed to detect meals containing at least 40 g carbohydrate, with undetected meals increasing significantly (25.4%, P = 0.003).
Model-written summary. Check it against the paper before relying on it.
Integrity signals
Registry
Cites
Statistics
Figures
Verification
Claims the paper makes
19 Own result · 16 Not checked yet · 15 Own method · 13 Own interpretation · 2 No basis given · 1 Partly supported · accuracy not yet measured
A result the paper reports from its own data — it cites no other source for it, so there is none to check. The quote shows it is in the paper.
In the paper
“L2 hypoglycemia (−0.3 [−0.6; −0.1]95% CI h/day; P = 0.005)”
§ Increased Time in Range and Fewer Missed Bolus Injections After Introduction of a Smart Connected Insulin Pen > Abstract
plaindirect- Asserted: passes — The authors put it forward as true.
- Checkable: passes — It can be checked against evidence.
- Load-bearing: passes — The paper’s conclusions depend on it.
- Based: passes — The paper gives a reason why it holds.
A result the paper reports from its own data — it cites no other source for it, so there is none to check. The quote shows it is in the paper.
In the paper
“A significant reduction in L2 hypoglycemia (<3.0 mmol/L [<54 mg/dL]) of −0.3 [−0.6; −0.1]95% CI hours per day (P = 0.005)”
§ Increased Time in Range and Fewer Missed Bolus Injections After Introduction of a Smart Connected Insulin Pen > Results > Glycemic summary measures and insulin dosing
plaindirectn = 94 ·- Asserted: passes — The authors put it forward as true.
- Checkable: passes — It can be checked against evidence.
- Load-bearing: passes — The paper’s conclusions depend on it.
- Based: passes — The paper gives a reason why it holds.
A result the paper reports from its own data — it cites no other source for it, so there is none to check. The quote shows it is in the paper.
In the paper
“MBD injections decreased by 43% over the study (P = 0.002).”
§ Increased Time in Range and Fewer Missed Bolus Injections After Introduction of a Smart Connected Insulin Pen > Abstract
plain- Asserted: passes — The authors put it forward as true.
- Checkable: passes — It can be checked against evidence.
- Load-bearing: passes — The paper’s conclusions depend on it.
- Based: passes — The paper gives a reason why it holds.
A result the paper reports from its own data — it cites no other source for it, so there is none to check. The quote shows it is in the paper.
In the paper
“A significant decrease of 43% (estimated relative change: −43.1% [−60.5; −18.0]95% CI, P = 0.002; Table 2) in the average daily number of MBD injections was observed from baseline (0.74 [0.62; 0.88]95% CI) to the follow-up period (0.42 [0.30; 0.60]95% CI, P = 0.002; Table 2 and Fig. 5).”
§ Increased Time in Range and Fewer Missed Bolus Injections After Introduction of a Smart Connected Insulin Pen > Results > MBD injections
hedged- Asserted: passes — The authors put it forward as true.
- Checkable: passes — It can be checked against evidence.
- Load-bearing: passes — The paper’s conclusions depend on it.
- Based: passes — The paper gives a reason why it holds.
A result the paper reports from its own data — it cites no other source for it, so there is none to check. The quote shows it is in the paper.
In the paper
“There was no significant change in mean time spent in L1 hypoglycemia (3.0– <3.9 mmol/L [54– <70 mg/dL]; P = 0.181; Table 1 and Fig. 4).”
§ Increased Time in Range and Fewer Missed Bolus Injections After Introduction of a Smart Connected Insulin Pen > Results > Glycemic summary measures and insulin dosing
plainn = 94- Asserted: passes — The authors put it forward as true.
- Checkable: passes — It can be checked against evidence.
- Load-bearing: unclear — It is unclear whether the paper’s conclusions depend on it.
- Based: passes — The paper gives a reason why it holds.
A result the paper reports from its own data — it cites no other source for it, so there is none to check. The quote shows it is in the paper.
In the paper
“TIR significantly increased (+1.9 [0.8; 3.0]95% CI h/day; P < 0.001) from baseline to follow-up period”
- Also stated in: § Glycemic summary measures and insulin dosing · plain
“A significant absolute increase in mean TIR of 1.9 [0.8; 3.0]95% CI hours per day (P < 0.001) or 8.5% (percent of day) [3.7; 13.3]95% CI (P < 0.001) was reported, from baseline to after five HCP visits”
§ Increased Time in Range and Fewer Missed Bolus Injections After Introduction of a Smart Connected Insulin Pen > Abstract
plaindirectn = 94 ·- Asserted: passes — The authors put it forward as true.
- Checkable: passes — It can be checked against evidence.
- Load-bearing: passes — The paper’s conclusions depend on it.
- Based: passes — The paper gives a reason why it holds.
- Also stated in: § Glycemic summary measures and insulin dosing · plain
A result the paper reports from its own data — it cites no other source for it, so there is none to check. The quote shows it is in the paper.
In the paper
“the coefficient of variation was significantly reduced by 3.8% [−6.1; −1.6]95% CI from a baseline level of 35.9% (P = 0.001; Table 1).”
§ Increased Time in Range and Fewer Missed Bolus Injections After Introduction of a Smart Connected Insulin Pen > Results > Glycemic summary measures and insulin dosing
plaindirectn = 94 ·- Asserted: passes — The authors put it forward as true.
- Checkable: passes — It can be checked against evidence.
- Load-bearing: passes — The paper’s conclusions depend on it.
- Based: passes — The paper gives a reason why it holds.
A result the paper reports from its own data — it cites no other source for it, so there is none to check. The quote shows it is in the paper.
In the paper
“or −1.5% (percent of day) [−2.5; −0.5]95% CI (P = 0.004) was also observed”
§ Increased Time in Range and Fewer Missed Bolus Injections After Introduction of a Smart Connected Insulin Pen > Results > Glycemic summary measures and insulin dosing
plaindirectn = 94 ·- Asserted: passes — The authors put it forward as true.
- Checkable: passes — It can be checked against evidence.
- Load-bearing: passes — The paper’s conclusions depend on it.
- Based: passes — The paper gives a reason why it holds.
A result the paper reports from its own data — it cites no other source for it, so there is none to check. The quote shows it is in the paper.
In the paper
“In terms of bolus insulin dose (n = 81), there was a significant increase from baseline (25.1 U/day [22.0; 28.7]95% CI) to after five HCP visits of 28% [9.4; 49.5]95% CI (P = 0.002).”
§ Increased Time in Range and Fewer Missed Bolus Injections After Introduction of a Smart Connected Insulin Pen > Results > Glycemic summary measures and insulin dosing
plaindirectn = 81 ·- Asserted: passes — The authors put it forward as true.
- Checkable: passes — It can be checked against evidence.
- Load-bearing: unclear — It is unclear whether the paper’s conclusions depend on it.
- Based: passes — The paper gives a reason why it holds.
A result the paper reports from its own data — it cites no other source for it, so there is none to check. The quote shows it is in the paper.
In the paper
“There was no significant change from baseline (24.2 U/day [19.8; 29.8]95% CI) in mean basal insulin dose (n = 22; change 11% [−7.2; 32.8]95% CI, P = 0.238).”
§ Increased Time in Range and Fewer Missed Bolus Injections After Introduction of a Smart Connected Insulin Pen > Results > Glycemic summary measures and insulin dosing
plainn = 22- Asserted: passes — The authors put it forward as true.
- Checkable: passes — It can be checked against evidence.
- Load-bearing: unclear — It is unclear whether the paper’s conclusions depend on it.
- Based: passes — The paper gives a reason why it holds.
- It may state two separate claims as one. 16
- Probably not a substantial claim. 28
- The quote only partly states this claim. 1
The cited sources support only part of this claim — read each source’s verdict below.
In the paper
“The impact of missed insulin injections on HbA1c levels is well established,7–12 leading to an increasing risk of diabetes-related complications.13,14”
§ Increased Time in Range and Fewer Missed Bolus Injections After Introduction of a Smart Connected Insulin Pen > Introduction
What the sources say
- Supportedcites [7] Randlov J, Poulsen JU: How much do forgotten insulin injections matter to hemoglobin a1c in people with diabetes? A simulation study. J Diabetes Sci Technol 2008; 2: 229– 235 19885347 PMC2771482 source
The source supports the part of the citing sentence concerning missed injections and HbA1c: its Results report that simulated missed injections increased HbA1c. The complications-risk clause has separate citations (13, 14), so it is not attributed to this source. (LLM, conf=0.92)
- Could not verifycites [8] Munshi MN, Segal AR, Suhl E, et al.: Assessment of barriers to improve diabetes management in older adults: a randomized controlled study. Diabetes Care 2013; 36: 543– 549 23193208 PMC3579376 sourceExperimental — accuracy not yet measured
The Conclusions describe reluctance to adjust insulin doses and associated high glucose excursions; the Abstract Results report changes in A1C after a self-care intervention. Neither passage addresses missed insulin injections specifically or links them to increased diabetes-related complications (searched: missed injections, missed doses, A1C, complications). (LLM, conf=0.73)
- Not checked yetcites [9] Hood KK, Peterson CM, Rohan JM, et al.: Association between adherence and glycemic control in pediatric type 1 diabetes: a meta-analysis. Pediatrics 2009; 124: e1171– e1179 19884476 source
- Not checked yetcites [10] Spaans E, van Hateren KJJ, Groenier KH, et al.: Mealtime insulin bolus adherence and glycemic control in adolescents on insulin pump therapy. Eur J Pediatr 2018; 177: 1831– 1836 30238153 source
- Partly supportedcites [11] Andrade CS, Ribeiro GS, Santos C, et al.: Factors associated with high levels of glycated haemoglobin in patients with type 1 diabetes: a multicentre study in Brazil. BMJ Open 2017; 7: e018094 PMC5736030 29247092 sourceExperimental — accuracy not yet measured
The Results and Discussion report that poorer self-perceived adherence to insulin therapy was associated with higher HbA1c in patients with type 1 diabetes. The paper does not specifically measure missed injections or establish that they cause the increase. In the citing sentence, separate citations are attached to the complications claim. (LLM, conf=0.85)
- Supportedcites [12] Olinder AL, Kernell A, Smide B: Missed bolus doses: devastating for metabolic control in CSII-treated adolescents with type 1 diabetes. Pediatr Diabetes 2009; 10: 142– 148 19175898 source
The Results section reports that adolescents who missed more bolus doses had higher HbA1c, and the Discussion says less frequent bolus dosing could explain the difference. This source is cited among references 7–12 for the HbA1c point; the complications-risk point is attached to references 13–14, not this source. (LLM, conf=0.90)
- Not checked yetcites [13] Nathan DM, Genuth S, Lachin J, et al.: The effect of intensive treatment of diabetes on the development and progression of long-term complications in insulin-dependent diabetes mellitus. N Engl J Med 1993; 329: 977– 986 8366922 source
- Supportedcites [14] Nathan DM, Cleary PA, Backlund JY, et al.: Intensive diabetes treatment and cardiovascular disease in patients with type 1 diabetes. N Engl J Med 2005; 353: 2643– 2653 16371630 PMC2637991 source
The citation is attached to the increased risk of diabetes-related complications, not to the preceding claim about missed injections. In the Results, a lower glycosylated hemoglobin value was associated with a lower risk of cardiovascular events; the paper also reports that hyperglycemia plays a causal role in microvascular complications of type 1 diabetes. (LLM, conf=0.92)
boosteddirect- Asserted: passes — The authors put it forward as true.
- Checkable: passes — It can be checked against evidence.
- Load-bearing: passes — The paper’s conclusions depend on it.
- Based: passes — The paper gives a reason why it holds.
It may state two separate claims as one.
- Supported
A result the paper reports from its own data — it cites no other source for it, so there is none to check. The quote shows it is in the paper.
In the paper
“The change in MBD injections by visit is included in Supplementary Figure S2, which shows that a significant effect was seen from visit 3, and that it was relatively consistent from this point onward.”
§ Increased Time in Range and Fewer Missed Bolus Injections After Introduction of a Smart Connected Insulin Pen > Results > MBD injections
plaindirect- Asserted: passes — The authors put it forward as true.
- Checkable: passes — It can be checked against evidence.
- Load-bearing: unclear — It is unclear whether the paper’s conclusions depend on it.
- Based: passes — The paper gives a reason why it holds.
It may state two separate claims as one.
A result the paper reports from its own data — it cites no other source for it, so there is none to check. The quote shows it is in the paper.
In the paper
“The change in TIR was relatively stable from visit 4 onward, as shown in Supplementary Figure S1.”
§ Increased Time in Range and Fewer Missed Bolus Injections After Introduction of a Smart Connected Insulin Pen > Results > Glycemic summary measures and insulin dosing
plainn = 94- Asserted: passes — The authors put it forward as true.
- Checkable: passes — It can be checked against evidence.
- Load-bearing: fails — The paper’s conclusions may not depend on it.
- Based: passes — The paper gives a reason why it holds.
Probably not a substantial claim. The paper’s conclusions may not depend on it.
A result the paper reports from its own data — it cites no other source for it, so there is none to check. The quote shows it is in the paper.
In the paper
“Based on these analyses, the 8.5% increase in TIR reported here would be expected to correspond to an improvement in HbA1c of ∼0.4–0.7% (4–7 mmol/mol).”
§ Increased Time in Range and Fewer Missed Bolus Injections After Introduction of a Smart Connected Insulin Pen > Discussion
hedgeddirect- Asserted: passes — The authors put it forward as true.
- Checkable: passes — It can be checked against evidence.
- Load-bearing: passes — The paper’s conclusions depend on it.
- Based: passes — The paper gives a reason why it holds.
The quote only partly states this claim.
The paper states this without a source or data behind it here, so there is nothing to check it against. The quote shows it is in the paper.
In the paper
“This amounts to five meals with a missed dose per week on average.”
§ Increased Time in Range and Fewer Missed Bolus Injections After Introduction of a Smart Connected Insulin Pen > Discussion
plain- Asserted: passes — The authors put it forward as true.
- Checkable: passes — It can be checked against evidence.
- Load-bearing: fails — The paper’s conclusions may not depend on it.
- Based: passes — The paper gives a reason why it holds.
Probably not a substantial claim. The paper’s conclusions may not depend on it.
- The authors state this as an assumption: Participants have three main meals per day on average.
A result the paper reports from its own data — it cites no other source for it, so there is none to check. The quote shows it is in the paper.
In the paper
“The study data also confirmed that missing bolus injections can be common for people with T1D, where on average at least 25% of meals had a missed dose, assuming three meals per day.”
§ Increased Time in Range and Fewer Missed Bolus Injections After Introduction of a Smart Connected Insulin Pen > Discussion
plain- Asserted: passes — The authors put it forward as true.
- Checkable: passes — It can be checked against evidence.
- Load-bearing: unclear — It is unclear whether the paper’s conclusions depend on it.
- Based: passes — The paper gives a reason why it holds.
It may state two separate claims as one.
- The authors state this as an assumption: Participants have three main meals per day on average.
What the paper did — it cites no source for this, so there is none to check. The quote shows it is in the paper.
In the paper
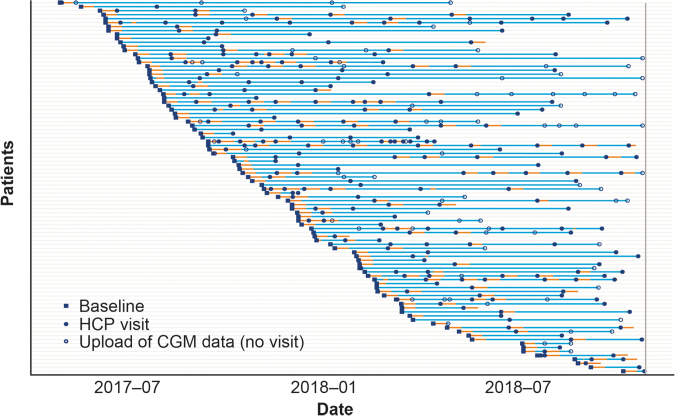
“The number of participants with data at visits 1, 2, 3, and 4 was 57, 30, 21, and 15, respectively.”
§ Increased Time in Range and Fewer Missed Bolus Injections After Introduction of a Smart Connected Insulin Pen > Results > Glycemic summary measures and insulin dosing
plain- Asserted: passes — The authors put it forward as true.
- Checkable: passes — It can be checked against evidence.
- Load-bearing: fails — The paper’s conclusions may not depend on it.
- Based: passes — The paper gives a reason why it holds.
Probably not a substantial claim. The paper’s conclusions may not depend on it.
What the paper did — it cites no source for this, so there is none to check. The quote shows it is in the paper.
In the paper
“A significance level of P < 0.05 was predefined for all statistical comparisons.”
§ Increased Time in Range and Fewer Missed Bolus Injections After Introduction of a Smart Connected Insulin Pen > Methods > Statistical analyses
plain- Asserted: passes — The authors put it forward as true.
- Checkable: passes — It can be checked against evidence.
- Load-bearing: passes — The paper’s conclusions depend on it.
- Based: passes — The paper gives a reason why it holds.
Probably not a substantial claim.
None of the sources cited for this claim have been checked yet.
In the paper
“Reductions in HbA1c have been reported with CGM use in people on multiple daily injection (MDI) therapy,19 and continuous subcutaneous insulin infusion therapy,20 with reduced time spent in hypoglycemia,20 and improved hypoglycemia awareness.21”
§ Increased Time in Range and Fewer Missed Bolus Injections After Introduction of a Smart Connected Insulin Pen > Introduction
What the sources say
- Not checked yetcites [19] Lind M, Polonsky W, Hirsch IB, et al.: Continuous glucose monitoring vs conventional therapy for glycemic control in adults with type 1 diabetes treated with multiple daily insulin injections: the GOLD randomized clinical trial. JAMA 2017; 317: 379– 387 28118454 source
- Not checked yetcites [20] Battelino T, Conget I, Olsen B, et al.: The use and efficacy of continuous glucose monitoring in type 1 diabetes treated with insulin pump therapy: a randomised controlled trial. Diabetologia 2012; 55: 3155– 3162 22965294 PMC3483098 source
- Not checked yetcites [21] Heinemann L, Freckmann G, Ehrmann D, et al.: Real-time continuous glucose monitoring in adults with type 1 diabetes and impaired hypoglycaemia awareness or severe hypoglycaemia treated with multiple daily insulin injections (HypoDE): a multicentre, randomised controlled trial. Lancet 2018; 391: 1367– 1377 29459019 source
plaindirect- Asserted: passes — The authors put it forward as true.
- Checkable: passes — It can be checked against evidence.
- Load-bearing: fails — The paper’s conclusions may not depend on it.
- Based: passes — The paper gives a reason why it holds.
Probably not a substantial claim. The paper’s conclusions may not depend on it. It may state two separate claims as one.
In the paper
“The recent Advanced Technologies & Treatments for Diabetes Congress consensus recommendations suggest that an approximate 5% increase in TIR is associated with clinically significant benefits.27”
§ Increased Time in Range and Fewer Missed Bolus Injections After Introduction of a Smart Connected Insulin Pen > Discussion
What the sources say
- Not checked yetcites [27] Battelino T, Danne T, Bergenstal RM, et al.: Clinical targets for continuous glucose monitoring data interpretation: recommendations from the international consensus on time in range. Diabetes Care 2019; 42: 1593– 1603 31177185 PMC6973648 source
hedgedcorrelational- Asserted: passes — The authors put it forward as true.
- Checkable: passes — It can be checked against evidence.
- Load-bearing: passes — The paper’s conclusions depend on it.
- Based: passes — The paper gives a reason why it holds.
Probably not a substantial claim.
What the paper did — it cites no source for this, so there is none to check. The quote shows it is in the paper.
In the paper
“Participants were blinded to the injection data overview during the baseline period (baseline until visit 1; Fig. 1).”
§ Increased Time in Range and Fewer Missed Bolus Injections After Introduction of a Smart Connected Insulin Pen > Methods > Study design and participants
plain- Asserted: passes — The authors put it forward as true.
- Checkable: passes — It can be checked against evidence.
- Load-bearing: passes — The paper’s conclusions depend on it.
- Based: passes — The paper gives a reason why it holds.
Probably not a substantial claim.
What the paper did — it cites no source for this, so there is none to check. The quote shows it is in the paper.
In the paper
“There was no indication of a relationship between baseline parameters (age, glycemic control, or insulin dose) and study duration or visit frequency.”
§ Increased Time in Range and Fewer Missed Bolus Injections After Introduction of a Smart Connected Insulin Pen > Results > Study population
hedged- Asserted: passes — The authors put it forward as true.
- Checkable: passes — It can be checked against evidence.
- Load-bearing: fails — The paper’s conclusions may not depend on it.
- Based: passes — The paper gives a reason why it holds.
Probably not a substantial claim. The paper’s conclusions may not depend on it.
What the paper did — it cites no source for this, so there is none to check. The quote shows it is in the paper.
In the paper
“All statistical models were verified based on residual plots (not shown).”
§ Increased Time in Range and Fewer Missed Bolus Injections After Introduction of a Smart Connected Insulin Pen > Methods > Statistical analyses
plain- Asserted: passes — The authors put it forward as true.
- Checkable: passes — It can be checked against evidence.
- Load-bearing: fails — The paper’s conclusions may not depend on it.
- Based: passes — The paper gives a reason why it holds.
Probably not a substantial claim. The paper’s conclusions may not depend on it.
None of the sources cited for this claim have been checked yet.
In the paper
“The key benefits of CGM include real-time data monitoring for people with T1D and access for them and their HCPs to complete glucose datasets17; both of which help people to achieve their target time spent within the acceptable range (time in range [TIR]: 3.9–10.0 mmol/L [70–180 mg/dL]) and avoid hyper- and hypoglycemia.18”
§ Increased Time in Range and Fewer Missed Bolus Injections After Introduction of a Smart Connected Insulin Pen > Introduction
What the sources say
- Not checked yetcites [17] Slattery D, Choudhary P: Clinical use of continuous glucose monitoring in adults with type 1 diabetes. Diabetes Technol Ther 2017; 19(Suppl 2): S55– S61 28541131 PMC5444504 source
- Not checked yetcites [18] Bergenstal RM, Ahmann AJ, Bailey T, et al.: Recommendations for standardizing glucose reporting and analysis to optimize clinical decision making in diabetes: the Ambulatory Glucose Profile (AGP). Diabetes Technol Ther 2013; 15: 198– 211 23448694 source
plaindirect- Asserted: passes — The authors put it forward as true.
- Checkable: passes — It can be checked against evidence.
- Load-bearing: fails — The paper’s conclusions may not depend on it.
- Based: passes — The paper gives a reason why it holds.
Probably not a substantial claim. The paper’s conclusions may not depend on it. It may state two separate claims as one.
What the paper did — it cites no source for this, so there is none to check. The quote shows it is in the paper.
In the paper
“Robustness with respect to the choice of follow-up period was evaluated by estimating the change from baseline for each single visit.”
- Also stated in: § Statistical analyses · plain
“Robustness with respect to the choice of follow-up period was evaluated by estimating the change from baseline for every visit.”
§ Increased Time in Range and Fewer Missed Bolus Injections After Introduction of a Smart Connected Insulin Pen > Methods > Statistical analyses
plainn = 81- Asserted: passes — The authors put it forward as true.
- Checkable: passes — It can be checked against evidence.
- Load-bearing: fails — The paper’s conclusions may not depend on it.
- Based: passes — The paper gives a reason why it holds.
Probably not a substantial claim. The paper’s conclusions may not depend on it. It may state two separate claims as one.
- Also stated in: § Statistical analyses · plain
What the paper did — it cites no source for this, so there is none to check. The quote shows it is in the paper.
In the paper
“Of the final cohort of 94 participants, 14 made ≥5 visits to a HCP (Supplementary Fig. S1).”
§ Increased Time in Range and Fewer Missed Bolus Injections After Introduction of a Smart Connected Insulin Pen > Results > Glycemic summary measures and insulin dosing
plainn = 94- Asserted: passes — The authors put it forward as true.
- Checkable: passes — It can be checked against evidence.
- Load-bearing: fails — The paper’s conclusions may not depend on it.
- Based: passes — The paper gives a reason why it holds.
Probably not a substantial claim. The paper’s conclusions may not depend on it.
In the paper
“A previous study has demonstrated that improvements in glycemic control and glycemic variability were associated with an increased frequency of blood glucose testing and administration of bolus insulin.30”
§ Increased Time in Range and Fewer Missed Bolus Injections After Introduction of a Smart Connected Insulin Pen > Discussion
What the sources say
- Not checked yetcites [30] Pfutzner A, Weissmann J, Mougiakakou S, et al.: Glycemic variability is associated with frequency of blood glucose testing and bolus: post hoc analysis results from the ProAct study. Diabetes Technol Ther 2015; 17: 392– 397 25734860 PMC4432784 source
boostedcorrelational- Asserted: passes — The authors put it forward as true.
- Checkable: passes — It can be checked against evidence.
- Load-bearing: fails — The paper’s conclusions may not depend on it.
- Based: passes — The paper gives a reason why it holds.
Probably not a substantial claim. The paper’s conclusions may not depend on it.
A conclusion the paper draws from its own results — it cites no other source for it, so there is none to check. The quote shows it is in the paper.
In the paper
“Therefore, even small improvements in TIR can yield corresponding improvements in HbA1c, and result in clinically significant benefits.”
§ Increased Time in Range and Fewer Missed Bolus Injections After Introduction of a Smart Connected Insulin Pen > Discussion
plaindirect- Asserted: passes — The authors put it forward as true.
- Checkable: passes — It can be checked against evidence.
- Load-bearing: passes — The paper’s conclusions depend on it.
- Based: passes — The paper gives a reason why it holds.
It may state two separate claims as one.
What the paper did — it cites no source for this, so there is none to check. The quote shows it is in the paper.
In the paper
“The number of participants achieving ≥5 visits was 10.”
§ Increased Time in Range and Fewer Missed Bolus Injections After Introduction of a Smart Connected Insulin Pen > Methods > Statistical analyses
plain- Asserted: passes — The authors put it forward as true.
- Checkable: passes — It can be checked against evidence.
- Load-bearing: fails — The paper’s conclusions may not depend on it.
- Based: passes — The paper gives a reason why it holds.
Probably not a substantial claim. The paper’s conclusions may not depend on it.
A conclusion the paper draws from its own results — it cites no other source for it, so there is none to check. The quote shows it is in the paper.
In the paper
“The finding of only a small, nonsignificant, increase in basal dose may be due to relatively few participants in the study using connected pens for their basal insulin.”
§ Increased Time in Range and Fewer Missed Bolus Injections After Introduction of a Smart Connected Insulin Pen > Discussion
hedgedconditional- Asserted: passes — The authors put it forward as true.
- Checkable: passes — It can be checked against evidence.
- Load-bearing: fails — The paper’s conclusions may not depend on it.
- Based: fails — The paper may give no reason why it holds.
Probably not a substantial claim. The paper’s conclusions may not depend on it. The paper may give no reason why it holds.
A conclusion the paper draws from its own results — it cites no other source for it, so there is none to check. The quote shows it is in the paper.
In the paper
“Nonetheless, our findings suggest that connected pens such as the NovoPen® 6 have the potential to improve glycemic control, decrease glucose variability and increase treatment concordance in people with T1D, addressing the large unmet need for optimal insulin treatment.”
§ Increased Time in Range and Fewer Missed Bolus Injections After Introduction of a Smart Connected Insulin Pen > Discussion
hedgedconditionaln = 14- Asserted: passes — The authors put it forward as true.
- Checkable: passes — It can be checked against evidence.
- Load-bearing: passes — The paper’s conclusions depend on it.
- Based: passes — The paper gives a reason why it holds.
It may state two separate claims as one.
None of the sources cited for this claim have been checked yet.
In the paper
“Many people treated with insulin fail to reach their glycemic targets, which is known to increase the risk of microvascular and macrovascular complications, resulting in substantial morbidity and mortality.13,14,24”
§ Increased Time in Range and Fewer Missed Bolus Injections After Introduction of a Smart Connected Insulin Pen > Discussion
What the sources say
- Not checked yetcites [13] Nathan DM, Genuth S, Lachin J, et al.: The effect of intensive treatment of diabetes on the development and progression of long-term complications in insulin-dependent diabetes mellitus. N Engl J Med 1993; 329: 977– 986 8366922 source
- Not checked yetcites [14] Nathan DM, Cleary PA, Backlund JY, et al.: Intensive diabetes treatment and cardiovascular disease in patients with type 1 diabetes. N Engl J Med 2005; 353: 2643– 2653 16371630 PMC2637991 source
- Not checked yetcites [24] Bailey TS, Stone JY: A novel pen-based Bluetooth-enabled insulin delivery system with insulin dose tracking and advice. Expert Opin Drug Deliv 2017; 14: 697– 703 28359171 source
boosteddirect- Asserted: passes — The authors put it forward as true.
- Checkable: passes — It can be checked against evidence.
- Load-bearing: fails — The paper’s conclusions may not depend on it.
- Based: passes — The paper gives a reason why it holds.
Probably not a substantial claim. The paper’s conclusions may not depend on it. It may state two separate claims as one.
A conclusion the paper draws from its own results — it cites no other source for it, so there is none to check. The quote shows it is in the paper.
In the paper
“This suggests that evaluating past dosing data together with HCPs may have helped participants to remember and administer their meal-time doses, or to improve the timing of the dose relative to the meal.”
§ Increased Time in Range and Fewer Missed Bolus Injections After Introduction of a Smart Connected Insulin Pen > Discussion
hedgedconditional- Asserted: passes — The authors put it forward as true.
- Checkable: passes — It can be checked against evidence.
- Load-bearing: passes — The paper’s conclusions depend on it.
- Based: passes — The paper gives a reason why it holds.
It may state two separate claims as one.
In the paper
“Supporting people to engage with and optimize their insulin regimens is a key challenge for HCPs, with educational interventions having limited effects.38”
§ Increased Time in Range and Fewer Missed Bolus Injections After Introduction of a Smart Connected Insulin Pen > Discussion
What the sources say
- Not checked yetcites [38] Doggrell SA, Chan V: Adherence to insulin treatment in diabetes: can it be improved? J Diabetes 2015; 7: 315– 321 25195971 source
plain- Asserted: passes — The authors put it forward as true.
- Checkable: passes — It can be checked against evidence.
- Load-bearing: fails — The paper’s conclusions may not depend on it.
- Based: passes — The paper gives a reason why it holds.
Probably not a substantial claim. The paper’s conclusions may not depend on it. It may state two separate claims as one.
A conclusion the paper draws from its own results — it cites no other source for it, so there is none to check. The quote shows it is in the paper.
In the paper
“Our findings indicate that a connected pen may help people to reduce the number of missed bolus injections and to properly adjust doses, thus leading to better glycemic control.”
§ Increased Time in Range and Fewer Missed Bolus Injections After Introduction of a Smart Connected Insulin Pen > Discussion
hedgedconditional- Asserted: passes — The authors put it forward as true.
- Checkable: passes — It can be checked against evidence.
- Load-bearing: passes — The paper’s conclusions depend on it.
- Based: passes — The paper gives a reason why it holds.
It may state two separate claims as one.
What the paper did — it cites no source for this, so there is none to check. The quote shows it is in the paper.
In the paper
“Since visits were conducted according to local clinical practice, the time in study, number of HCP visits, and time between visits varied considerably between participants.”
§ Increased Time in Range and Fewer Missed Bolus Injections After Introduction of a Smart Connected Insulin Pen > Discussion
plaindirect- Asserted: passes — The authors put it forward as true.
- Checkable: passes — It can be checked against evidence.
- Load-bearing: fails — The paper’s conclusions may not depend on it.
- Based: passes — The paper gives a reason why it holds.
Probably not a substantial claim. The paper’s conclusions may not depend on it.
What the paper did — it cites no source for this, so there is none to check. The quote shows it is in the paper.
In the paper
“As this was a short single-arm study, we cannot conclude with certainty that the use of a connected pen directly improved glycemic control, and other factors may have played a role.”
§ Increased Time in Range and Fewer Missed Bolus Injections After Introduction of a Smart Connected Insulin Pen > Discussion
hedged- Asserted: passes — The authors put it forward as true.
- Checkable: passes — It can be checked against evidence.
- Load-bearing: passes — The paper’s conclusions depend on it.
- Based: passes — The paper gives a reason why it holds.
It may state two separate claims as one.
None of the sources cited for this claim have been checked yet.
In the paper
“As measurements of HbA1c do not reflect glycemic variability and target HbA1c values may be achieved while still experiencing marked daily glycemic fluctuations, people with T1D may regard reducing glucose variability and improving TIR to be as important as achieving their target HbA1c value.36,37”
§ Increased Time in Range and Fewer Missed Bolus Injections After Introduction of a Smart Connected Insulin Pen > Discussion
What the sources say
- Not checked yetcites [36] Dandona P: Minimizing glycemic fluctuations in patients with type 2 diabetes: approaches and importance. Diabetes Technol Ther 2017; 19: 498– 506 28771387 PMC5647495 source
- Not checked yetcites [37] Runge AS, Kennedy L, Brown AS, et al.: Does time-in-range matter? Perspectives from people with diabetes on the success of current therapies and the drivers of improved outcomes. Clin Diabetes 2018; 36: 112– 119 29686449 PMC5898169 source
hedged- Asserted: passes — The authors put it forward as true.
- Checkable: fails — It may be too vague to check against evidence.
- Load-bearing: fails — The paper’s conclusions may not depend on it.
- Based: passes — The paper gives a reason why it holds.
Probably not a substantial claim. It may be too vague to check against evidence. The paper’s conclusions may not depend on it.
In the paper
“A recent study observed that the rate of late or missed bolus injections was 27% in people using MDI therapy, and that missed bolus injections correlated with higher HbA1c levels.40”
§ Increased Time in Range and Fewer Missed Bolus Injections After Introduction of a Smart Connected Insulin Pen > Discussion
What the sources say
- Not checked yetcites [40] Norlander LM, Anderson SA, Levy CJ, et al.: Late and missed meal boluses with multiple daily insulin injections. Diabetes 2018; 68(Suppl 1): A259
plaincorrelational- Asserted: passes — The authors put it forward as true.
- Checkable: passes — It can be checked against evidence.
- Load-bearing: fails — The paper’s conclusions may not depend on it.
- Based: passes — The paper gives a reason why it holds.
Probably not a substantial claim. The paper’s conclusions may not depend on it. It may state two separate claims as one.
None of the sources cited for this claim have been checked yet.
In the paper
“Other studies have demonstrated that fluctuations in blood glucose levels may contribute more to outcomes than constant high blood glucose concentrations.31–35”
§ Increased Time in Range and Fewer Missed Bolus Injections After Introduction of a Smart Connected Insulin Pen > Discussion
What the sources say
- Not checked yetcites [31] Ceriello A, Esposito K, Piconi L, et al.: Oscillating glucose is more deleterious to endothelial function and oxidative stress than mean glucose in normal and type 2 diabetic patients. Diabetes 2008; 57: 1349– 1354 18299315 source
- Not checked yetcites [32] Esposito K, Nappo F, Marfella R, et al.: Inflammatory cytokine concentrations are acutely increased by hyperglycemia in humans: role of oxidative stress. Circulation 2002; 106: 2067– 2072 12379575 source
- Not checked yetcites [33] Hirakawa Y, Arima H, Zoungas S, et al.: Impact of visit-to-visit glycemic variability on the risks of macrovascular and microvascular events and all-cause mortality in type 2 diabetes: the ADVANCE trial. Diabetes Care 2014; 37: 2359– 2365 24812434 source
- Not checked yetcites [34] Ceriello A, Kilpatrick ES: Glycemic variability: both sides of the story. Diabetes Care 2013; 36(Suppl 2): S272– S275 23882058 PMC3920802 source
- Not checked yetcites [35] Sartore G, Chilelli NC, Burlina S, et al.: The importance of HbA1c and glucose variability in patients with type 1 and type 2 diabetes: outcome of continuous glucose monitoring (CGM). Acta Diabetol 2012; 49(Suppl 1): S153– S160 22466072 source
hedgedconditional- Asserted: passes — The authors put it forward as true.
- Checkable: passes — It can be checked against evidence.
- Load-bearing: fails — The paper’s conclusions may not depend on it.
- Based: passes — The paper gives a reason why it holds.
Probably not a substantial claim. The paper’s conclusions may not depend on it.
None of the sources cited for this claim have been checked yet.
In the paper
“Previous studies have identified that an engaging and open dialogue between HCPs and people with T1D is highly important for optimal disease management, as it promotes collaboration, communication, and people's participation in their own treatment decisions.25,26”
§ Increased Time in Range and Fewer Missed Bolus Injections After Introduction of a Smart Connected Insulin Pen > Discussion
What the sources say
- Not checked yetcites [25] Heisler M, Bouknight RR, Hayward RA, et al.: The relative importance of physician communication, participatory decision making, and patient understanding in diabetes self-management. J Gen Intern Med 2002; 17: 243– 252 11972720 PMC1495033 source
- Not checked yetcites [26] Ritholz MD, Beverly EA, Brooks KM, et al.: Barriers and facilitators to self-care communication during medical appointments in the United States for adults with type 2 diabetes. Chronic Illn 2014; 10: 303– 313 24567195 PMC4157962 source
plaindirect- Asserted: passes — The authors put it forward as true.
- Checkable: fails — It may be too vague to check against evidence.
- Load-bearing: fails — The paper’s conclusions may not depend on it.
- Based: passes — The paper gives a reason why it holds.
Probably not a substantial claim. It may be too vague to check against evidence. The paper’s conclusions may not depend on it.
What the paper did — it cites no source for this, so there is none to check. The quote shows it is in the paper.
In the paper
“For the TIR analysis, only 14 participants had data from visit 5 onward (Supplementary Fig. S1), meaning that the estimated change is based on the data from these, while the remaining data are used to estimate the random variation between participants, visits, and days and thus contribute to degrees of freedom in the variance estimates.”
§ Increased Time in Range and Fewer Missed Bolus Injections After Introduction of a Smart Connected Insulin Pen > Discussion
plainn = 14- Asserted: passes — The authors put it forward as true.
- Checkable: passes — It can be checked against evidence.
- Load-bearing: passes — The paper’s conclusions depend on it.
- Based: passes — The paper gives a reason why it holds.
Probably not a substantial claim. It may state two separate claims as one.
In the paper
“Furthermore, as data were unbalanced, the use of a linear mixed model with different levels of correlations was necessary.42 This allowed all data to be used, and by including participant as a random effect, it ensured that each participant had their own baseline level, and the estimated change from baseline to visit 5 can be interpreted as the mean change from this level.”
§ Increased Time in Range and Fewer Missed Bolus Injections After Introduction of a Smart Connected Insulin Pen > Discussion
What the sources say
- Not checked yetcites [42] Harrison XA, Donaldson L, Correa-Cano ME, et al.: A brief introduction to mixed effects modelling and multi-model inference in ecology. PeerJ 2018; 6: e4794 29844961 PMC5970551 source
plainn = 14- Asserted: passes — The authors put it forward as true.
- Checkable: passes — It can be checked against evidence.
- Load-bearing: passes — The paper’s conclusions depend on it.
- Based: passes — The paper gives a reason why it holds.
Probably not a substantial claim. It may state two separate claims as one.
None of the sources cited for this claim have been checked yet.
In the paper
“Studies have found significant correlations between HbA1c levels and the number of missing bolus injections.7,39”
§ Increased Time in Range and Fewer Missed Bolus Injections After Introduction of a Smart Connected Insulin Pen > Discussion
What the sources say
- Not checked yetcites [7] Randlov J, Poulsen JU: How much do forgotten insulin injections matter to hemoglobin a1c in people with diabetes? A simulation study. J Diabetes Sci Technol 2008; 2: 229– 235 19885347 PMC2771482 source
- Not checked yetcites [39] Burdick J, Chase HP, Slover RH, et al.: Missed insulin meal boluses and elevated hemoglobin A1c levels in children receiving insulin pump therapy. Pediatrics 2004; 113(Pt 1): e221– e224 14993580 source
plaincorrelational- Asserted: passes — The authors put it forward as true.
- Checkable: passes — It can be checked against evidence.
- Load-bearing: fails — The paper’s conclusions may not depend on it.
- Based: passes — The paper gives a reason why it holds.
Probably not a substantial claim. The paper’s conclusions may not depend on it.
In the paper
“In addition, the visit frequency for most participants seemed to be higher than what would be expected in normal clinical practice.41”
§ Increased Time in Range and Fewer Missed Bolus Injections After Introduction of a Smart Connected Insulin Pen > Discussion
What the sources say
- Not checked yetcites [41] Kavanos P, Van den Aardweg S, Schurer W: Diabetes expenditure, burden of disease and management in 5 EU countries. www.lse.ac.uk/business-and-consultancy/consulting/assets/documents/diabetes-expenditure-burden-of-disease-and-management-in-5-eu-countries.pdf (accessed 12 2020)
hedged- Asserted: passes — The authors put it forward as true.
- Checkable: passes — It can be checked against evidence.
- Load-bearing: fails — The paper’s conclusions may not depend on it.
- Based: passes — The paper gives a reason why it holds.
Probably not a substantial claim. The paper’s conclusions may not depend on it.
What the paper did — it cites no source for this, so there is none to check. The quote shows it is in the paper.
In the paper
“There was limited access to background participant information within the dataset, such as diabetes status and comorbidities.”
§ Increased Time in Range and Fewer Missed Bolus Injections After Introduction of a Smart Connected Insulin Pen > Discussion
plain- Asserted: passes — The authors put it forward as true.
- Checkable: passes — It can be checked against evidence.
- Load-bearing: fails — The paper’s conclusions may not depend on it.
- Based: passes — The paper gives a reason why it holds.
Probably not a substantial claim. The paper’s conclusions may not depend on it.
What the paper did — it cites no source for this, so there is none to check. The quote shows it is in the paper.
In the paper
“Many participant IDs (65%) were excluded from the analyses during data cleaning.”
§ Increased Time in Range and Fewer Missed Bolus Injections After Introduction of a Smart Connected Insulin Pen > Discussion
plain- Asserted: passes — The authors put it forward as true.
- Checkable: passes — It can be checked against evidence.
- Load-bearing: passes — The paper’s conclusions depend on it.
- Based: passes — The paper gives a reason why it holds.
Probably not a substantial claim.
The authors state this as an assumption.
Participants had three main meals per day.
“based on the assumption that participants had three main meals per day.”
The authors state this as an assumption.
Participants have three main meals per day on average.
“Based on the assumption that participants have three main meals per day”
“Assuming three meals per day on average.”
Claims other papers make about this one
Each is checked against this paper’s own text: does it say what the citing paper says it does?
The source backs part of the claim, not all of it — or backs it for a different population, condition or comparison.
In the citing paper
“Research from individuals using MDI therapy with CGM and connected insulin pen or cap devices revealed that missed, mistimed, and mismatched insulin bolus doses are common and occur in both older and younger populations with T1D or T2D, and are associated with higher A1C.13–18”
From Shining the Spotlight on Multiple Daily Insulin Therapy: Real-World Evidence of the InPen Smart Insulin Pen (2024) · cites this paper as [13]
Experimental — accuracy not yet measuredThe source backs part of the claim, not all of it — or backs it for a different population, condition or comparison.
In the citing paper
“In a prospective, observational trial of 94 participants with T1D, the use of a connected insulin pen with CGM resulted in significant improvements in glycemia and a significant decrease in missed doses.13”
From Shining the Spotlight on Multiple Daily Insulin Therapy: Real-World Evidence of the InPen Smart Insulin Pen (2024) · cites this paper as [13]
Experimental — accuracy not yet measured
Citations
Cites
(1993) · New England Journal of Medicine · doi:10.1056/nejm199309303291401 · Cited by 24,667
Intensive diabetes treatment and cardiovascular disease in patients with type 1 diabetes
(2005) · New England Journal of Medicine · doi:10.1056/nejmoa052187 · Cited by 5,138
Battelino, T., Danne, T., Bergenstal, R. M., Amiel, S. A., Beck, R., Biester, T., Bosi, E., Buckingham, B. A., Cefalu, W. T., Close, K. L., et al. (2019) · Diabetes Care · doi:10.2337/dci19-0028 · Cited by 4,237 · cited 1×
“The recent Advanced Technologies & Treatments for Diabetes Congress consensus recommendations suggest that an approximate 5% increase in TIR is associated with clinically significant benefits.(27) Two analyses found that an increase in TIR of 10% corresponded to a decrease in HbA1c of approximately 0.”
BackgroundA brief introduction to mixed effects modelling and multi-model inference in ecology
Harrison, X. A., Donaldson, L., Correa-Cano, M. E., Evans, J., Fisher, D. N., Goodwin, C. E. D., Robinson, B. S., Hodgson, D. J., & Inger, R. (2018) · PeerJ · doi:10.7717/peerj.4794 · Cited by 2,094
International consensus on use of continuous glucose monitoring
Danne, T., Nimri, R., Battelino, T., Bergenstal, R. M., Close, K. L., DeVries, J. H., Garg, S., Heinemann, L., Hirsch, I., Amiel, S. A., et al. (2017) · Diabetes Care · doi:10.2337/dc17-1600 · Cited by 2,069
Esposito, K., Nappo, F., Marfella, R., Giugliano, G., Giugliano, F., Ciotola, M., Quagliaro, L., Ceriello, A., & Giugliano, D. (2002) · Circulation · doi:10.1161/01.cir.0000034509.14906.ae · Cited by 1,961
Ceriello, A., Esposito, K., Piconi, L., Ihnat, M. A., Thorpe, J. E., Testa, R., Boemi, M., & Giugliano, D. (2008) · Diabetes · doi:10.2337/db08-0063 · Cited by 1,310
Miller, K. M., Foster, N. C., Beck, R. W., Bergenstal, R. M., DuBose, S. N., DiMeglio, L. A., Maahs, D. M., & Tamborlane, W. V. (2015) · Diabetes Care · doi:10.2337/dc15-0078 · Cited by 1,254 · cited 1×
“CGM, including isCGM (hereafter, unless stated, CGM includes both rtCGM and isCGM), is being used by an increasing number of people with type 1 diabetes (T1D).(15,16) The key benefits of CGM include real‐time data monitoring for people with T1D and access for them and their HCPs to complete glucose datasets;(17) both…”
MethodA systematic review of adherence with medications for diabetes
Cramer, J. A. (2004) · Diabetes Care · doi:10.2337/diacare.27.5.1218 · Cited by 1,203
Heisler, M., Bouknight, R. R., Hayward, R. A., Smith, D. M., & Kerr, E. A. (2002) · Journal of General Internal Medicine · doi:10.1046/j.1525-1497.2002.10905.x · Cited by 717
Research works printed but not linked: 1
- Norlander LM, , Anderson SA, , Levy CJ, et al.: Late and missed meal boluses with multiple daily insulin injections. Diabetes, 2018; 68(Suppl 1):A259.
Cited by
Sorted by citations
Blonde, L., Umpierrez, G. E., Reddy, S. S., McGill, J. B., Berga, S. L., Bush, M., Chandrasekaran, S., DeFronzo, R. A., Einhorn, D., Galindo, R. J., et al. (2022) · Endocrine Practice · doi:10.1016/j.eprac.2022.08.002 · Cited by 507
Managing New-Onset Type 1 Diabetes During the COVID-19 Pandemic: Challenges and Opportunities
Garg, S. K., Rodbard, D., Hirsch, I. B., & Forlenza, G. P. (2020) · Diabetes Technology & Therapeutics · doi:10.1089/dia.2020.0161 · Cited by 156
The competitive athlete with type 1 diabetes
Riddell, M. C., Scott, S. N., Fournier, P. A., Colberg, S. R., GALLEN, I. W., Moser, O., Stettler, C., Yardley, J. E., Zaharieva, D. P., Adolfsson, P., et al. (2020) · Diabetologia · doi:10.1007/s00125-020-05183-8 · Cited by 110
Self-citationTechnology in the management of type 2 diabetes: Present status and future prospects
DALY, A. B., & Hovorka, R. (2021) · Diabetes Obesity and Metabolism · doi:10.1111/dom.14418 · Cited by 100
Yoo, J. H., & Kim, J. H. (2023) · Diabetes & Metabolism Journal · doi:10.4093/dmj.2022.0271 · Cited by 96
Metadata
- Authors
- Adolfsson, P., Hartvig, N. V., Kaas, A., Møller, J. B., & Hellman, J.
- Affiliations
- Hallands sjukhus Kungsbacka (SE)
- Novo Nordisk (Denmark) (DK)
- Uppsala University (SE)
- Corresponding author
- Adolfsson, Peter
- Venue
- Diabetes Technology & Therapeutics
- Publisher
- SAGE Publications
- Published
- 2020-10
- Volume
- 22
- Issue
- 10
- Pages
- 709-718
- ISSN
- 1520-9156 (ISSN-L)
- 1557-8593
- PMC
- PMC7591375
- OpenAlex
- W3003592023
- Semantic Scholar
- 6bdf45f719045b751c9c17e89a31142159c144b4
- Cited by
- 139
- References
- 41
- Citations by year
- 2026: 21 · 2025: 29 · 2024: 20 · 2023: 23 · 2022: 21 · 2021: 17 · 2020: 8
- FWCI
- 13.01
- Type
- journal article
- Language
- en
- Open access
- hybrid
- doi.org
- Licence
- Locations
- Diabetes Technology & Therapeutics (publishedVersion, cc-by)
- PubMed Central (publishedVersion, cc-by)
- PubMed (publishedVersion)
- Uppsala University Publications (Uppsala University) (submittedVersion, other-oa)
- Funders
- Novo Nordisk
- Topics
- Health Sciences › Medicine › Endocrinology, Diabetes and Metabolism › Diabetes Management and Research
- Health Sciences › Medicine › Endocrinology, Diabetes and Metabolism › Diabetes Management and Education
- Health Sciences › Medicine › Endocrinology, Diabetes and Metabolism › Diabetes Treatment and Management
- Keywords
- type 1 diabetes, smart insulin pens, connected insulin pens, time in range, multiple daily insulin injections, glycemic control, hypoglycemia, hyperglycemia, continuous glucose monitoring
- MeSH terms
- Blood Glucose, Diabetes Mellitus, Type 1, Humans, Hypoglycemic Agents, Injections, Subcutaneous, Insulin, Sweden, Blood Glucose Self-Monitoring
About these checks
Registry, retraction, Cites and statistics results are computed, not judged, with one exception: a printed reference that no index lists is read once by a model before it counts as a citation error. Claims are extracted by a model and kept only when their quote appears verbatim in the text; each cited source is then checked, with a model’s help, for whether it says what the claim relies on. Those verdicts can be wrong — read the claim’s quote and the cited source before relying on one.
A language model drew the claims from the paper on 2026-10-09, under version 3 of the claim definition (model deepseek-v4.1-flash, prompt extract-v3).
A second model labelled each claim on 2026-10-09 (model jev-1.13-20260917, definition revision gold-guideline-v0.2).
Cited sources are checked with a language model’s help (gpt-6-sol).
Statistics and arithmetic are recomputed, not judged.
Confidence bands are shown only for fields calibrated on our annotated test set. None is calibrated yet, so no band is shown.
What counts as a claim ›How we measure confidence ›How we check this ›
Are you an author, or do you see a problem with this page? Request a review
