

The DOI matches its Crossref record; 18 of the 19 references it cites were found in a registry or an index.
Effect of read-mapping biases on detecting allele-specific expression from RNA-sequencing data.
Open accessAbstract
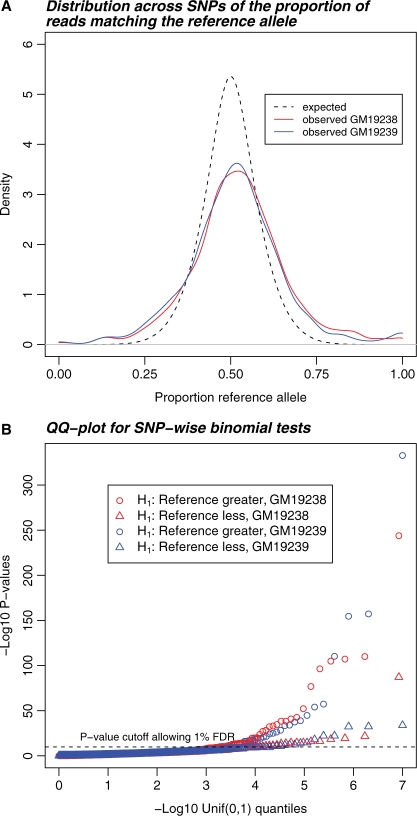
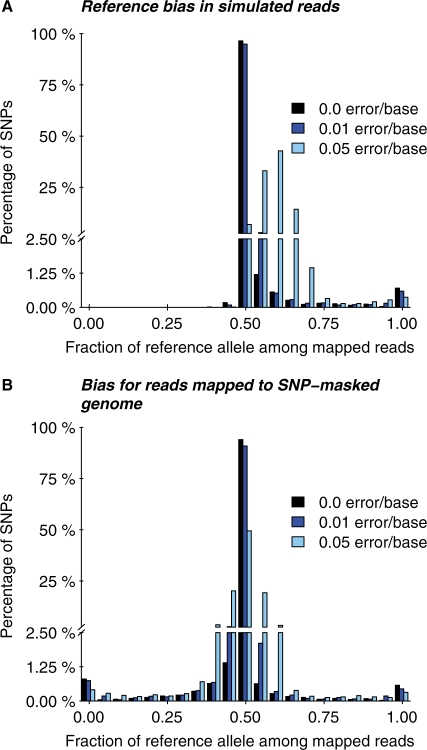
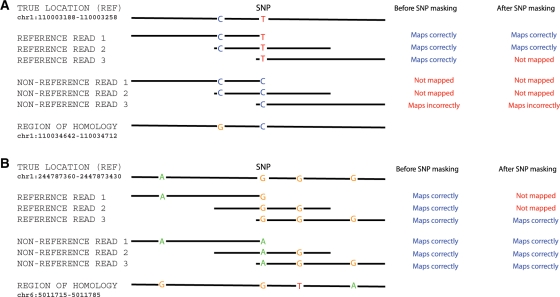
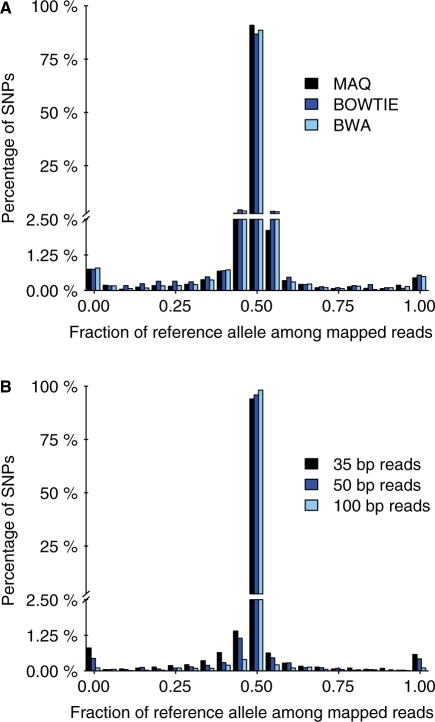
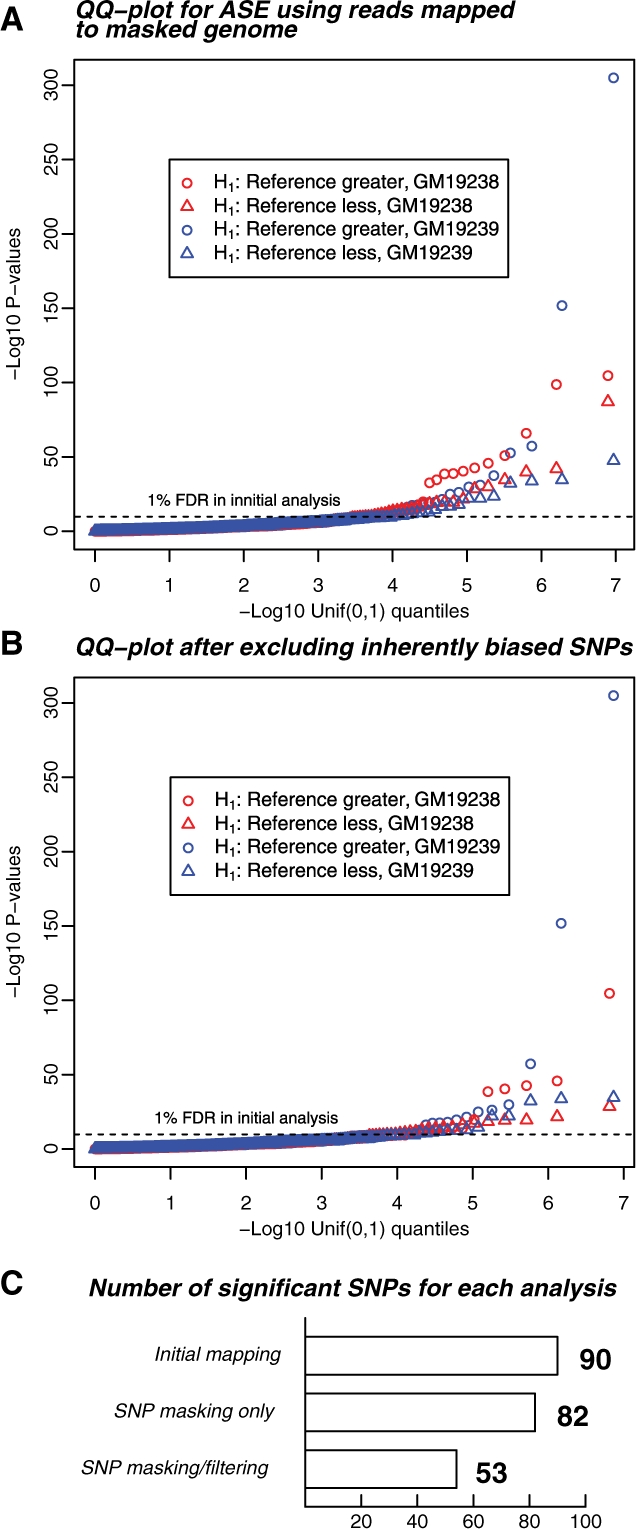
Motivation: Next-generation sequencing has become an important tool for genome-wide quantification of DNA and RNA. However, a major technical hurdle lies in the need to map short sequence reads back to their correct locations in a reference genome. Here, we investigate the impact of SNP variation on the reliability of read-mapping in the context of detecting allele-specific expression (ASE). Results: We generated 16 million 35 bp reads from mRNA of each of two HapMap Yoruba individuals. When we mapped these reads to the human genome we found that, at heterozygous SNPs, there was a significant bias toward higher mapping rates of the allele in the reference sequence, compared with the alternative allele. Masking known SNP positions in the genome sequence eliminated the reference bias but, surprisingly, did not lead to more reliable results overall. We find that even after masking, ∼5–10% of SNPs still have an inherent bias toward more effective mapping of one allele. Filtering out inherently biased SNPs removes 40% of the top signals of ASE. The remaining SNPs showing ASE are enriched in genes previously known to harbor cis-regulatory variation or known to show uniparental imprinting. Our results have implications for a variety of applications involving detection of alternate alleles from short-read sequence data. Availability: Scripts, written in Perl and R, for simulating short reads, masking SNP variation in a reference genome and analyzing the simulation output are available upon request from JFD. Raw short read data were deposited in GEO (http://www.ncbi.nlm.nih.gov/geo/) under accession number GSE18156. Contact: jdegner@uchicago.edu; marioni@uchicago.edu; gilad@uchicago.edu; pritch@uchicago.edu Supplementary information: Supplementary data are available at Bioinformatics online.
Overview
The claims and statistics of this paper haven’t been checked yet.
Run the check — free, no account needed. It reads the open-access text and checks the sources it cites.
Integrity signals
Registry
Cites
Statistics
Figures
Verification
Claims the paper makes
The claims and statistics of this paper haven’t been checked yet.
Run the check — free, no account needed. It reads the open-access text and checks the sources it cites.
Claims other papers make about this one
Each is checked against this paper’s own text: does it say what the citing paper says it does?
The cited source doesn’t support the claim as written.
In the citing paper
“Reads perfectly matching the reference genome were assigned to the reference allele, while reads with at least one difference from the reference genome were assigned to an alternative allele.”
From Sources of bias in measures of allele-specific expression derived from RNA-seq data aligned to a single reference genome (2013) · cites this paper as Degner et al. [14]
Checked by a reasoning model — may be wrong.
Experimental — accuracy not yet measuredThe source backs part of the claim, not all of it — or backs it for a different population, condition or comparison.
In the citing paper
“The rationale for N-masking in allele-specific alignments is that the mapping bias towards the reference allele is eliminated and both alleles of the same read get placed in the same position in the genome equally well.”
From SNPsplit: Allele-specific splitting of alignments between genomes with known SNP genotypes (2016) · cites this paper as [3]
Experimental — accuracy not yet measuredThe source backs part of the claim, not all of it — or backs it for a different population, condition or comparison.
In the citing paper
“Simulated datasets contained either ~10-fold or ~100-fold more differentiating sites than the human genotypes used to validate other methods for measuring relative ASE [14,18,20].”
From Sources of bias in measures of allele-specific expression derived from RNA-seq data aligned to a single reference genome (2013) · cites this paper as [14]
Experimental — accuracy not yet measuredThe source backs part of the claim, not all of it — or backs it for a different population, condition or comparison.
In the citing paper
“Controlling for sites known to be polymorphic in humans prior to aligning the simulated reads produced symmetrical measures of relative ASE, showing that the differentiating sites themselves caused this bias.”
From Sources of bias in measures of allele-specific expression derived from RNA-seq data aligned to a single reference genome (2013) · cites this paper as Degner et al. [14]
Experimental — accuracy not yet measuredThe cited source says what the claim attributes to it.
In the citing paper
“Genetic variants that distinguish individual genomes from the reference sequence can cause reads to be misaligned, resulting in biased estimates of transcript abundance.”
From RNA-Seq Alignment to Individualized Genomes Improves Transcript Abundance Estimates in Multiparent Populations (2014) · cites this paper as Degner et al. 2009
The cited source says what the claim attributes to it.
In the citing paper
“The alignment parameters they used allowed two or fewer bases within each read to differ from the reference genome.”
From Sources of bias in measures of allele-specific expression derived from RNA-seq data aligned to a single reference genome (2013) · cites this paper as Degner et al. [14]
The cited source says what the claim attributes to it.
In the citing paper
“a systematic bias occurs when reads from a heterozygous individual are aligned to a single reference genome [14].”
From Sources of bias in measures of allele-specific expression derived from RNA-seq data aligned to a single reference genome (2013) · cites this paper as [14]
The cited source says what the claim attributes to it.
In the citing paper
“Despite simulating an equal number of reads from each allele, a bias was observed causing reads to be assigned more often to the reference allele than the alternative allele.”
From Sources of bias in measures of allele-specific expression derived from RNA-seq data aligned to a single reference genome (2013) · cites this paper as Degner et al. [14]
The cited source says what the claim attributes to it.
In the citing paper
“Differences between alleles in sequences that appear more than once in the genome can also cause reads to be excluded for one allele but not the other [14].”
From Sources of bias in measures of allele-specific expression derived from RNA-seq data aligned to a single reference genome (2013) · cites this paper as [14]
The cited source says what the claim attributes to it.
In the citing paper
“relative ASE is systematically biased when sequence reads are aligned to a single reference genome”
From Sources of bias in measures of allele-specific expression derived from RNA-seq data aligned to a single reference genome (2013) · cites this paper as Degner et al. [14]
Self-check
Percentages, sums and reported differences re-computed from the paper’s own numbers.
The self-check needs the paper’s full text.
Citations
Cites
Fast and accurate short read alignment with Burrows-Wheeler transform
Li, H., & Durbin, R. (2009) · Bioinformatics · doi:10.1093/bioinformatics/btp324 · Cited by 58,607
Ultrafast and memory-efficient alignment of short DNA sequences to the human genome.
Langmead, B., Trapnell, C., Pop, M., & Salzberg, S. L. (2009) · Genome Biology · doi:10.1186/gb-2009-10-3-r25 · Cited by 21,849
A haplotype map of the human genome
The International HapMap Consortium (2005) · Nature · doi:10.1038/nature04226 · Cited by 5,858
Pruitt, K. D., Tatusova, T. A., & Maglott, D. R. (2006) · Nucleic Acids Research · doi:10.1093/nar/gkl842 · Cited by 4,441
A second generation human haplotype map of over 3.1 million SNPs
The International HapMap Consortium (2007) · Nature · doi:10.1038/nature06258 · Cited by 4,438
Mapping short DNA sequencing reads and calling variants using mapping quality scores
Li, H., Ruan, J., & Durbin, R. (2008) · Genome Research · doi:10.1101/gr.078212.108 · Cited by 2,638
Allelic Variation in Human Gene Expression
Yan, H., Yuan, W., Velculescu, V. E., Vogelstein, B., & Kinzler, K. W. (2002) · Science · doi:10.1126/science.1072545 · Cited by 625
High-Resolution Mapping of Expression-QTLs Yields Insight into Human Gene Regulation
Veyrieras, J.-B., Kudaravalli, S., Kim, S. Y., Dermitzakis, E. T., Gilad, Y., Stephens, M., & Pritchard, J. K. (2008) · PLoS Genetics · doi:10.1371/journal.pgen.1000214 · Cited by 536
Self-citationMinireview: GNAS: Normal and Abnormal Functions
Weinstein, L. S., Liu, J., Sakamoto, A., Xie, T., & Chen, M. (2004) · Endocrinology · doi:10.1210/en.2004-0865 · Cited by 327
Mechanisms of imprinting of the Prader-Willi/Angelman region
Horsthemke, B., & Wagstaff, J. (2008) · American Journal of Medical Genetics Part A · doi:10.1002/ajmg.a.32364 · Cited by 320
Cited by
Sorted by citations
Graph-based genome alignment and genotyping with HISAT2 and HISAT-genotype
Kim, D., Paggi, J. M., Park, C., Bennett, C., & Salzberg, S. L. (2019) · Nature Biotechnology · doi:10.1038/s41587-019-0201-4 · Cited by 15,022
McCarthy, D. J., Chen, Y., & Smyth, G. K. (2012) · Nucleic Acids Research · doi:10.1093/nar/gks042 · Cited by 5,195
Phased diploid genome assembly with single-molecule real-time sequencing
Chin, C.-S., Peluso, P. S., Sedlazeck, F. J., Nattestad, M., Concepcion, G. T., Clum, A., Dunn, C., O’Malley, R. C., Figueroa-Balderas, R. E., Morales‐Cruz, A., et al. (2016) · Nature Methods · doi:10.1038/nmeth.4035 · Cited by 1,882
Shen, R., & Seshan, V. (2016) · Nucleic Acids Research · doi:10.1093/nar/gkw520 · Cited by 1,263
Understanding mechanisms underlying human gene expression variation with RNA sequencing
Pickrell, J. K., Marioni, J. C., Pai, A. A., Degner, J. F., Engelhardt, B. E., Nkadori, E., Veyrieras, J.-B., Stephens, M., Gilad, Y., & Pritchard, J. K. (2010) · Nature · doi:10.1038/nature08872 · Cited by 1,256
Self-citationComputational methods for transcriptome annotation and quantification using RNA-seq
Garber, M., Grabherr, M. G., Guttman, M., & Trapnell, C. (2011) · Nature Methods · doi:10.1038/nmeth.1613 · Cited by 1,042
De novo assembly and analysis of RNA-seq data
Robertson, G., Schein, J. E., Chiu, R., Corbett, R., Field, M. A., Jackman, S. D., Mungall, K. L., Lee, S. S., Okada, H. M., Qian, J. Q., et al. (2010) · Nature Methods · doi:10.1038/nmeth.1517 · Cited by 1,028
Kukurba, K. R., & Montgomery, S. B. (2015) · Cold Spring Harbor Protocols · doi:10.1101/pdb.top084970 · Cited by 924
Translating RNA sequencing into clinical diagnostics: opportunities and challenges
Byron, S. A., Keuren‐Jensen, K. R. V., Engelthaler, D. M., Carpten, J. D., & Craig, D. W. (2016) · Nature Reviews Genetics · doi:10.1038/nrg.2016.10 · Cited by 823
Sequencing pools of individuals — mining genome-wide polymorphism data without big funding
Schlötterer, C., Tobler, R., Kofler, R., & Nolte, V. (2014) · Nature Reviews Genetics · doi:10.1038/nrg3803 · Cited by 803
Kofler, R., Orozco‐terWengel, P., Maio, N. D., Pandey, R. V., Nolte, V., Futschik, A., Kosiol, C., & Schlötterer, C. (2011) · PLoS ONE · doi:10.1371/journal.pone.0015925 · Cited by 576
Characterizing the Major Structural Variant Alleles of the Human Genome
Audano, P. A., Sulovari, A., Graves-Lindsay, T. A., Cantsilieris, S., Sorensen, M., Welch, A. E., Dougherty, M. L., Nelson, B. J., Shah, A., Dutcher, S. K., et al. (2019) · Cell · doi:10.1016/j.cell.2018.12.019 · Cited by 492
Next-generation genomics: an integrative approach
Hawkins, R. D., Hon, G. C., & Ren, B. (2010) · Nature Reviews Genetics · doi:10.1038/nrg2795 · Cited by 608
WASP: allele-specific software for robust molecular quantitative trait locus discovery
van de Geijn, B., McVicker, G., Gilad, Y., & Pritchard, J. K. (2015) · Nature Methods · doi:10.1038/nmeth.3582 · Cited by 575
Self-citationTranscriptome analysis using next-generation sequencing
Mutz, K.-O., Heilkenbrinker, A., Lönne, M., Walter, J., & Stahl, F. (2012) · Current Opinion in Biotechnology · doi:10.1016/j.copbio.2012.09.004 · Cited by 547
Performance comparison of exome DNA sequencing technologies
Clark, M. J., Chen, R., Lam, H. Y. K., Karczewski, K. J., Chen, R., Euskirchen, G. M., Butte, A. J., & Snyder, M. P. (2011) · Nature Biotechnology · doi:10.1038/nbt.1975 · Cited by 531
Comprehensive analysis of RNA-Seq data reveals extensive RNA editing in a human transcriptome
Peng, Z., Cheng, Y., Tan, B. C., Kang, L., Tian, Z., Zhu, Y., Zhang, W., Liang, Y., Hu, X., Tan, X., et al. (2012) · Nature Biotechnology · doi:10.1038/nbt.2122 · Cited by 506
Identification of Genetic Variants That Affect Histone Modifications in Human Cells
McVicker, G., van de Geijn, B., Degner, J. F., Cain, C. E., Banovich, N. E., Raj, A., Lewellen, N., Myrthil, M., Gilad, Y., & Pritchard, J. K. (2013) · Science · doi:10.1126/science.1242429 · Cited by 436
Self-citationGMAP and GSNAP for Genomic Sequence Alignment: Enhancements to Speed, Accuracy, and Functionality
Wu, T. D., Reeder, J., Lawrence, M. F., Becker, G., & Brauer, M. J. (2016) · Methods in molecular biology · doi:10.1007/978-1-4939-3578-9_15 · Cited by 428
Genome graphs and the evolution of genome inference
Paten, B., Novak, A. M., Eizenga, J. M., & Garrison, E. (2017) · Genome Research · doi:10.1101/gr.214155.116 · Cited by 351
Linck, E. B., & Battey, C. J. (2019) · Molecular Ecology Resources · doi:10.1111/1755-0998.12995 · Cited by 402
Eizenga, J. M., Novak, A. M., Sibbesen, J. A., Heumos, S., Ghaffaari, A., Hickey, G., Chang, X., Seaman, J. D., Rounthwaite, R., Ebler, J., et al. (2020) · Annual Review of Genomics and Human Genetics · doi:10.1146/annurev-genom-120219-080406 · Cited by 320
Tools and best practices for data processing in allelic expression analysis.
Castel, S. E., Levy-Moonshine, A., Mohammadi, P., Banks, E., & Lappalainen, T. (2015) · Genome Biology · doi:10.1186/s13059-015-0762-6 · Cited by 375
Long reads: their purpose and place
Pollard, M., Gurdasani, D., Mentzer, A. J., Porter, T., & Sandhu, M. S. (2018) · Human Molecular Genetics · doi:10.1093/hmg/ddy177 · Cited by 391
Accurate identification of A-to-I RNA editing in human by transcriptome sequencingPreprint
Bahn, J. H., Lee, J., Li, G., Greer, C., Peng, G., & Xiao, X. G. (2011) · Genome Research · doi:10.1101/gr.124107.111 · Cited by 352
Li, A., Liu, D., Wu, J., Zhao, X., Hao, M., Geng, S., Yan, J., Jiang, X., Zhang, L., Wu, J., et al. (2014) · The Plant Cell · doi:10.1105/tpc.114.124388 · Cited by 337
Identifying and mitigating bias in next-generation sequencing methods for chromatin biology
Meyer, C. A., & Liu, X. S. (2014) · Nature Reviews Genetics · doi:10.1038/nrg3788 · Cited by 342
Nookaew, I., Papini, M., Pornputtapong, N., Scalcinati, G., Fagerberg, L., Uhlén, M., & Nielsen, J. (2012) · Nucleic Acids Research · doi:10.1093/nar/gks804 · Cited by 309
AlleleSeq: analysis of allele-specific expression and binding in a network framework.
Rozowsky, J., Abyzov, A., Wang, J., Alves, P., Raha, D., Harmanci, A., Leng, J., Bjornson, R., Kong, Y., Kitabayashi, N., et al. (2011) · Molecular Systems Biology · doi:10.1038/msb.2011.54 · Cited by 316
RNA-seq: technical variability and sampling
McIntyre, L. M., Lopiano, K. K., Morse, A. M., Amin, V., Oberg, A. L., Young, L. J., & Nuzhdin, S. V. (2011) · BMC Genomics · doi:10.1186/1471-2164-12-293 · Cited by 285
The role of replicates for error mitigation in next-generation sequencing
Robasky, K., Lewis, N. E., & Church, G. M. (2013) · Nature Reviews Genetics · doi:10.1038/nrg3655 · Cited by 316
Genome-wide allele-specific analysis: insights into regulatory variation
Pastinen, T. (2010) · Nature Reviews Genetics · doi:10.1038/nrg2815 · Cited by 291
Haplotype and isoform specific expression estimation using multi-mapping RNA-seq reads
Turro, E., Su, S.-Y., Gonçalves, Â., Coin, L. J., Richardson, S., & Lewin, A. (2011) · Genome Biology · doi:10.1186/gb-2011-12-2-r13 · Cited by 264
Advanced Applications of RNA Sequencing and Challenges
Han, Y., Gao, S., Muegge, K., Zhang, W., & Zhou, B. (2015) · Bioinformatics and Biology Insights · doi:10.4137/bbi.s28991 · Cited by 303
Long-read mapping to repetitive reference sequences using Winnowmap2
Jain, C., Rhie, A., Hansen, N. F., Koren, S., & Phillippy, A. M. (2022) · Nature Methods · doi:10.1038/s41592-022-01457-8 · Cited by 276
Bioinformatics challenges for personalized medicine
Fernald, G. H., Capriotti, E., Daneshjou, R., Karczewski, K. J., & Altman, R. B. (2011) · Bioinformatics · doi:10.1093/bioinformatics/btr295 · Cited by 268
Fine-mapping cellular QTLs with RASQUAL and ATAC-seq
Kumasaka, N., Knights, A. J., & Gaffney, D. J. (2015) · Nature Genetics · doi:10.1038/ng.3467 · Cited by 244
Ribosome profiling reveals post-transcriptional buffering of divergent gene expression in yeast
McManus, C. J., May, G. E., Spealman, P., & Shteyman, A. (2014) · Genome Research · doi:10.1101/gr.164996.113 · Cited by 219
The study of eQTL variations by RNA-seq: from SNPs to phenotypes
Majewski, J., & Pastinen, T. (2011) · Trends in Genetics · doi:10.1016/j.tig.2010.10.006 · Cited by 232
Design and validation issues in RNA-seq experiments
Fang, Z., & Cui, X. (2011) · Briefings in Bioinformatics · doi:10.1093/bib/bbr004 · Cited by 243
Swart, E. C., Bracht, J. R., Magrini, V. J., Minx, P. J., Chen, X., Zhou, Y., Khurana, J. S., Goldman, A. D., Nowacki, M., Schotanus, K., et al. (2013) · PLoS Biology · doi:10.1371/journal.pbio.1001473 · Cited by 232
Critical Evaluation of Imprinted Gene Expression by RNA–Seq: A New Perspective
DeVeale, B., van der Kooy, D., & Babak, T. (2012) · PLoS Genetics · doi:10.1371/journal.pgen.1002600 · Cited by 223
Paragraph: a graph-based structural variant genotyper for short-read sequence data
Chen, S., Krusche, P., Dolzhenko, E., Sherman, R. M., Petrovski, R., Schlesinger, F., Kirsche, M., Bentley, D. R., Schatz, M. C., Sedlazeck, F. J., et al. (2019) · Genome Biology · doi:10.1186/s13059-019-1909-7 · Cited by 196
Fast and accurate genomic analyses using genome graphs
Rakocevic, G., Semenyuk, V., Lee, W., Spencer, J., Browning, J., Johnson, I. J., Arsenijevic, V., Nadj, J., Ghose, K., Suciu, M., et al. (2019) · Nature Genetics · doi:10.1038/s41588-018-0316-4 · Cited by 223
The landscape of genomic imprinting across diverse adult human tissuesPreprint
Baran, Y., Subramaniam, M., Biton, A., Tukiainen, T., Tsang, E. K., Rivas, M. A., Pirinen, M., Gutiérrez‐Arcelus, M., Smith, K. S., Kukurba, K., et al. (2015) · Genome Research · doi:10.1101/gr.192278.115 · Cited by 225
Inferring the kinetics of stochastic gene expression from single-cell RNA-sequencing data
Kim, J. K., & Marioni, J. C. (2013) · Genome biology · doi:10.1186/gb-2013-14-1-r7 · Cited by 216
Self-citationImpacts of Neanderthal-Introgressed Sequences on the Landscape of Human Gene Expression
McCoy, R. C., Wakefield, J., & Akey, J. M. (2017) · Cell · doi:10.1016/j.cell.2017.01.038 · Cited by 200
Skelly, D. A., Johansson, M., Madeoy, J., Wakefield, J., & Akey, J. M. (2011) · Genome Research · doi:10.1101/gr.119784.110 · Cited by 203
Coregulation of tandem duplicate genes slows evolution of subfunctionalization in mammals
Lan, X., & Pritchard, J. K. (2016) · Science · doi:10.1126/science.aad8411 · Cited by 194
Self-citationBrandt, D. Y. C., Aguiar, V. R. C., Bitarello, B. D., Nunes, K., Goudet, J., & Meyer, D. (2015) · G3 Genes Genomes Genetics · doi:10.1534/g3.114.015784 · Cited by 189
Landscape of allele-specific transcription factor binding in the human genome
Abramov, S., Boytsov, A., Bykova, D., Penzar, D., Yevshin, I., Kolmykov, S. K., Fridman, M. V., Favorov, A. V., Vorontsov, I. E., Baulin, E. F., et al. (2021) · Nature Communications · doi:10.1038/s41467-021-23007-0 · Cited by 177
Three-stage quality control strategies for DNA re-sequencing data
Guo, Y. P., Ye, F., Sheng, Q., Clark, T. A., & Samuels, D. C. (2013) · Briefings in Bioinformatics · doi:10.1093/bib/bbt069 · Cited by 177
Mitochondrial DNA heteroplasmy in the emerging field of massively parallel sequencing
Just, R. S., Irwin, J. A., & Parson, W. (2015) · Forensic Science International Genetics · doi:10.1016/j.fsigen.2015.05.003 · Cited by 183
Reddy, T. E., Gertz, J., Pauli, F., Kucera, K. S., Varley, K. E., Newberry, K. M., Marinov, G. K., Mortazavi, A., Williams, B. A., Song, L., et al. (2012) · Genome Research · doi:10.1101/gr.131201.111 · Cited by 175
Natural selection on cis and trans regulation in yeastsPreprint
Emerson, J. J., Hsieh, L., Sung, H.-M., Wang, T., Huang, C.-J., Lu, H. H. S., Lu, M. J., Wu, S., & Li, W. (2010) · Genome Research · doi:10.1101/gr.101576.109 · Cited by 166
Polymorphic Cis- and Trans-Regulation of Human Gene Expression
Cheung, V. G., Nayak, R. R., Wang, I. X., Elwyn, S., Cousins, S. M., Morley, M. P., & Spielman, R. S. (2010) · PLoS Biology · doi:10.1371/journal.pbio.1000480 · Cited by 168
SNPsplit: Allele-specific splitting of alignments between genomes with known SNP genotypes
Krueger, F., & Andrews, S. R. (2016) · F1000Research · doi:10.12688/f1000research.9037.2 · Cited by 163
Allele-specific expression reveals interactions between genetic variation and environment
Knowles, D. A., Davis, J. R., Edgington, H. A., Raj, A., Favé, M.-J., Zhu, X., Potash, J. B., Weissman, M. M., Shi, J., Levinson, D. F., et al. (2017) · Nature Methods · doi:10.1038/nmeth.4298 · Cited by 141
Stevenson, K. R., Coolon, J. D., & Wittkopp, P. J. (2013) · BMC Genomics · doi:10.1186/1471-2164-14-536 · Cited by 140
Phased Whole-Genome Genetic Risk in a Family Quartet Using a Major Allele Reference Sequence
Dewey, F. E., Chen, R., Cordero, S. P., Ormond, K. E., Caleshu, C. A., Karczewski, K. J., Whirl‐Carrillo, M., Wheeler, M. T., Dudley, J. T., Byrnes, J., et al. (2011) · PLoS Genetics · doi:10.1371/journal.pgen.1002280 · Cited by 141
Human genes escaping X-inactivation revealed by single cell expression data
Wainer-Katsir, K., & Michal Linial, B. (2019) · BMC Genomics · doi:10.1186/s12864-019-5507-6 · Cited by 138
MBASED: allele-specific expression detection in cancer tissues and cell lines
Mayba, O., Gilbert, H., Liu, J., Haverty, P. M., Jhunjhunwala, S., Jiang, Z., Watanabe, C. K., & Zhang, Z. (2014) · Genome biology · doi:10.1186/s13059-014-0405-3 · Cited by 138
Radiogenomic Analysis of Oncological Data: A Technical Survey
Incoronato, M., Aiello, M., Infante, T., Cavaliere, C., Grimaldi, A., Mirabelli, P., Monti, S., & Salvatore, M. (2017) · International Journal of Molecular Sciences · doi:10.3390/ijms18040805 · Cited by 138
Baker, C. L., Kajita, S., Walker, M., Saxl, R. L., Raghupathy, N., Choi, K., Petkov, P. M., & Paigen, K. (2015) · PLoS Genetics · doi:10.1371/journal.pgen.1004916 · Cited by 137
Genetic degeneration of old and young Y chromosomes in the flowering plant Rumex hastatulus
Hough, J., Hollister, J. D., Wang, W., Barrett, S. C. H., & Wright, S. (2014) · Proceedings of the National Academy of Sciences · doi:10.1073/pnas.1319227111 · Cited by 134
Genetic advances in systemic lupus erythematosus: an update
Chen, L., Morris, D. L., & Vyse, T. J. (2017) · Current Opinion in Rheumatology · doi:10.1097/bor.0000000000000411 · Cited by 132
Thind, A. S., Monga, I., Thakur, P. K., Kumari, P., Dindhoria, K., Krzak, M., Ranson, M., & Ashford, B. (2021) · Briefings in Bioinformatics · doi:10.1093/bib/bbab259 · Cited by 132
Characterizing natural variation using next-generation sequencing technologies
Gilad, Y., Pritchard, J. K., & Thornton, K. (2009) · Trends in Genetics · doi:10.1016/j.tig.2009.09.003 · Cited by 130
Self-citationNatural hybridization reveals incompatible alleles that cause melanoma in swordtail fish
Powell, D. L., García-Olazábal, M., Keegan, M., Reilly, P., Du, K., Díaz-Loyo, A. P., Banerjee, S., Blakkan, D., Reich, D., Andolfatto, P., et al. (2020) · Science · doi:10.1126/science.aba5216 · Cited by 124
Models for transcript quantification from RNA-SeqPreprint
Pachter, L. S. (2011) · arXiv (Cornell University) · doi:10.48550/arxiv.1104.3889 · Cited by 175
Akama, S., Shimizu‐Inatsugi, R., Shimizu, K. K., & Sese, J. (2014) · Nucleic Acids Research · doi:10.1093/nar/gkt1376 · Cited by 120
RNA sequencing reveals the role of splicing polymorphisms in regulating human gene expression
Lalonde, E., Ha, K. C. H., Wang, Z., Bemmo, A., Kleinman, C. L., Kwan, T., Pastinen, T., & Majewski, J. (2011) · Genome Research · doi:10.1101/gr.111211.110 · Cited by 111
Josephs, E. B., Lee, Y. W., Stinchcombe, J. R., & Wright, S. (2015) · Proceedings of the National Academy of Sciences · doi:10.1073/pnas.1503027112 · Cited by 118
DeBiasse, M. B., & Kelly, M. W. (2015) · Journal of Heredity · doi:10.1093/jhered/esv073 · Cited by 131
Alignment of Next-Generation Sequencing Reads
Reinert, K., Langmead, B., Weese, D., & Evers, D. J. (2015) · Annual Review of Genomics and Human Genetics · doi:10.1146/annurev-genom-090413-025358 · Cited by 127
Reference flow: reducing reference bias using multiple population genomes
Chen, N.-C., Solomon, B., Mun, T., Iyer, S., & Langmead, B. (2021) · Genome biology · doi:10.1186/s13059-020-02229-3 · Cited by 113
Digel, B., Pankin, A., & von Korff, M. (2015) · The Plant Cell · doi:10.1105/tpc.15.00203 · Cited by 106
Wit, P. D., Pespeni, M. H., & Palumbi, S. R. (2015) · Molecular Ecology · doi:10.1111/mec.13165 · Cited by 115
High-throughput sequencing in mitochondrial DNA research
Ye, F., Samuels, D. C., Clark, T. A., & Guo, Y. P. (2014) · Mitochondrion · doi:10.1016/j.mito.2014.05.004 · Cited by 111
Deciphering the Emerging Complexities of Molecular Mechanisms at GWAS Loci
Cannon, M. E., & Mohlke, K. L. (2018) · The American Journal of Human Genetics · doi:10.1016/j.ajhg.2018.10.001 · Cited by 111
Widespread Selection for Oncogenic Mutant Allele Imbalance in Cancer
Bielski, C. M., Donoghue, M. T. A., Gadiya, M. M., Hanrahan, A. J., Won, H. H., Chang, M. T., Jonsson, P., Penson, A. V., Gorelick, A. N., Harris, C., et al. (2018) · Cancer Cell · doi:10.1016/j.ccell.2018.10.003 · Cited by 108
Unraveling the clonal hierarchy of somatic genomic aberrations
Prandi, D., Baca, S. C., Romanel, A., Barbieri, C. E., Mosquera, J., Fontugne, J., Beltran, H., Sboner, A., Garraway, L. A., Rubin, M. A., et al. (2014) · Genome biology · doi:10.1186/s13059-014-0439-6 · Cited by 102
A uniform survey of allele-specific binding and expression over 1000-Genomes-Project individuals
Chen, J., Rozowsky, J. S., Galeev, T. R., Harmanci, A. O., Kitchen, R. R., Bedford, J., Abyzov, A. S., Kong, Y., Regan, L., & Gerstein, M. (2016) · Nature Communications · doi:10.1038/ncomms11101 · Cited by 105
Detection and Removal of Biases in the Analysis of Next-Generation Sequencing Reads
Schwartz, S., Ram, O., & Ast, G. (2011) · PLoS ONE · doi:10.1371/journal.pone.0016685 · Cited by 101
A new strategy to reduce allelic bias in RNA-Seq readmapping
Vijaya Satya, R., Zavaljevski, N., & Reifman, J. (2012) · Nucleic Acids Research · doi:10.1093/nar/gks425 · Cited by 101
PurBayes: estimating tumor cellularity and subclonality in next-generation sequencing data
Larson, N. B., & Fridley, B. L. (2013) · Bioinformatics · doi:10.1093/bioinformatics/btt293 · Cited by 100
Hierarchical analysis of RNA-seq reads improves the accuracy of allele-specific expression
Raghupathy, N., Choi, K., Vincent, M. J., Beane, G., Sheppard, K., Munger, S. C., Korstanje, R., de Villena, F. P., & Churchill, G. A. (2018) · Bioinformatics · doi:10.1093/bioinformatics/bty078 · Cited by 98
Deelen, P., Zhernakova, D. V., de Haan, M., van der Sijde, M. R., Bonder, M. J., Karjalainen, J. M., van der Velde, K. J., Abbott, K. M., Fu, J., Wijmenga, C., et al. (2015) · Genome Medicine · doi:10.1186/s13073-015-0152-4 · Cited by 94
Moncunill, V., González, S., Beà, S., Andrieux, L. O., Salaverría, I., Royo, C., Martinez, L., Puiggròs, M., Segura‐Wang, M., Stütz, A. M., et al. (2014) · Nature Biotechnology · doi:10.1038/nbt.3027 · Cited by 93
Dynamically evolving novel overlapping gene as a factor in the SARS-CoV-2 pandemic
Nelson, C. W., Ardern, Z., Goldberg, T. L., Meng, C., Kuo, C.-H., Ludwig, C., Kolokotronis, S.-O., & Wei, X. (2020) · eLife · doi:10.7554/elife.59633 · Cited by 87
Patterns of homoeologous gene expression shown by RNA sequencing in hexaploid bread wheat
Leach, L. J., Belfield, E. J., Jiang, C., Brown, C., Mithani, A., & Harberd, N. P. (2014) · BMC Genomics · doi:10.1186/1471-2164-15-276 · Cited by 89
Gopalakrishnan, S., Castruita, J. A. S., Sinding, M. S., Kuderna, L. F. K., Räikkönen, J., Petersen, B., Sicheritz‐Pontén, T., Larson, G., Orlando, L., Marquès‐Bonet, T., et al. (2017) · BMC Genomics · doi:10.1186/s12864-017-3883-3 · Cited by 95
Monoallelic Gene Expression in Mammals
Chess, A. J. (2016) · Annual Review of Genetics · doi:10.1146/annurev-genet-120215-035120 · Cited by 81
Haplotype-aware pantranscriptome analyses using spliced pangenome graphs
Sibbesen, J. A., Eizenga, J. M., Novak, A. M., Sirén, J., Chang, X., Garrison, E., & Paten, B. (2023) · Nature Methods · doi:10.1038/s41592-022-01731-9 · Cited by 83
Munger, S. C., Raghupathy, N., Choi, K., Simons, A. K., Gatti, D. M., Hinerfeld, D. A., Svenson, K. L., Keller, M. P., Attie, A. D., Hibbs, M. A., et al. (2014) · Genetics · doi:10.1534/genetics.114.165886 · Cited by 85
Quantifying single nucleotide variant detection sensitivity in exome sequencing
Meynert, A. M., Bicknell, L. S., Hurles, M. E., Jackson, A. P., & Taylor, M. S. (2013) · BMC Bioinformatics · doi:10.1186/1471-2105-14-195 · Cited by 87
Extensive variation between tissues in allele specific expression in an outbred mammal
Chamberlain, A. J., Jagt, C. J. V., Hayes, B. J., Khansefid, M., Marett, L. C., Millen, C. A., Nguyen, T. T. T., & Goddard, M. E. (2015) · BMC Genomics · doi:10.1186/s12864-015-2174-0 · Cited by 86
FORGe: prioritizing variants for graph genomes
Pritt, J., Chen, N.-C., & Langmead, B. (2018) · Genome biology · doi:10.1186/s13059-018-1595-x · Cited by 84
QuASAR: quantitative allele-specific analysis of reads
Harvey, C. T., Moyerbrailean, G. A., Davis, G. O., Wen, X., Luca, F., & Piqué-Regi, R. (2014) · Bioinformatics · doi:10.1093/bioinformatics/btu802 · Cited by 86
Assessing allele-specific expression across multiple tissues from RNA-seq read data
Pirinen, M., Lappalainen, T., Zaitlen, N., Dermitzakis, E. T., Donnelly, P., McCarthy, M. I., & Rivas, M. A. (2015) · Bioinformatics · doi:10.1093/bioinformatics/btv074 · Cited by 83
Metadata
- Authors
- Degner, J. F., Marioni, J. C., Pai, A. A., Pickrell, J. K., Nkadori, E., Gilad, Y., & Pritchard, J. K.
- Affiliations
- Howard Hughes Medical Institute (US)
- Corresponding author
- Degner, Jacob F.
- Marioni, John C.
- Gilad, Yoav
- Pritchard, Jonathan K.
- Venue
- Bioinformatics
- Publisher
- Oxford University Press (OUP)
- Published
- 2009-10-06
- Volume
- 25
- Issue
- 24
- Pages
- 3207-3212
- ISSN
- 1367-4803 (ISSN-L)
- 1367-4811
- PMC
- PMC2788925
- OpenAlex
- W2113312463
- Cited by
- 502
- References
- 19
- Citations by year
- 2026: 10 · 2025: 12 · 2024: 21 · 2023: 17 · 2022: 18 · 2021: 47 · 2020: 41 · 2019: 37 · 2018: 31 · 2017: 26 · 2016: 41 · 2015: 46 · 2014: 48 · 2013: 36 · 2012: 28
- FWCI
- 9.54
- Type
- journal article
- Language
- en
- Open access
- hybrid
- doi.org
- Licence
- Locations
- Bioinformatics (publishedVersion, cc-by-nc)
- PubMed Central (publishedVersion, cc-by-nc)
- PubMed (publishedVersion)
- Funders
- Howard Hughes Medical Institute
- Yale University
- National Institutes of Health
- National Institute of Mental Health (R01MH084703)
- National Institute of General Medical Sciences (GM077959, R01GM077959, T 532 GM007197-34, T32GM007197)
- Argonne National Laboratory
- Topics
- Life Sciences › Biochemistry, Genetics and Molecular Biology › Molecular Biology › Genomics and Phylogenetic Studies
- Life Sciences › Biochemistry, Genetics and Molecular Biology › Molecular Biology › RNA Research and Splicing
- Life Sciences › Biochemistry, Genetics and Molecular Biology › Molecular Biology › Single-cell and spatial transcriptomics
- Keywords
- allele-specific expression, single nucleotide polymorphisms, heterozygous SNPs, RNA sequencing, cis-regulatory variation
- MeSH terms
- Alleles, Base Sequence, Humans, Software, Genome, Human, Sequence Analysis, RNA, Computational Biology, Polymorphism, Single Nucleotide, Gene Expression Profiling
About these checks
Registry, retraction, Cites and statistics results are computed, not judged, with one exception: a printed reference that no index lists is read once by a model before it counts as a citation error. Claims are extracted by a model and kept only when their quote appears verbatim in the text; each cited source is then checked, with a model’s help, for whether it says what the claim relies on. Those verdicts can be wrong — read the claim’s quote and the cited source before relying on one.
Statistics and arithmetic are recomputed, not judged.
Confidence bands are shown only for fields calibrated on our annotated test set. None is calibrated yet, so no band is shown.
What counts as a claim ›How we measure confidence ›How we check this ›
Are you an author, or do you see a problem with this page? Request a review
