

The DOI matches its Crossref record; 90 of the 91 references it cites were found in a registry or an index; 25 of the 62 sources its claims cite were checked for support.
The influence of phospho-tau on dendritic spines of cortical pyramidal neurons in patients with Alzheimer’s disease
Open accessAbstract
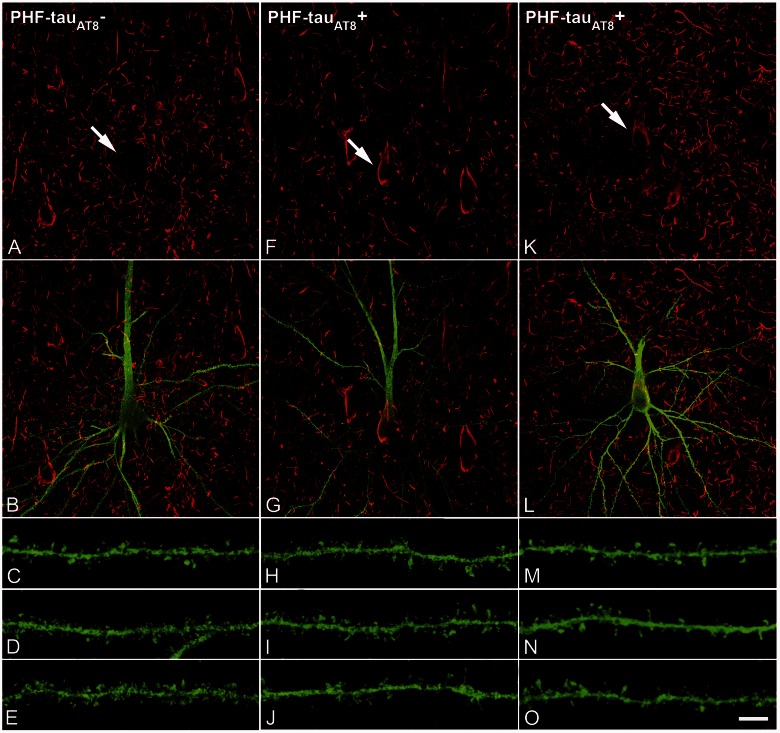
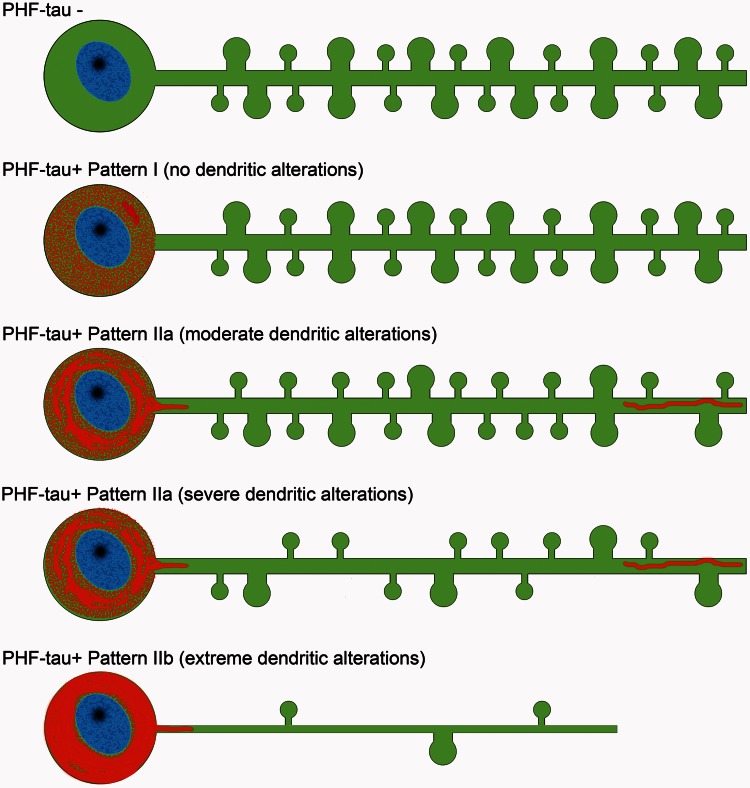
The dendritic spines on pyramidal cells represent the main postsynaptic elements of cortical excitatory synapses and they are fundamental structures in memory, learning and cognition. In the present study, we used intracellular injections of Lucifer yellow in fixed tissue to analyse over 19 500 dendritic spines that were completely reconstructed in three dimensions along the length of the basal dendrites of pyramidal neurons in the parahippocampal cortex and CA1 of patients with Alzheimer's disease. Following intracellular injection, sections were immunostained for anti-Lucifer yellow and with tau monoclonal antibodies AT8 and PHF-1, which recognize tau phosphorylated at Ser202/Thr205 and at Ser396/404, respectively. We observed that the diffuse accumulation of phospho-tau in a putative pre-tangle state did not induce changes in the dendrites of pyramidal neurons, whereas the presence of tau aggregates forming intraneuronal neurofibrillary tangles was associated with progressive alteration of dendritic spines (loss of dendritic spines and changes in their morphology) and dendrite atrophy, depending on the degree of tangle development. Thus, the presence of phospho-tau in neurons does not necessarily mean that they suffer severe and irreversible effects as thought previously but rather, the characteristic cognitive impairment in Alzheimer's disease is likely to depend on the relative number of neurons that have well developed tangles.
Overview
AI snapshot
Written from the paper’s full text.
TL;DR
In human Alzheimer’s disease tissue, diffuse phospho-tau in a putative pre-tangle state did not alter dendritic spine or dendrite morphology, whereas tau aggregates forming neurofibrillary tangles were associated with progressive spine loss, smaller/shorter spines, and dendrite atrophy. The authors conclude that phospho-tau presence alone does not necessarily cause severe irreversible damage; cognitive impairment may depend on the relative number of neurons with well-developed tangles.
Key findings
- Across 42 Lucifer yellow-injected neurons and 19,569 dendritic spines, neurons with Pattern I diffuse phospho-tau showed no significant differences from PHF-tau− neurons in dendrite diameter, spine density, spine length, or spine volume in parahippocampal cortex Patient P9.
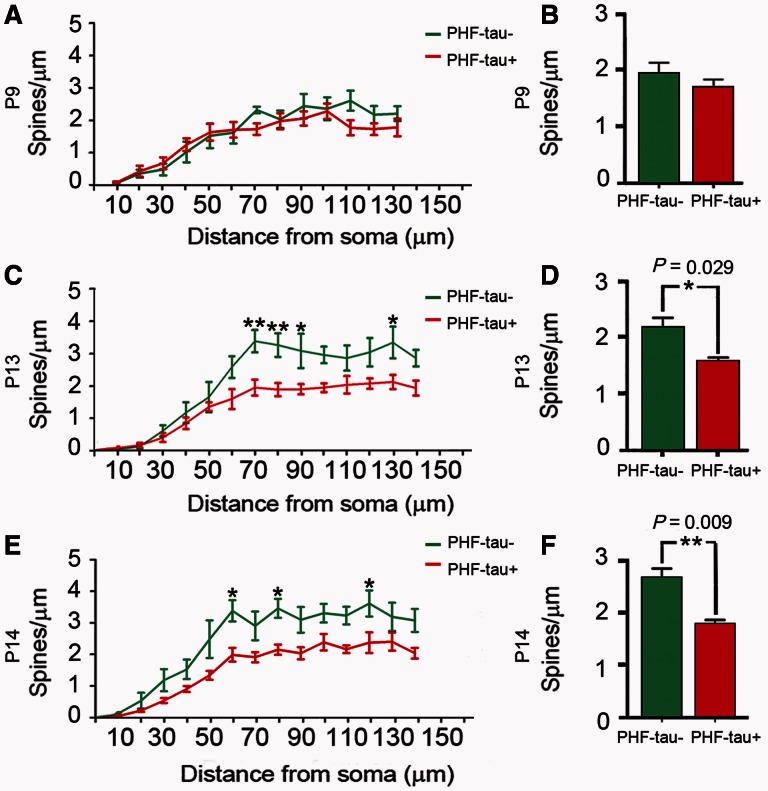
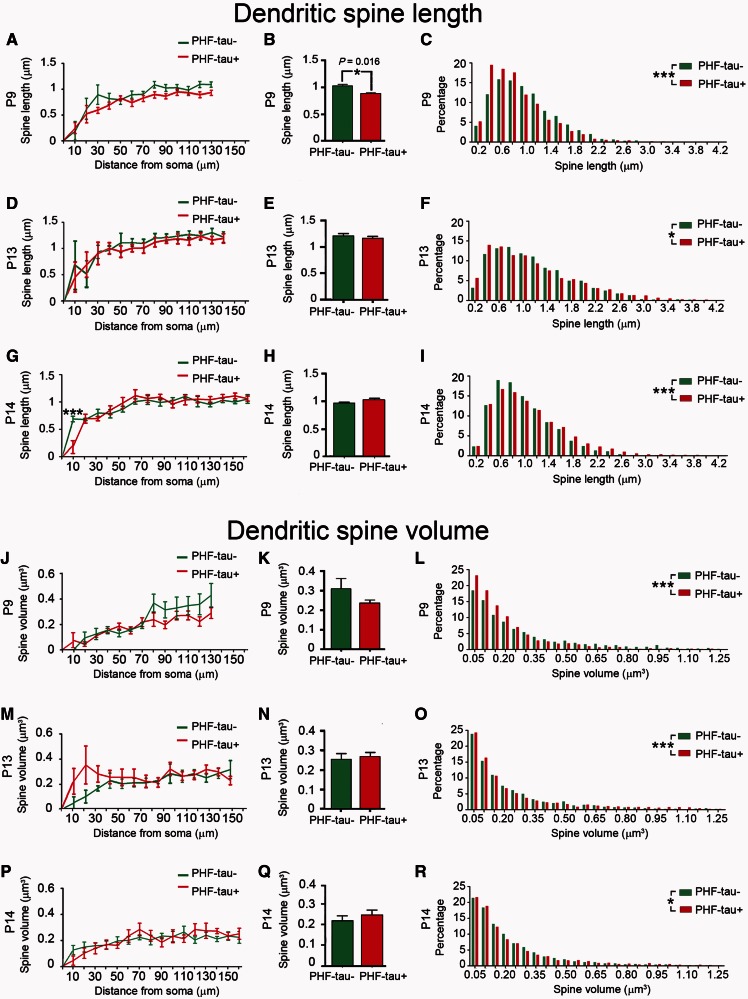
- In CA1 Pattern IIa neurons, changes varied by patient: Patient P9 had 22% smaller average dendrite diameter and 14% shorter average spine length; Patients P13 and P14 showed lower dendritic spine density in medial/distal dendrites; all three patients showed a higher frequency of small spines in PHF-tau+ neurons.
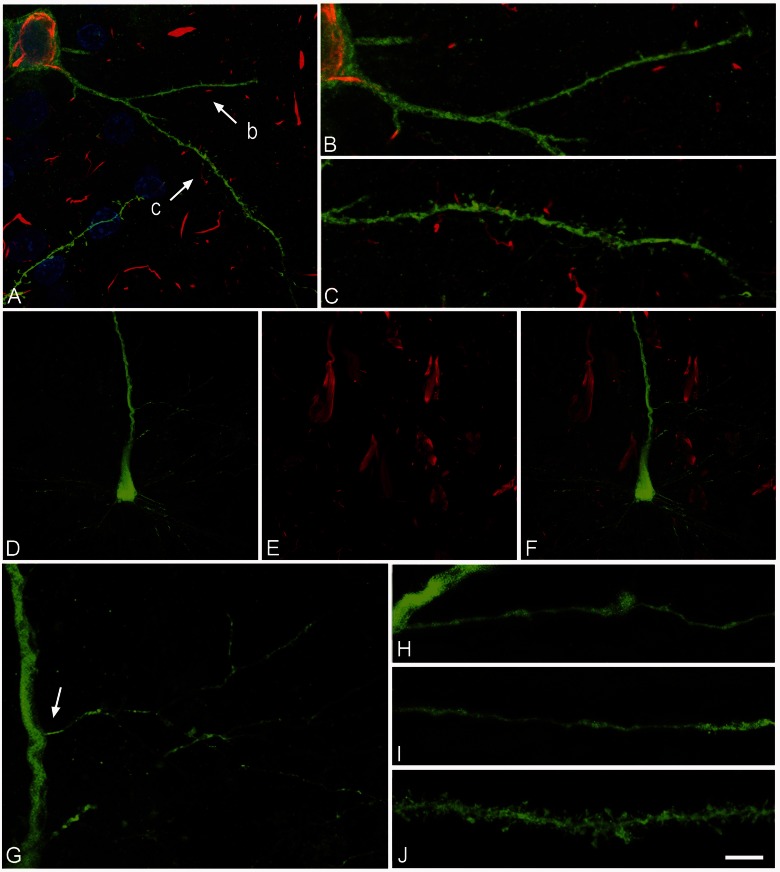
- Pattern IIb neurons with well-developed tangles had reduced dendritic arbors, remarkably thin dendrites, and few or virtually no dendritic spines.
- Distal dendritic segments with fibrillar PHF-tauAT8 had significantly lower spine density than adjacent pre-terminal segments lacking PHF-tauAT8, suggesting a local toxic effect.
Methods
- Human autopsy brain tissue from n = 5 patients; quantitative morphometry focused on Patients P9, P13, and P14, with neurons in layer III of parahippocampal cortex and CA1 pyramidal layer.
- Individual pyramidal cells were injected intracellularly with Lucifer yellow in fixed tissue, then sections were immunostained for anti-Lucifer yellow and tau antibodies AT8 (Ser202/Thr205) and PHF-1 (Ser396/404); spines were scanned by confocal microscopy and reconstructed in three dimensions.
- Measured dendrite diameter, dendritic spine density, spine length, and spine volume; statistics used Mann-Whitney tests, Kolmogorov-Smirnov tests for frequency distributions, and two-way ANOVA with Bonferroni post hoc comparisons for distance-from-soma analyses.
Limitations
- The paper states that relatively few cells can be injected, pyramidal cell structure differs by cortical region, human pathological tissue has high interindividual variability, the proportion of cells with neurofibrillar pathology is unpredictable before injection, and both AT8 and PHF-1 antibodies were mouse-produced so double labeling could reflect cross-reactivity.
- The paper notes uncertainty about whether Pattern I represents a pre-tangle stage preceding Pattern II or an independent subpopulation, and it cannot determine whether findings generalize to neurons with other phosphorylated tau epitopes.
- Evident from the text: the quantitative sample is small and drawn from only three patients, the design is cross-sectional autopsy tissue, and the study cannot establish causality or track progression within individual neurons over time.
Model-written summary. Check it against the paper before relying on it.
Integrity signals
Registry
Cites
Statistics
Figures
Verification
Claims the paper makes
29 Own result · 23 Own interpretation · 13 Partly supported · 8 Sources not found · 7 No full text of the sources · 5 Own method · 3 Supported · 3 Supported so far · 2 Not checked yet · accuracy not yet measured
The cited sources support only part of this claim — read each source’s verdict below.
In the paper
“Significantly, the expression of mutant tau in mouse models of Alzheimer’s disease-like tau neuropathologies can result in a significant loss of dendritic spines and synapses (Mocanu et al., 2008; Bittner et al., 2010; Rocher et al., 2010).”
§ The influence of phospho-tau on dendritic spines of cortical pyramidal neurons in patients with Alzheimer’s disease > Introduction
What the sources say
- Not checked — no full text of the sourcecites Mocanu et al., 2008 source
- Partly supportedcites Bittner et al., 2010 sourceExperimental — accuracy not yet measured
The Results identify a mutant tau transgene (tauP301L) in the 3xTg-AD mice and report significantly reduced dendritic spine density; the Introduction treats spines as indicators of excitatory synapses. But the Discussion associates spine loss with Aβ alone or with Aβ and hyperphosphorylated tau together. The paper does not establish that expression of mutant tau itself caused the loss. (LLM, conf=0.86)
- Partly supportedcites Rocher et al., 2010 sourceExperimental — accuracy not yet measured
The Results section ('Significant reduction in dendritic spine density in TG cells'; page unavailable) reports 29% and 38% reductions in spine density in mutant-tau mice. The Discussion ('Dramatic and uniform decrease in spine density in TG cells'; page unavailable) also mentions reduced synaptophysin labeling in another mutant-tau mouse model, but this paper does not establish a significant loss of synapses in its own mice. (LLM, conf=0.85)
plainconditional- Asserted: passes — The authors put it forward as true.
- Checkable: passes — It can be checked against evidence.
- Load-bearing: passes — The paper’s conclusions depend on it.
- Based: passes — The paper gives a reason why it holds.
The cited sources support only part of this claim — read each source’s verdict below.
In the paper
“However, there is only a weak correlation between the degree of cognitive impairment and the presence of plaques or neurofibrillary tangles (Price et al., 2009)”
§ The influence of phospho-tau on dendritic spines of cortical pyramidal neurons in patients with Alzheimer’s disease > Introduction
What the sources say
- Partly supportedcites Price et al., 2009 sourceExperimental — accuracy not yet measured
The Results (Quantitative Neuropathological Assessment; page unavailable) report correlations between plaque or tangle measures and cognitive test scores, some modest in size. But the participants had no individually measurable cognitive impairment, so the study does not establish a weak correlation between lesion presence and the degree of clinical impairment. Its explicitly described “weak” correlation is between plaque burden and tangle density, not between lesions and cognition. (LLM, conf=0.84)
plaincorrelational- Asserted: passes — The authors put it forward as true.
- Checkable: passes — It can be checked against evidence.
- Load-bearing: passes — The paper’s conclusions depend on it.
- Based: passes — The paper gives a reason why it holds.
- Partly supported
The cited sources support only part of this claim — read each source’s verdict below.
In the paper
“The area of the postsynaptic density is proportional to the number of postsynaptic receptors (Nusser et al., 1998), while the number of vesicles adjacent to the presynaptic cleft is proportional to those primed for synaptic transmitter release (Dobrunz and Stevens, 1997).”
§ The influence of phospho-tau on dendritic spines of cortical pyramidal neurons in patients with Alzheimer’s disease > Discussion > Possible functional implications of the morphological changes observed
What the sources say
- Partly supportedcites Nusser et al., 1998 sourceExperimental — accuracy not yet measured
The indexed Introduction passages (page unavailable) report a positive correlation between synapse size and AMPA-receptor immunogold labeling in the hippocampal synapses studied. The citing sentence states an unqualified proportional relationship for postsynaptic receptors generally, whereas the paper concerns AMPA receptors and notes that receptor density varies more at some spine synapses. (LLM, conf=0.86)
plaincorrelational- Asserted: passes — The authors put it forward as true.
- Checkable: passes — It can be checked against evidence.
- Load-bearing: passes — The paper’s conclusions depend on it.
- Based: passes — The paper gives a reason why it holds.
- Partly supported
The cited sources support only part of this claim — read each source’s verdict below.
In the paper
“Furthermore, the volume of the head is directly proportional to the strength of synaptic currents (Harris and Stevens, 1989; Schikorski and Stevens, 1997; Arellano et al., 2007a).”
§ The influence of phospho-tau on dendritic spines of cortical pyramidal neurons in patients with Alzheimer’s disease > Discussion > Possible functional implications of the morphological changes observed
What the sources say
- Partly supportedcites Harris and Stevens, 1989 sourceExperimental — accuracy not yet measured
The Discussion reports that spine-head dimensions are proportional to postsynaptic density area and presynaptic vesicle number. In “Relationships between hippocampal spine geometry and anatomical indicators of synaptic efficacy” (page not specified), the authors propose that head size might reflect synaptic efficacy. They do not establish that head volume is directly proportional to synaptic current strength; the paper says measurement of conductance at individual spine synapses was impossible. (LLM, conf=0.87)
- Could not verifycites Schikorski and Stevens, 1997 sourceExperimental — accuracy not yet measured
The Analysis section (page unavailable) says spine-head volumes were measured, but the passages found do not relate them to synaptic-current strength. Brain active zones (page unavailable) reports a linear relationship between presynaptic bouton volume and active-zone area instead. Searches for spine-head volume, synaptic currents, and quantal amplitude did not locate the claimed proportionality. (LLM, conf=0.73)
- Not matchedcites Arellano et al., 2007a
Couldn’t be matched to a paper in Crossref, so it can’t be checked.
plaincorrelational- Asserted: passes — The authors put it forward as true.
- Checkable: passes — It can be checked against evidence.
- Load-bearing: passes — The paper’s conclusions depend on it.
- Based: passes — The paper gives a reason why it holds.
- Partly supported
The cited sources support only part of this claim — read each source’s verdict below.
In the paper
“The area of the postsynaptic density is proportional to the number of postsynaptic receptors (Nusser et al., 1998), while the number of vesicles adjacent to the presynaptic cleft is proportional to those primed for synaptic transmitter release (Dobrunz and Stevens, 1997).”
§ The influence of phospho-tau on dendritic spines of cortical pyramidal neurons in patients with Alzheimer’s disease > Discussion > Possible functional implications of the morphological changes observed
What the sources say
- Partly supportedcites Dobrunz and Stevens, 1997 sourceExperimental — accuracy not yet measured
The passage on the physical interpretation of the readily releasable pool (indexed as Abstract; no page given) says that this pool may correspond roughly to morphologically docked vesicles. It explicitly says that identifying the two pools is “far from established” and calls for a demonstration that their sizes vary correspondingly. Thus, it supports a possible relationship, not the claimed proportionality as a settled fact. (LLM, conf=0.88)
plaincorrelational- Asserted: passes — The authors put it forward as true.
- Checkable: passes — It can be checked against evidence.
- Load-bearing: passes — The paper’s conclusions depend on it.
- Based: passes — The paper gives a reason why it holds.
- Partly supported
A result the paper reports from its own data — it cites no other source for it, so there is none to check. The quote shows it is in the paper.
In the paper
“In Patient P9, the average dendrite diameter did differ significantly between the two groups of neurons, the dendrites of PHF-tau+ neurons having a 22% smaller diameter than in PHF-tau− neurons (Supplementary Fig. 7B and Supplementary Table 2).”
§ The influence of phospho-tau on dendritic spines of cortical pyramidal neurons in patients with Alzheimer’s disease > Results > Lucifer yellow-injected neurons with Pattern IIa of immunostaining for paired helical filament-tau
plaincorrelationalSingle case- Asserted: passes — The authors put it forward as true.
- Checkable: passes — It can be checked against evidence.
- Load-bearing: unclear — It is unclear whether the paper’s conclusions depend on it.
- Based: passes — The paper gives a reason why it holds.
A result the paper reports from its own data — it cites no other source for it, so there is none to check. The quote shows it is in the paper.
In the paper
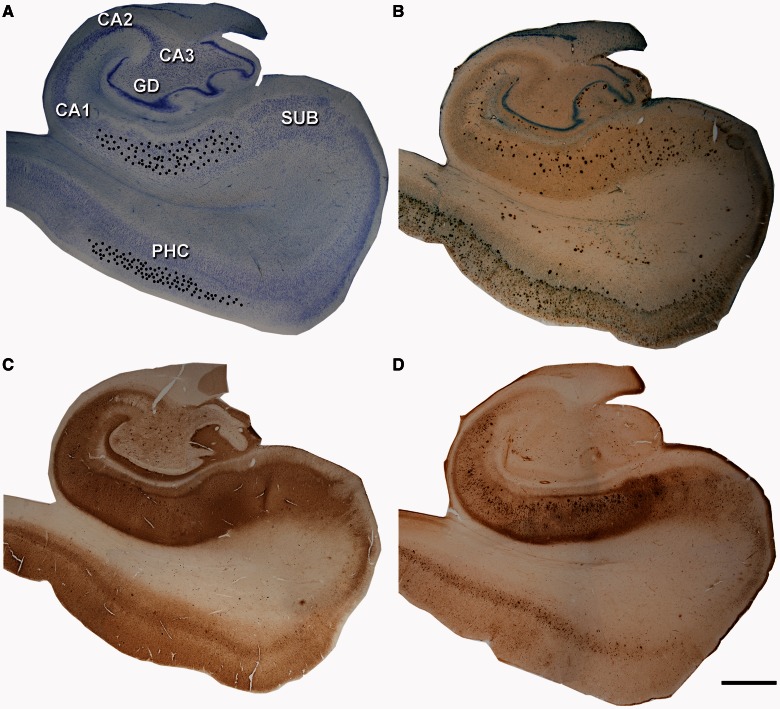
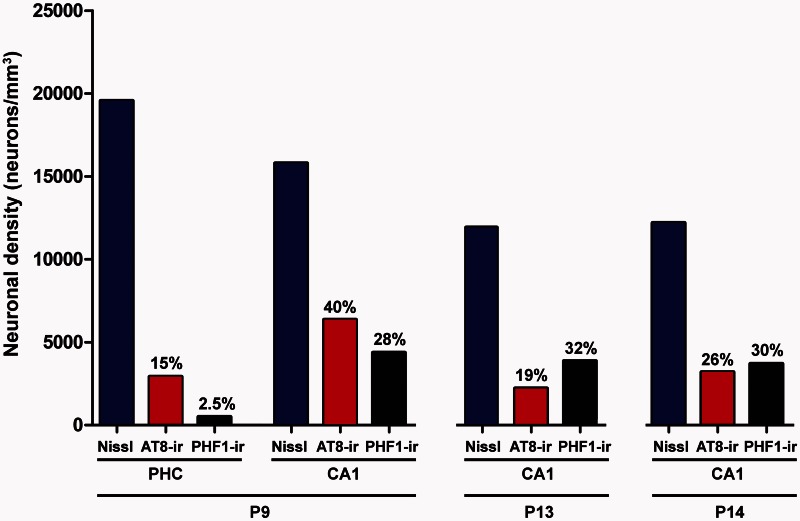
“The phospho-tau neurofibrillar pathology was stronger in the CA1 than in the parahippocampal cortex from Patient P9 (Fig. 2).”
§ The influence of phospho-tau on dendritic spines of cortical pyramidal neurons in patients with Alzheimer’s disease > Results > Neuropathological characteristics of the injected tissue
plainSingle case- Asserted: passes — The authors put it forward as true.
- Checkable: passes — It can be checked against evidence.
- Load-bearing: unclear — It is unclear whether the paper’s conclusions depend on it.
- Based: passes — The paper gives a reason why it holds.
A result the paper reports from its own data — it cites no other source for it, so there is none to check. The quote shows it is in the paper.
In the paper
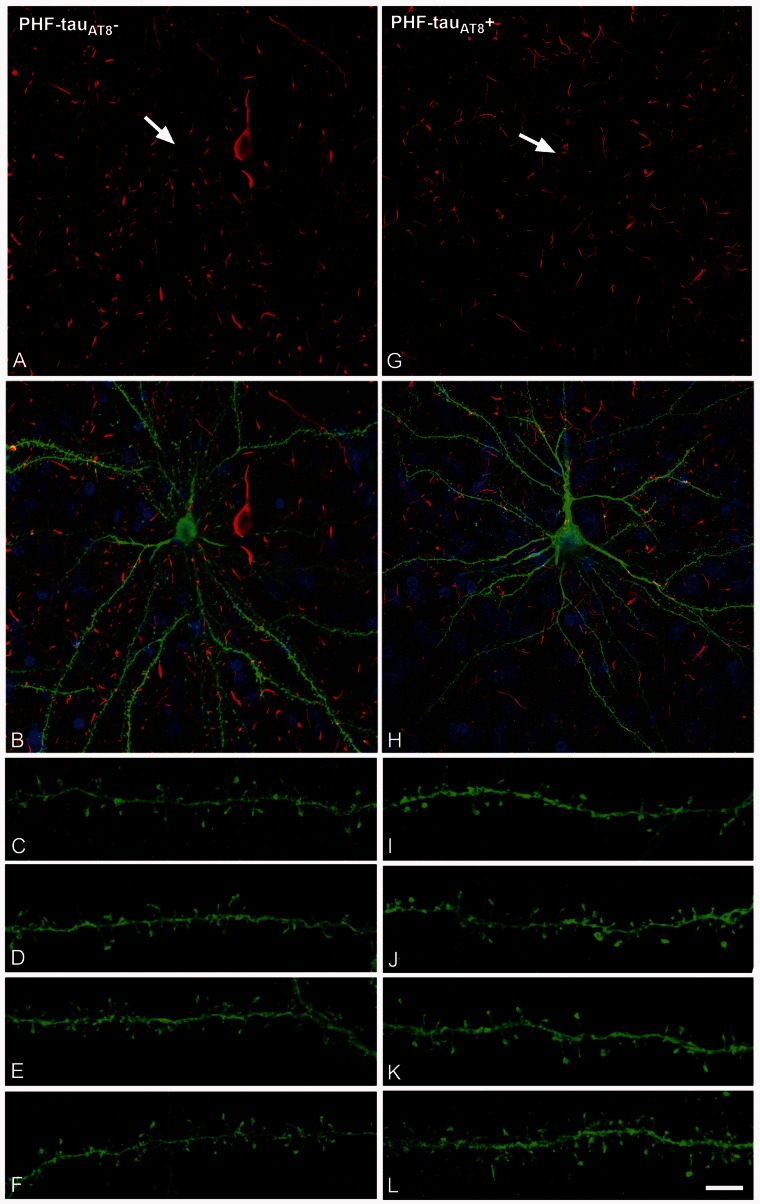
“In summary, all the morphological parameters of dendrites from Lucifer yellow-injected PHF-tau+ (Pattern I) pyramidal neurons in layer III of the parahippocampal cortex remained unchanged when they were compared with the dendrites of Lucifer yellow-injected pyramidal neurons that were PHF-tau− in the same cortical area.”
- Also stated in: § Discussion · plain
“In the present study, we found no significant changes in the microanatomy of dendrites from pyramidal neurons at early stages of a neurofibrillar pathology, as defined by the presence of diffuse phospho-tau in a putative pre-tangle state (Pattern I).”
§ The influence of phospho-tau on dendritic spines of cortical pyramidal neurons in patients with Alzheimer’s disease > Results > Lucifer yellow-injected neurons with Pattern IIa of immunostaining for paired helical filament-tau
plain- Asserted: passes — The authors put it forward as true.
- Checkable: passes — It can be checked against evidence.
- Load-bearing: passes — The paper’s conclusions depend on it.
- Based: passes — The paper gives a reason why it holds.
- Also stated in: § Discussion · plain
A result the paper reports from its own data — it cites no other source for it, so there is none to check. The quote shows it is in the paper.
In the paper
“When these segments were compared with adjacent segments of the same length (pre-terminal segments lacking PHF-tauAT8) there was a significantly lower density of dendritic spines in the distal dendritic regions with fibrillar PHF-tauAT8 (Supplementary Fig. 9) than in the pre-terminal segments.”
§ The influence of phospho-tau on dendritic spines of cortical pyramidal neurons in patients with Alzheimer’s disease > Results > Other morphological alterations
plaincorrelationalSingle case- Asserted: passes — The authors put it forward as true.
- Checkable: passes — It can be checked against evidence.
- Load-bearing: passes — The paper’s conclusions depend on it.
- Based: passes — The paper gives a reason why it holds.
A result the paper reports from its own data — it cites no other source for it, so there is none to check. The quote shows it is in the paper.
In the paper
“Moreover, when comparing the total neuronal density with the density of PHF-tauAT8-ir and PHF-tauPHF-1-ir neurons, and the density of amyloid-β plaques, in the CA1 region of all three patients, it seems clear that the neuropathological alterations were greater in Patient P14, followed by Patient P13 and then Patient P9.”
§ The influence of phospho-tau on dendritic spines of cortical pyramidal neurons in patients with Alzheimer’s disease > Results > Neuropathological characteristics of the injected tissue
boostedn = 3- Asserted: passes — The authors put it forward as true.
- Checkable: passes — It can be checked against evidence.
- Load-bearing: unclear — It is unclear whether the paper’s conclusions depend on it.
- Based: passes — The paper gives a reason why it holds.
- Probably not a substantial claim. 22
- It may state two separate claims as one. 30
The cited sources support only part of this claim — read each source’s verdict below.
In the paper
“In turn, the size of the postsynaptic density is correlated with the number of presynaptic vesicles, the number of postsynaptic receptors and the ready-releasable pool of transmitter (Harris and Stevens, 1989; Nusser et al., 1998; Schikorski and Stevens, 1999, 2001; Arellano et al., 2007a).”
§ The influence of phospho-tau on dendritic spines of cortical pyramidal neurons in patients with Alzheimer’s disease > Introduction
What the sources say
- Partly supportedcites Harris and Stevens, 1989 sourceExperimental — accuracy not yet measured
The Serial electron microscopy section reports that PSD area is proportional to the number of vesicles in the presynaptic axonal varicosity. The Relationships between hippocampal spine geometry and synaptic efficacy section infers that larger PSDs likely contain more receptors, but does not count them. Neither section establishes a correlation with the readily releasable transmitter pool. Page numbers are not available in the indexed passages. (LLM, conf=0.88)
- Partly supportedcites Nusser et al., 1998 sourceExperimental — accuracy not yet measured
The Figure 4 description reports a positive correlation between synapse size and AMPA-receptor immunolabeling in hippocampal synapses. The paper does not establish that postsynaptic density size correlates with presynaptic vesicle number or the readily releasable transmitter pool; its introductory mention of pool size concerns variability, not that correlation. (LLM, conf=0.87)
- Not matchedcites Schikorski and Stevens, 1999, 2001
Couldn’t be matched to a paper in Crossref, so it can’t be checked.
plaincorrelational- Asserted: passes — The authors put it forward as true.
- Checkable: passes — It can be checked against evidence.
- Load-bearing: fails — The paper’s conclusions may not depend on it.
- Based: passes — The paper gives a reason why it holds.
Probably not a substantial claim. The paper’s conclusions may not depend on it. It may state two separate claims as one.
- Partly supported
The sources with a verdict support this claim; the rest weren’t checked yet, have no full text we could read, or their verdicts aren’t rated yet.
In the paper
“Previous studies in animal models of Alzheimer’s disease have shown that amyloid-β plaques induce local morphological alterations to the dendrites in contact with amyloid-β (Tsai et al., 2004; Spires et al., 2005; Knafo et al., 2009a, b; Merino-Serrais et al., 2011).”
§ The influence of phospho-tau on dendritic spines of cortical pyramidal neurons in patients with Alzheimer’s disease > Introduction
What the sources say
- Not checked — no full text of the sourcecites Tsai et al., 2004 source
- Supportedcites Spires et al., 2005 source
The Results report that dendrites near plaques became more curved and that dendritic spine density fell most sharply near plaque edges. The Discussion describes a marked change in dendritic structure centered on plaques in the APP transgenic mice, supporting the claimed local morphological alterations. (LLM, conf=0.90)
- Not matchedcites Knafo et al., 2009a, b
Couldn’t be matched to a paper in Crossref, so it can’t be checked.
plaindirect- Asserted: passes — The authors put it forward as true.
- Checkable: passes — It can be checked against evidence.
- Load-bearing: fails — The paper’s conclusions may not depend on it.
- Based: passes — The paper gives a reason why it holds.
Probably not a substantial claim. The paper’s conclusions may not depend on it.
The cited sources support only part of this claim — read each source’s verdict below.
In the paper
“In the brain, abnormal phosphorylation of the microtubule-associated protein tau leads to the formation of paired helical filaments (PHFs), the main components of intraneuronal neurofibrillary tangles (Grundke-Iqbal et al., 1986).”
§ The influence of phospho-tau on dendritic spines of cortical pyramidal neurons in patients with Alzheimer’s disease > Introduction
What the sources say
- Partly supportedcites Grundke-Iqbal et al., 1986 sourceExperimental — accuracy not yet measured
The Abstract says the findings suggest that abnormally phosphorylated tau is a component of paired helical filaments (PHFs), and identifies neurofibrillary tangles as a major location of PHFs. It does not establish the stronger causal claim that abnormal phosphorylation leads to PHF formation. (LLM, conf=0.86)
plaindirect- Asserted: passes — The authors put it forward as true.
- Checkable: passes — It can be checked against evidence.
- Load-bearing: fails — The paper’s conclusions may not depend on it.
- Based: passes — The paper gives a reason why it holds.
Probably not a substantial claim. The paper’s conclusions may not depend on it.
- Partly supported
The cited sources support only part of this claim — read each source’s verdict below.
In the paper
“Moreover, the length of the spine neck is proportional to the extent of biochemical and electrical isolation of the spine from its parent dendrite (Majewska et al., 2000a, b; Araya et al., 2006).”
§ The influence of phospho-tau on dendritic spines of cortical pyramidal neurons in patients with Alzheimer’s disease > Introduction
What the sources say
- Not matchedcites Majewska et al., 2000a, b
Couldn’t be matched to a paper in Crossref, so it can’t be checked.
- Partly supportedcites Araya et al., 2006 sourceExperimental — accuracy not yet measured
The opening section (page unavailable) says biochemical compartmentalization occurs at spine heads because the neck creates a diffusional bottleneck. It also reports that electrical attenuation increases with neck length. It does not establish that the extent of biochemical isolation is proportional to neck length. (LLM, conf=0.87)
plaincorrelational- Asserted: passes — The authors put it forward as true.
- Checkable: passes — It can be checked against evidence.
- Load-bearing: fails — The paper’s conclusions may not depend on it.
- Based: passes — The paper gives a reason why it holds.
Probably not a substantial claim. The paper’s conclusions may not depend on it.
- Not matched
The cited sources support only part of this claim — read each source’s verdict below.
In the paper
“whereas the spine head volume is correlated with the area of the postsynaptic density.”
§ The influence of phospho-tau on dendritic spines of cortical pyramidal neurons in patients with Alzheimer’s disease > Introduction
What the sources say
- Supportedcites Harris and Stevens, 1989 source
The Serial electron microscopy section explicitly reports that PSD area was positively correlated with spine head volume. The Discussion also states that spine head dimensions are proportional to PSD area. (LLM, conf=0.95)
- Could not verifycites Nusser et al., 1998 sourceExperimental — accuracy not yet measured
The Figure 2 caption describes a large synapse on a spine and other synapses on smaller spines, but does not establish a correlation between spine-head volume and postsynaptic-density area. Searches for that correlation and for spine volume versus synaptic area found no passage in our copy that states it; page numbers were unavailable. (LLM, conf=0.70)
- Not matchedcites Schikorski and Stevens, 1999, 2001
Couldn’t be matched to a paper in Crossref, so it can’t be checked.
plaincorrelational- Asserted: passes — The authors put it forward as true.
- Checkable: passes — It can be checked against evidence.
- Load-bearing: fails — The paper’s conclusions may not depend on it.
- Based: passes — The paper gives a reason why it holds.
Probably not a substantial claim. The paper’s conclusions may not depend on it.
- Supported
The sources with a verdict support this claim; the rest weren’t checked yet, have no full text we could read, or their verdicts aren’t rated yet.
In the paper
“Second, pyramidal cells in different cortical regions have considerably distinct structures (Elston et al., 2001; Jacobs et al., 2001) and the data obtained in one region cannot necessarily be applied to another.”
§ The influence of phospho-tau on dendritic spines of cortical pyramidal neurons in patients with Alzheimer’s disease > Discussion > Methodological considerations
What the sources say
- Supportedcites Elston et al., 2001 source
The Discussion states that pyramidal cell morphology varies markedly between cortical regions, including within human cortex. That regional variation supports the caution that structural data from one region cannot necessarily be applied to another. (LLM, conf=0.91)
- Not checked — no full text of the sourcecites Jacobs et al., 2001 source
hedged- Asserted: passes — The authors put it forward as true.
- Checkable: passes — It can be checked against evidence.
- Load-bearing: unclear — It is unclear whether the paper’s conclusions depend on it.
- Based: passes — The paper gives a reason why it holds.
It may state two separate claims as one.
- Supported
The cited sources support only part of this claim — read each source’s verdict below.
In the paper
“In addition, the course such diseases take is highly variable as the neuropathological changes are not homogenous, neither among patients nor in different regions of the brain of the same patient, giving rise to variation in the alterations to cortical circuits (Garcia-Marin et al., 2009; Blazquez-Llorca et al., 2010).”
§ The influence of phospho-tau on dendritic spines of cortical pyramidal neurons in patients with Alzheimer’s disease > Discussion > Methodological considerations
What the sources say
- Partly supportedcites Garcia-Marin et al., 2009 sourceExperimental — accuracy not yet measured
Split into 2 atoms — 1 confirmed, 1 partially supported, 0 disputed, 0 misattributed, 0 unverifiable. Expand the claim to see per-atom verdicts.
- Not matchedcites Blazquez-Llorca et al., 2010
Couldn’t be matched to a paper in Crossref, so it can’t be checked.
plaindirect- Asserted: passes — The authors put it forward as true.
- Checkable: passes — It can be checked against evidence.
- Load-bearing: fails — The paper’s conclusions may not depend on it.
- Based: passes — The paper gives a reason why it holds.
Probably not a substantial claim. The paper’s conclusions may not depend on it. It may state two separate claims as one.
- Partly supported
Every source the paper cites for this claim was checked and supports it.
In the paper
“Studies on the European ground squirrel demonstrated that PHF-like phosphorylation is induced in the brain during the hibernation of these animals (Arendt et al., 2003), which is similar to the characteristic increase in tau phosphorylation (Avila et al., 2004).”
§ The influence of phospho-tau on dendritic spines of cortical pyramidal neurons in patients with Alzheimer’s disease > Discussion > Possible functional implications of the morphological changes observed
What the sources say
- Supportedcites Arendt et al., 2003 source
The Animals section identifies the study subjects as European ground squirrels. The section “Hibernation induces PHF-like phosphorylation of tau” reports enhanced detection of six PHF-like tau phosphoepitopes in cortical and hippocampal extracts during torpor. (LLM, conf=0.94)
boosteddirect- Asserted: passes — The authors put it forward as true.
- Checkable: passes — It can be checked against evidence.
- Load-bearing: fails — The paper’s conclusions may not depend on it.
- Based: passes — The paper gives a reason why it holds.
Probably not a substantial claim. The paper’s conclusions may not depend on it.
- Supported
The cited sources support only part of this claim — read each source’s verdict below.
In the paper
“Additionally, the volume of the dendritic spine head is related to the size of the postsynaptic density (Harris and Stevens, 1989; Schikorski and Stevens, 1997; Arellano et al., 2007b), the number of presynaptic vesicles, and the number of vesicles adjacent to the presynaptic cleft (Harris and Stevens, 1989).”
§ The influence of phospho-tau on dendritic spines of cortical pyramidal neurons in patients with Alzheimer’s disease > Discussion > Possible functional implications of the morphological changes observed
What the sources say
- Partly supportedcites Harris and Stevens, 1989 sourceExperimental — accuracy not yet measured
The Serial electron microscopy section reports that spine head volume correlates with postsynaptic density area and with the total number of vesicles in the presynaptic axonal varicosity. It says all vesicles in those varicosities were counted, but does not report a separate relationship for vesicles adjacent to the synaptic cleft. Page numbers are unavailable in our copy. (LLM, conf=0.88)
- Could not verifycites Schikorski and Stevens, 1997 sourceExperimental — accuracy not yet measured
The Analysis section says the authors measured spine-head volumes and PSD areas, but does not report a relationship between them. Figure 3 (Appendix; page unavailable) reports a correlation between active-zone size and PSD size instead. The presynaptic-vesicle clauses are cited to Harris and Stevens (1989), not to this paper. (LLM, conf=0.72)
- Not matchedcites Arellano et al., 2007b
Couldn’t be matched to a paper in Crossref, so it can’t be checked.
plaincorrelational- Asserted: passes — The authors put it forward as true.
- Checkable: passes — It can be checked against evidence.
- Load-bearing: passes — The paper’s conclusions depend on it.
- Based: passes — The paper gives a reason why it holds.
It may state two separate claims as one.
- Partly supported
The sources with a verdict support this claim; the rest weren’t checked yet, have no full text we could read, or their verdicts aren’t rated yet.
In the paper
“Moreover, the proximal and distal segments of basal dendrites have different characteristics with respect to integration and synaptic plasticity (Markram et al., 1997; Hausser and Mel, 2003; Gordon et al., 2006; Gelfo et al., 2009; Branco and Häusser, 2011).”
§ The influence of phospho-tau on dendritic spines of cortical pyramidal neurons in patients with Alzheimer’s disease > Discussion > Possible functional implications of the morphological changes observed
What the sources say
- Not checked — no full text of the sourcecites Markram et al., 1997 source
- Not checked — no full text of the sourcecites Hausser and Mel, 2003 source
- Supportedcites Gordon et al., 2006 source
The Discussion describes proximal and distal basal dendrites as distinct plasticity compartments: proximal inputs respond to conventional pairing, whereas distal inputs require NMDA spikes combined with BDNF for LTP. The section on spike timing-dependent plasticity also reports that synaptically evoked NMDA spikes were difficult to obtain proximally, consistent with different local integration properties. No page numbers are supplied in our copy. (LLM, conf=0.90)
plaincorrelational- Asserted: passes — The authors put it forward as true.
- Checkable: passes — It can be checked against evidence.
- Load-bearing: fails — The paper’s conclusions may not depend on it.
- Based: passes — The paper gives a reason why it holds.
Probably not a substantial claim. The paper’s conclusions may not depend on it.
The cited sources support only part of this claim — read each source’s verdict below.
In the paper
“At the cellular level, abnormal tau phosphorylation and the formation of tangles are major events in neuronal degeneration in Alzheimer’s disease (Grundke-Iqbal et al., 1986).”
§ The influence of phospho-tau on dendritic spines of cortical pyramidal neurons in patients with Alzheimer’s disease > Discussion > Patterns of paired helical filament-tau immunostaining and alterations to pyramidal cell dendrites
What the sources say
- Partly supportedcites Grundke-Iqbal et al., 1986 sourceExperimental — accuracy not yet measured
The Abstract (p. 4913) identifies neurofibrillary tangles in Alzheimer disease brain and suggests that tau in paired-helical filaments is abnormally phosphorylated. It does not establish that tangle formation and tau phosphorylation are major events in neuronal degeneration. (LLM, conf=0.84)
plaindirect- Asserted: passes — The authors put it forward as true.
- Checkable: passes — It can be checked against evidence.
- Load-bearing: passes — The paper’s conclusions depend on it.
- Based: passes — The paper gives a reason why it holds.
Probably not a substantial claim. It may state two separate claims as one.
- Partly supported
Every source the paper cites for this claim was checked and supports it.
In the paper
“Indeed, the vast majority of PHF-tauPHF-1-ir neurons had a large amount of aggregated tau, consistent with the hypothesis that PHF-tauAT8 mostly labels the initial stages of a neurofibrillar pathology, while PHF-tauPHF-1 recognizes the later stages (Blazquez-Llorca et al., 2011).”
§ The influence of phospho-tau on dendritic spines of cortical pyramidal neurons in patients with Alzheimer’s disease > Discussion > Patterns of paired helical filament-tau immunostaining and alterations to pyramidal cell dendrites
What the sources say
- Supportedcites Blazquez-Llorca et al., 2011 source
The “Evolution of the alterations to the tau protein and of the labeling of thorny excrescences” section (page not supplied) says AT8 staining is mostly associated with pre-tangle neurons and PHF-1 with neurons bearing tangles. It presents this ordering as a suggestion and cautions that the patterns may not be sequential within individual neurons, consistent with the citing sentence’s description of a hypothesis. (LLM, conf=0.93)
hedgedcorrelational- Asserted: passes — The authors put it forward as true.
- Checkable: passes — It can be checked against evidence.
- Load-bearing: unclear — It is unclear whether the paper’s conclusions depend on it.
- Based: passes — The paper gives a reason why it holds.
It may state two separate claims as one.
- Supported
The cited sources support only part of this claim — read each source’s verdict below.
In the paper
“However, neurofibrillary tangles appear to be toxic since they are associated with impaired axonal transport, which provokes cell death (Stamer et al., 2002; Terwel et al., 2002; Cente et al., 2006; Smith et al., 2007).”
§ The influence of phospho-tau on dendritic spines of cortical pyramidal neurons in patients with Alzheimer’s disease > Discussion > Possible functional implications of the morphological changes observed
What the sources say
- Partly supportedcites Stamer et al., 2002 sourceExperimental — accuracy not yet measured
The Discussion (page not provided) links elevated tau to impaired intracellular transport and suggests that resulting traffic jams may speed degeneration. It does not show that neurofibrillary tangles cause the transport defect or that the defect provokes cell death; it notes transport defects even when tau aggregates are absent or minor. (LLM, conf=0.86)
- Not checked — no full text of the sourcecites Terwel et al., 2002 source
- Not checked — no full text of the sourcecites Cente et al., 2006 source
hedgeddirect- Asserted: passes — The authors put it forward as true.
- Checkable: passes — It can be checked against evidence.
- Load-bearing: unclear — It is unclear whether the paper’s conclusions depend on it.
- Based: passes — The paper gives a reason why it holds.
It may state two separate claims as one.
- Partly supported
Every source the paper cites for this claim was checked and supports it.
In the paper
“This interpretation is also supported by a large number of researchers who study dendritic spine alterations both in humans and animal models (see Penzes et al., 2011; Spires-Jones and Knafo, 2012 for recent reviews).”
§ The influence of phospho-tau on dendritic spines of cortical pyramidal neurons in patients with Alzheimer’s disease > Discussion > Methodological considerations
What the sources say
- Supportedcites Penzes et al., 2011 source
The Abstract identifies this paper as a review of human postmortem studies and animal studies of dendritic spine alterations. Its Neuropathological studies and Animal models sections discuss evidence from both humans and animal models, supporting the citation's use as a recent review. The citing sentence does not specify what “this interpretation” is, so its substance cannot be assessed here. (LLM, conf=0.88)
- Supportedcites Spires-Jones and Knafo, 2012 source
The Introduction identifies this paper as a review of dendritic spine changes in Alzheimer’s disease models. Section 2 discusses spine loss reported in several mouse models and compares it with synapse loss in human Alzheimer’s disease. The citation identifies a relevant recent review; the citing authors’ unspecified “interpretation” is not itself attributed to this source. (LLM, conf=0.89)
plain- Asserted: passes — The authors put it forward as true.
- Checkable: passes — It can be checked against evidence.
- Load-bearing: fails — The paper’s conclusions may not depend on it.
- Based: passes — The paper gives a reason why it holds.
Probably not a substantial claim. The paper’s conclusions may not depend on it.
- Supported
A result the paper reports from its own data — it cites no other source for it, so there is none to check. The quote shows it is in the paper.
In the paper
“In the CA1 region, the total neuron density was 15 786 in Patient P9, 11 916 in Patient P13 and 12 193 in Patient P14 (neurons/mm3), and the percentage of phospho-tau neurons varied between these patients (Fig. 2 and Supplementary material).”
§ The influence of phospho-tau on dendritic spines of cortical pyramidal neurons in patients with Alzheimer’s disease > Results > Neuropathological characteristics of the injected tissue
plainn = 3- Asserted: passes — The authors put it forward as true.
- Checkable: passes — It can be checked against evidence.
- Load-bearing: unclear — It is unclear whether the paper’s conclusions depend on it.
- Based: passes — The paper gives a reason why it holds.
It may state two separate claims as one.
A result the paper reports from its own data — it cites no other source for it, so there is none to check. The quote shows it is in the paper.
In the paper
“In the parahippocampal cortex from Patient P9, all the Lucifer yellow-injected neurons analysed that were PHF-tau+ were considered to be Pattern I, whereas in the CA1 from Patients P9, P13 and P14, all the Lucifer yellow-injected neurons analysed that were PHF-tau+ were Pattern IIa.”
§ The influence of phospho-tau on dendritic spines of cortical pyramidal neurons in patients with Alzheimer’s disease > Results > Morphometric analysis of Lucifer yellow-injected neurons
plaincorrelational- Asserted: passes — The authors put it forward as true.
- Checkable: passes — It can be checked against evidence.
- Load-bearing: passes — The paper’s conclusions depend on it.
- Based: passes — The paper gives a reason why it holds.
It may state two separate claims as one.
A result the paper reports from its own data — it cites no other source for it, so there is none to check. The quote shows it is in the paper.
In the paper
“However, there were significant differences in the frequency distribution of the volume of dendritic spines for all cases, whereby small dendritic spines were more frequent in PHF-tau+ neurons than in PHF-tau− neurons (Fig. 8L, O and R).”
§ The influence of phospho-tau on dendritic spines of cortical pyramidal neurons in patients with Alzheimer’s disease > Results > Lucifer yellow-injected neurons with Pattern IIa of immunostaining for paired helical filament-tau
plaincorrelational- Asserted: passes — The authors put it forward as true.
- Checkable: passes — It can be checked against evidence.
- Load-bearing: passes — The paper’s conclusions depend on it.
- Based: passes — The paper gives a reason why it holds.
It may state two separate claims as one.
A result the paper reports from its own data — it cites no other source for it, so there is none to check. The quote shows it is in the paper.
In the paper
“In Patient P9, the total neuron density in the parahippocampal cortex was 19 560 neurons/mm3, whereas the density of PHF-tauAT8-ir and PHF-tauPHF-1-ir neurons was 2917 and 499 neurons/mm3, respectively (Fig. 2), 15% and 2.5% of the total neuronal density, respectively.”
§ The influence of phospho-tau on dendritic spines of cortical pyramidal neurons in patients with Alzheimer’s disease > Results > Neuropathological characteristics of the injected tissue
plainSingle case- Asserted: passes — The authors put it forward as true.
- Checkable: passes — It can be checked against evidence.
- Load-bearing: unclear — It is unclear whether the paper’s conclusions depend on it.
- Based: passes — The paper gives a reason why it holds.
It may state two separate claims as one.
A result the paper reports from its own data — it cites no other source for it, so there is none to check. The quote shows it is in the paper.
In the paper
“All Lucifer yellow-injected neurons that were PHF-tauAT8-ir were also PHF-tauPHF-1, whereas some Lucifer yellow-injected neurons that were non-immunostained for PHF-tauAT8 were also labelled for PHF-tauPHF-1 (Supplementary Fig. 5).”
§ The influence of phospho-tau on dendritic spines of cortical pyramidal neurons in patients with Alzheimer’s disease > Results > Morphometric analysis of Lucifer yellow-injected neurons
plaincorrelational- Asserted: passes — The authors put it forward as true.
- Checkable: passes — It can be checked against evidence.
- Load-bearing: passes — The paper’s conclusions depend on it.
- Based: passes — The paper gives a reason why it holds.
It may state two separate claims as one.
A result the paper reports from its own data — it cites no other source for it, so there is none to check. The quote shows it is in the paper.
In the paper
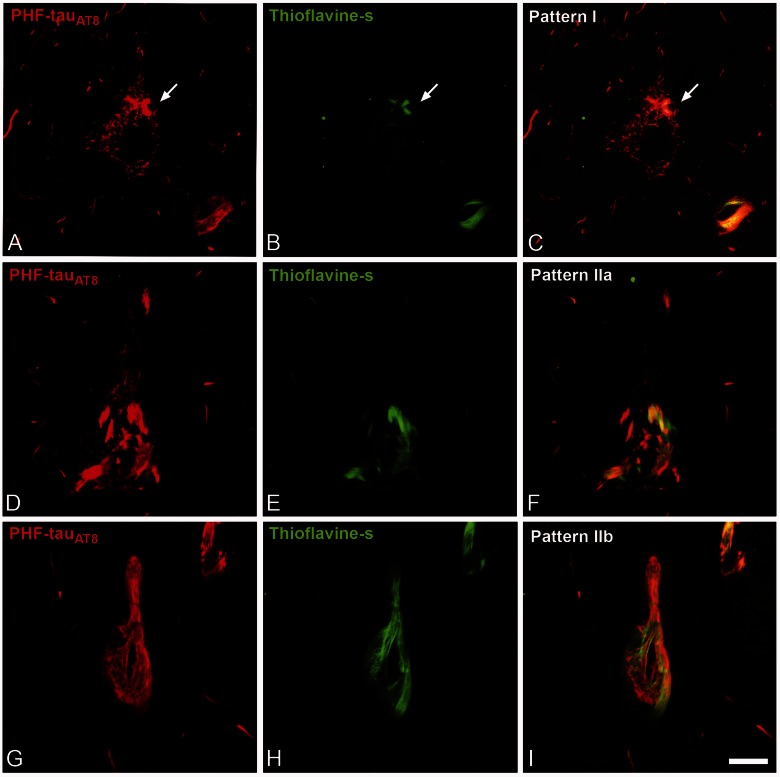
“In the present study, we further subdivided Pattern II into Patterns IIa and IIb, depending on the extent of neurofibrillary tangle development visualized with PHF-tauAT8, PHF-tauPHF-1 and thioflavin S (Pattern IIa, intermediate/advanced stages; Pattern IIb, extreme stage: Fig. 3).”
§ The influence of phospho-tau on dendritic spines of cortical pyramidal neurons in patients with Alzheimer’s disease > Results > Patterns of paired helical filament tau staining
plain- Asserted: passes — The authors put it forward as true.
- Checkable: passes — It can be checked against evidence.
- Load-bearing: fails — The paper’s conclusions may not depend on it.
- Based: passes — The paper gives a reason why it holds.
Probably not a substantial claim. The paper’s conclusions may not depend on it.
A result the paper reports from its own data — it cites no other source for it, so there is none to check. The quote shows it is in the paper.
In the paper
“The average dendritic spine length decreased significantly in Patient P9 (14%, Fig. 8B), whereas no differences were found in Patients P13 and P14 (Fig. 8E and H; Supplementary Table 2).”
§ The influence of phospho-tau on dendritic spines of cortical pyramidal neurons in patients with Alzheimer’s disease > Results > Lucifer yellow-injected neurons with Pattern IIa of immunostaining for paired helical filament-tau
plain- Asserted: passes — The authors put it forward as true.
- Checkable: passes — It can be checked against evidence.
- Load-bearing: unclear — It is unclear whether the paper’s conclusions depend on it.
- Based: passes — The paper gives a reason why it holds.
It may state two separate claims as one.
A result the paper reports from its own data — it cites no other source for it, so there is none to check. The quote shows it is in the paper.
In the paper
“The frequency distribution revealed a higher frequency of shorter dendritic spines in PHF-tau+ neurons from Patients P9 and P13 (Fig. 8C and F), whereas in Patient P14 short dendritic spines were less frequent on PHF-tau+ neurons than PHF-tau− neurons (Fig. 8I).”
§ The influence of phospho-tau on dendritic spines of cortical pyramidal neurons in patients with Alzheimer’s disease > Results > Lucifer yellow-injected neurons with Pattern IIa of immunostaining for paired helical filament-tau
plaincorrelational- Asserted: passes — The authors put it forward as true.
- Checkable: passes — It can be checked against evidence.
- Load-bearing: unclear — It is unclear whether the paper’s conclusions depend on it.
- Based: passes — The paper gives a reason why it holds.
It may state two separate claims as one.
A result the paper reports from its own data — it cites no other source for it, so there is none to check. The quote shows it is in the paper.
In the paper
“By contrast, in Patients P13 and P14 we found statistical differences between PHF-tau− and PHF-tau+ neurons in the medial/distal portions (Fig. 7C and E), and similar results were found when the data are presented as the average (Fig. 7D and F; Supplementary Table 2).”
§ The influence of phospho-tau on dendritic spines of cortical pyramidal neurons in patients with Alzheimer’s disease > Results > Lucifer yellow-injected neurons with Pattern IIa of immunostaining for paired helical filament-tau
plaincorrelational- Asserted: passes — The authors put it forward as true.
- Checkable: passes — It can be checked against evidence.
- Load-bearing: passes — The paper’s conclusions depend on it.
- Based: passes — The paper gives a reason why it holds.
It may state two separate claims as one.
A result the paper reports from its own data — it cites no other source for it, so there is none to check. The quote shows it is in the paper.
In the paper
“However, when PHF-tau+ neurons that had well developed neurofibrillary tangles (Pattern IIb) were injected, these neurons had a reduced dendritic arbor and few or virtually no dendritic spines. The dendritic diameter was also remarkably thin in all these cases (Fig. 6).”
§ The influence of phospho-tau on dendritic spines of cortical pyramidal neurons in patients with Alzheimer’s disease > Results > Morphometric analysis of Lucifer yellow-injected neurons
plaincorrelational- Asserted: passes — The authors put it forward as true.
- Checkable: passes — It can be checked against evidence.
- Load-bearing: passes — The paper’s conclusions depend on it.
- Based: passes — The paper gives a reason why it holds.
It may state two separate claims as one.
A result the paper reports from its own data — it cites no other source for it, so there is none to check. The quote shows it is in the paper.
In the paper
“Our results indicate that neurons with advanced neurofibrillary tangles display a remarkable loss of dendritic spines, which is consistent with other studies.”
§ The influence of phospho-tau on dendritic spines of cortical pyramidal neurons in patients with Alzheimer’s disease > Discussion > Possible functional implications of the morphological changes observed
hedgedcorrelational- Asserted: passes — The authors put it forward as true.
- Checkable: passes — It can be checked against evidence.
- Load-bearing: passes — The paper’s conclusions depend on it.
- Based: passes — The paper gives a reason why it holds.
It may state two separate claims as one.
A result the paper reports from its own data — it cites no other source for it, so there is none to check. The quote shows it is in the paper.
In the paper
“Importantly, the density of CA3 neurons in Patient P9 was 14 350 neurons/mm3, whereas there were only 8916 neurons/mm3 and 8447 neurons/mm3 in Patients P13 and P14, respectively (Supplementary material), suggesting that the CA3 region in the latter two patients is more pathologically affected than that of Patient P9.”
§ The influence of phospho-tau on dendritic spines of cortical pyramidal neurons in patients with Alzheimer’s disease > Discussion > Possible functional implications of the morphological changes observed
plainn = 2- Asserted: passes — The authors put it forward as true.
- Checkable: passes — It can be checked against evidence.
- Load-bearing: passes — The paper’s conclusions depend on it.
- Based: passes — The paper gives a reason why it holds.
It may state two separate claims as one.
A result the paper reports from its own data — it cites no other source for it, so there is none to check. The quote shows it is in the paper.
In the paper
“As summarized in Fig. 9, no changes were found in the number, length or volume of the dendritic spines in neurons with Pattern I, nor in dendrite diameter, whereas several significant alterations were found in neurons showing Pattern II.”
§ The influence of phospho-tau on dendritic spines of cortical pyramidal neurons in patients with Alzheimer’s disease > Discussion > Patterns of paired helical filament-tau immunostaining and alterations to pyramidal cell dendrites
plain- Asserted: passes — The authors put it forward as true.
- Checkable: passes — It can be checked against evidence.
- Load-bearing: passes — The paper’s conclusions depend on it.
- Based: passes — The paper gives a reason why it holds.
It may state two separate claims as one.
In the paper
“The dendritic spines on pyramidal cells are the main postsynaptic target of excitatory synapses in the cerebral cortex and thus, pyramidal cells are considered the principal building blocks of this structure (DeFelipe and Fariñas, 1992).”
§ The influence of phospho-tau on dendritic spines of cortical pyramidal neurons in patients with Alzheimer’s disease > Introduction
What the sources say
- Not checked — no full text of the sourcecites DeFelipe and Fariñas, 1992 source
plain- Asserted: passes — The authors put it forward as true.
- Checkable: passes — It can be checked against evidence.
- Load-bearing: fails — The paper’s conclusions may not depend on it.
- Based: passes — The paper gives a reason why it holds.
Probably not a substantial claim. The paper’s conclusions may not depend on it.
What the paper did — it cites no source for this, so there is none to check. The quote shows it is in the paper.
In the paper
“Nevertheless, it is important to mention that both PHF-tauAT8 and PHF-tauPHF-1 antibodies were produced in mouse. Thus, the labeling of neurons for both PHF-tauAT8 PHF-tauPHF-1 could be due to antibody cross-reactivity.”
§ The influence of phospho-tau on dendritic spines of cortical pyramidal neurons in patients with Alzheimer’s disease > Results > Morphometric analysis of Lucifer yellow-injected neurons
hedgedconditional- Asserted: passes — The authors put it forward as true.
- Checkable: passes — It can be checked against evidence.
- Load-bearing: fails — The paper’s conclusions may not depend on it.
- Based: passes — The paper gives a reason why it holds.
Probably not a substantial claim. The paper’s conclusions may not depend on it. It may state two separate claims as one.
None of the sources cited for this claim have been checked yet.
In the paper
“Another method involving intracellular injections of marker substances in fixed brain tissue is currently considered the best approach to visualize the dendritic spines in the human brain and is a well-established technique (Einstein, 1988; Buhl et al., 1990).”
§ The influence of phospho-tau on dendritic spines of cortical pyramidal neurons in patients with Alzheimer’s disease > Discussion > Methodological considerations
What the sources say
- Not checked — no full text of the sourcecites Einstein, 1988 source
- Not matchedcites Buhl et al., 1990
Couldn’t be matched to a paper in Crossref, so it can’t be checked.
boosted- Asserted: passes — The authors put it forward as true.
- Checkable: passes — It can be checked against evidence.
- Load-bearing: passes — The paper’s conclusions depend on it.
- Based: passes — The paper gives a reason why it holds.
It may state two separate claims as one.
A conclusion the paper draws from its own results — it cites no other source for it, so there is none to check. The quote shows it is in the paper.
In the paper
“This result is suggestive of a local toxic effect, since the density of dendritic spines in the pre-terminal dendritic segment was similar to that found in dendrites lacking PHF-tauAT8.”
§ The influence of phospho-tau on dendritic spines of cortical pyramidal neurons in patients with Alzheimer’s disease > Results > Other morphological alterations
hedgedconditionalSingle case- Asserted: passes — The authors put it forward as true.
- Checkable: passes — It can be checked against evidence.
- Load-bearing: passes — The paper’s conclusions depend on it.
- Based: passes — The paper gives a reason why it holds.
It may state two separate claims as one.
What the paper did — it cites no source for this, so there is none to check. The quote shows it is in the paper.
In the paper
“In addition, it is not possible to know which neurons have developed a neurofibrillar pathology before injection and hence, the proportion of cells showing a neurofibrillar pathology is rather unpredictable.”
§ The influence of phospho-tau on dendritic spines of cortical pyramidal neurons in patients with Alzheimer’s disease > Discussion > Methodological considerations
plain- Asserted: passes — The authors put it forward as true.
- Checkable: passes — It can be checked against evidence.
- Load-bearing: passes — The paper’s conclusions depend on it.
- Based: passes — The paper gives a reason why it holds.
It may state two separate claims as one.
What the paper did — it cites no source for this, so there is none to check. The quote shows it is in the paper.
In the paper
“Third, the morphological alterations observed in human pathological tissue are very difficult to interpret due to the high interindividual variability (sex, age, medical treatment, etc.), factors that could affect brain structure.”
§ The influence of phospho-tau on dendritic spines of cortical pyramidal neurons in patients with Alzheimer’s disease > Discussion > Methodological considerations
plain- Asserted: passes — The authors put it forward as true.
- Checkable: fails — It may be too vague to check against evidence.
- Load-bearing: fails — The paper’s conclusions may not depend on it.
- Based: passes — The paper gives a reason why it holds.
Probably not a substantial claim. It may be too vague to check against evidence. The paper’s conclusions may not depend on it.
In the paper
“Neurons with Pattern II typically form neurofibrillary tangles (tangle stage).”
§ The influence of phospho-tau on dendritic spines of cortical pyramidal neurons in patients with Alzheimer’s disease > Results > Patterns of paired helical filament tau staining
What the sources say
- Not matchedcites Blazquez-Llorca et al., 2010
Couldn’t be matched to a paper in Crossref, so it can’t be checked.
plaincorrelational- Asserted: passes — The authors put it forward as true.
- Checkable: passes — It can be checked against evidence.
- Load-bearing: fails — The paper’s conclusions may not depend on it.
- Based: passes — The paper gives a reason why it holds.
Probably not a substantial claim. The paper’s conclusions may not depend on it.
- Not matched
A conclusion the paper draws from its own results — it cites no other source for it, so there is none to check. The quote shows it is in the paper.
In the paper
“Finally, Lucifer yellow-injected neurons with Pattern IIb (with well-developed neurofibrillary tangles) had a relatively small dendritic tree, with thin dendrites and very few or no spines, which may simply be due to a more advanced stage of atrophy.”
§ The influence of phospho-tau on dendritic spines of cortical pyramidal neurons in patients with Alzheimer’s disease > Discussion > Possible functional implications of the morphological changes observed
hedgedconditional- Asserted: passes — The authors put it forward as true.
- Checkable: passes — It can be checked against evidence.
- Load-bearing: fails — The paper’s conclusions may not depend on it.
- Based: passes — The paper gives a reason why it holds.
Probably not a substantial claim. The paper’s conclusions may not depend on it.
In the paper
“Furthermore, changes in the denervation/reinnervation of CA3 pyramidal neurons by mossy fibres were also found during hibernation/arousal (Popov and Bocharova, 1992) and they were associated with a reversible PHF-like phosphorylation of tau over a similar time course.”
§ The influence of phospho-tau on dendritic spines of cortical pyramidal neurons in patients with Alzheimer’s disease > Discussion > Possible functional implications of the morphological changes observed
What the sources say
- Not checked — no full text of the sourcecites Popov and Bocharova, 1992 source
plaincorrelational- Asserted: passes — The authors put it forward as true.
- Checkable: passes — It can be checked against evidence.
- Load-bearing: fails — The paper’s conclusions may not depend on it.
- Based: passes — The paper gives a reason why it holds.
Probably not a substantial claim. The paper’s conclusions may not depend on it. It may state two separate claims as one.
A claim is checked only against the cited paper’s full text, never its abstract, and none is available for its sources.
In the paper
“For example, the synaptic connections of axons that arise within the same cortical column in the neocortex preferentially innervate the proximal basal dendrites of pyramidal cells (Markram et al., 1997; Feldmeyer et al., 2002).”
§ The influence of phospho-tau on dendritic spines of cortical pyramidal neurons in patients with Alzheimer’s disease > Discussion > Possible functional implications of the morphological changes observed
What the sources say
plaincorrelational- Asserted: passes — The authors put it forward as true.
- Checkable: passes — It can be checked against evidence.
- Load-bearing: fails — The paper’s conclusions may not depend on it.
- Based: passes — The paper gives a reason why it holds.
Probably not a substantial claim. The paper’s conclusions may not depend on it.
A conclusion the paper draws from its own results — it cites no other source for it, so there is none to check. The quote shows it is in the paper.
In the paper
“These observations suggest that neurons in a putative pre-tangle stage or with neurofibrillary tangles in intermediate stages may not be affected (or they may be only slightly affected) or they may be in a reversible state.”
§ The influence of phospho-tau on dendritic spines of cortical pyramidal neurons in patients with Alzheimer’s disease > Discussion > Possible functional implications of the morphological changes observed
hedged- Asserted: passes — The authors put it forward as true.
- Checkable: passes — It can be checked against evidence.
- Load-bearing: passes — The paper’s conclusions depend on it.
- Based: passes — The paper gives a reason why it holds.
It may state two separate claims as one.
A claim is checked only against the cited paper’s full text, never its abstract, and none is available for its sources.
In the paper
“In animal models, changes in the neck length of dendritic spines affects the temporal compartmentalization of calcium and other second messengers, changes that may affect the induction of long-term potentiation (Yuste, 2010; Bloodgood and Sabatini, 2005).”
§ The influence of phospho-tau on dendritic spines of cortical pyramidal neurons in patients with Alzheimer’s disease > Discussion > Possible functional implications of the morphological changes observed
What the sources say
hedgedconditional- Asserted: passes — The authors put it forward as true.
- Checkable: passes — It can be checked against evidence.
- Load-bearing: fails — The paper’s conclusions may not depend on it.
- Based: passes — The paper gives a reason why it holds.
Probably not a substantial claim. The paper’s conclusions may not depend on it. It may state two separate claims as one.
A conclusion the paper draws from its own results — it cites no other source for it, so there is none to check. The quote shows it is in the paper.
In the paper
“This may be a suitable marker for the initial steps of degeneration, as increased tau aggregation can subsequently be found in some neurons and it can be readily visualized with the PHF-1 tau antibody (PHF-tauPHF-1).”
§ The influence of phospho-tau on dendritic spines of cortical pyramidal neurons in patients with Alzheimer’s disease > Discussion > Patterns of paired helical filament-tau immunostaining and alterations to pyramidal cell dendrites
hedgedconditional- Asserted: passes — The authors put it forward as true.
- Checkable: passes — It can be checked against evidence.
- Load-bearing: unclear — It is unclear whether the paper’s conclusions depend on it.
- Based: passes — The paper gives a reason why it holds.
It may state two separate claims as one.
A conclusion the paper draws from its own results — it cites no other source for it, so there is none to check. The quote shows it is in the paper.
In the paper
“These observations suggest that cellulipetal disconnection may occur and that the functional consequences of such a process are likely to be selective and progressive in the cerebral cortex as a whole, at least at the cellular level.”
§ The influence of phospho-tau on dendritic spines of cortical pyramidal neurons in patients with Alzheimer’s disease > Discussion > Possible functional implications of the morphological changes observed
hedgedconditional- Asserted: passes — The authors put it forward as true.
- Checkable: unclear — It is unclear whether it could be checked against evidence.
- Load-bearing: unclear — It is unclear whether the paper’s conclusions depend on it.
- Based: passes — The paper gives a reason why it holds.
It may state two separate claims as one.
In the paper
“This is not only evident for the proximal, intermediate and distal dendrites of pyramidal neurons in the hippocampus, where neurons in all cornu ammonis fields establish different types of synaptic contacts in each strata that they traverse (Andersen et al., 2007), but it may also occur in other cortical regions.”
§ The influence of phospho-tau on dendritic spines of cortical pyramidal neurons in patients with Alzheimer’s disease > Discussion > Possible functional implications of the morphological changes observed
What the sources say
- Not matchedcites Andersen et al., 2007
Couldn’t be matched to a paper in Crossref, so it can’t be checked.
hedgedconditional- Asserted: passes — The authors put it forward as true.
- Checkable: passes — It can be checked against evidence.
- Load-bearing: fails — The paper’s conclusions may not depend on it.
- Based: passes — The paper gives a reason why it holds.
Probably not a substantial claim. The paper’s conclusions may not depend on it.
- Not matched
A conclusion the paper draws from its own results — it cites no other source for it, so there is none to check. The quote shows it is in the paper.
In the paper
“Therefore, the morphology of a dendritic spine determines its synaptic strength and learning rules.”
§ The influence of phospho-tau on dendritic spines of cortical pyramidal neurons in patients with Alzheimer’s disease > Discussion > Possible functional implications of the morphological changes observed
plaindirect- Asserted: passes — The authors put it forward as true.
- Checkable: passes — It can be checked against evidence.
- Load-bearing: passes — The paper’s conclusions depend on it.
- Based: passes — The paper gives a reason why it holds.
It may state two separate claims as one.
In the paper
“This is not only evident for the proximal, intermediate and distal dendrites of pyramidal neurons in the hippocampus, where neurons in all cornu ammonis fields establish different types of synaptic contacts in each strata that they traverse (Andersen et al., 2007), but it may also occur in other cortical regions.”
§ The influence of phospho-tau on dendritic spines of cortical pyramidal neurons in patients with Alzheimer’s disease > Discussion > Possible functional implications of the morphological changes observed
What the sources say
- Not matchedcites Andersen et al., 2007
Couldn’t be matched to a paper in Crossref, so it can’t be checked.
plain- Asserted: passes — The authors put it forward as true.
- Checkable: passes — It can be checked against evidence.
- Load-bearing: fails — The paper’s conclusions may not depend on it.
- Based: passes — The paper gives a reason why it holds.
Probably not a substantial claim. The paper’s conclusions may not depend on it.
- Not matched
In the paper
“This sequential loss of dendritic spines appears to be distinct to that found in the presence of amyloid-β plaques, where the dendritic regions close to the extracellular plaques are depleted of dendritic spines irrespective of whether they are proximal or distal to the soma (Knafo et al., 2009a).”
§ The influence of phospho-tau on dendritic spines of cortical pyramidal neurons in patients with Alzheimer’s disease > Discussion > Patterns of paired helical filament-tau immunostaining and alterations to pyramidal cell dendrites
What the sources say
- Not matchedcites Knafo et al., 2009a
Couldn’t be matched to a paper in Crossref, so it can’t be checked.
hedgedcorrelational- Asserted: passes — The authors put it forward as true.
- Checkable: passes — It can be checked against evidence.
- Load-bearing: passes — The paper’s conclusions depend on it.
- Based: passes — The paper gives a reason why it holds.
It may state two separate claims as one.
- Not matched
A conclusion the paper draws from its own results — it cites no other source for it, so there is none to check. The quote shows it is in the paper.
In the paper
“Such variation could reflect different steps in the process of neuronal degeneration.”
§ The influence of phospho-tau on dendritic spines of cortical pyramidal neurons in patients with Alzheimer’s disease > Discussion > Patterns of paired helical filament-tau immunostaining and alterations to pyramidal cell dendrites
hedgedconditional- Asserted: passes — The authors put it forward as true.
- Checkable: fails — It may be too vague to check against evidence.
- Load-bearing: fails — The paper’s conclusions may not depend on it.
- Based: fails — The paper may give no reason why it holds.
Probably not a substantial claim. It may be too vague to check against evidence. The paper’s conclusions may not depend on it. The paper may give no reason why it holds.
The paper relies on this without support.
Loss of synapses leads to cognitive decline in Alzheimer’s disease.
“the presence of PHF-tau is likely to be involved in the changes to dendritic spines and the loss of synapses that leads to cognitive decline in Alzheimer’s disease.”
The paper relies on this without support.
Lower density of neurons in CA3 indicates more advanced CA3 pathology.
“the density of neurons in the CA3 was lower in these latter patients than in Patient P9 (38% and 42% fewer neurons, respectively), suggesting that the CA3 pathology was more advanced in these patients than in Patient P9”
The authors state this as an assumption.
One spine corresponds to one excitatory synapse.
“Assuming the hypothesis that one spine corresponds to one excitatory synapses (Arellano et al., 2007b)”
The authors state this as an assumption.
The majority of dendritic spines establish synapses.
“Assuming that the majority of the dendritic spines establish synapses (Arellano et al., 2007b)”
The authors state this as an assumption.
Neuronal degeneration and atrophy is progressive.
“if we assume the widely accepted hypothesis that neuronal degeneration and atrophy is progressive”
Claims other papers make about this one
Each is checked against this paper’s own text: does it say what the citing paper says it does?
The source backs part of the claim, not all of it — or backs it for a different population, condition or comparison.
In the citing paper
“Toxic species of aggregated tau affect pyramidal‐cell dendritic complexity 10 , 16 even before axonal aggregation. 10”
From Alzheimer's disease and its progression reduce pyramidal cell gain and connectivity (2025) · cites this paper as [16]
Experimental — accuracy not yet measuredThe cited source says what the claim attributes to it.
In the citing paper
“The effect of aggregated tau on cognition in part results from synaptic toxicity and dendritic de‐arborization of pyramidal cells. 16 , 17”
From Alzheimer's disease and its progression reduce pyramidal cell gain and connectivity (2025) · cites this paper as [16]
Self-check
Percentages, sums and reported differences re-computed from the paper’s own numbers.
Each contradiction between two passages listed here was confirmed by an independent check.
Rated major: it would touch a result — a value a result rests on, reported and recomputed p-values on opposite sides of the significance level, two passages that conflict with no sign which is right, or a cited work retracted before this paper was published.
In the paper
“We analysed six, five and five dendrites from different PHF-tau− neurons and nine, eight and six dendrites from different PHF-tau+ neurons in Patients P9, P13 and P14, respectively”
§ The influence of phospho-tau on dendritic spines of cortical pyramidal neurons in patients with Alzheimer’s disease > Results > Lucifer yellow-injected neurons with Pattern IIa of immunostaining for paired helical filament-tau
Reported 40 · recomputed 43
Rated minor: it would not touch a result — a value no result rests on, a p-value that stays on the same side of the significance level, or a conflict that is clerical, resolved elsewhere in the paper, or outside its own findings.
In the paper
§ The influence of phospho-tau on dendritic spines of cortical pyramidal neurons in patients with Alzheimer’s disease > Results > Lucifer yellow-injected neurons with Pattern IIa of immunostaining for paired helical filament-tau
“Of the 40, 62 and 48 neurons in the CA1 of Patients P9, P13 and P4 injected with Lucifer yellow”
§ The influence of phospho-tau on dendritic spines of cortical pyramidal neurons in patients with Alzheimer’s disease > Results > Lucifer yellow-injected neurons with Pattern IIa of immunostaining for paired helical filament-tau
“We analysed six, five and five dendrites from different PHF-tau− neurons and nine, eight and six dendrites from different PHF-tau+ neurons in Patients P9, P13 and P14, respectively”
Rated minor: it would not touch a result — a value no result rests on, a p-value that stays on the same side of the significance level, or a conflict that is clerical, resolved elsewhere in the paper, or outside its own findings.
In the paper
§ The influence of phospho-tau on dendritic spines of cortical pyramidal neurons in patients with Alzheimer’s disease > Results > Lucifer yellow-injected neurons with Pattern IIa of immunostaining for paired helical filament-tau
“changes in the morphology of dendritic spines (smaller volume and shorter length) in all patients”
§ The influence of phospho-tau on dendritic spines of cortical pyramidal neurons in patients with Alzheimer’s disease > Results > Lucifer yellow-injected neurons with Pattern IIa of immunostaining for paired helical filament-tau
“whereas in Patient P14 short dendritic spines were less frequent on PHF-tau+ neurons than PHF-tau− neurons”
Citations
Cites
Neuropathological stageing of Alzheimer-related changes.
Braak, H., & Braak, E. (1991) · Acta Neuropathologica · doi:10.1007/bf00308809 · Cited by 16,123
Mirra, S. S., Heyman, A., McKeel, D., Sumi, S. M., Crain, B. J., Brownlee, L. M., Vogel, F. S., Hughes, J. P., Belle, G. V., Berg, L., et al. (1991) · Neurology · doi:10.1212/wnl.41.4.479 · Cited by 4,961
Terry, R. D., Masliah, E., Salmon, D. P., Butters, N., DeTeresa, R., Hill, R., Hansen, L. A., & Katzman, R. (1991) · Annals of Neurology · doi:10.1002/ana.410300410 · Cited by 4,397
Handbook of Chemical Neuroanatomy
Stern, C. D. (1986) · Neurochemistry International · doi:10.1016/0197-0186(86)90021-5 · Cited by 4,160
Grundke-Iqbal, I., Iqbal, K., Tung, Y. C., Quinlan, M., Wisniewski, H. M., & Binder, L. I. (1986) · Proceedings of the National Academy of Sciences · doi:10.1073/pnas.83.13.4913 · Cited by 3,676
Consortium to Establish a Registry for Alzheimer's Disease (CERAD)
Fillenbaum, G., & Heyman, A. (2002) · doi:10.1002/0470846410.ch42(iii · Cited by 2,859
Tau Suppression in a Neurodegenerative Mouse Model Improves Memory Function
SantaCruz, K., Lewis, J., Spires, T., Paulson, J., Kotilinek, L., Ingelsson, M., Guimaraes, A., DeTure, M., Ramsden, M., McGowan, E., et al. (2005) · Science · doi:10.1126/science.1113694 · Cited by 2,014
Pyramidal neurons: dendritic structure and synaptic integration
Spruston, N. (2008) · Nature Reviews Neuroscience · doi:10.1038/nrn2286 · Cited by 1,688
Dendritic spine pathology in neuropsychiatric disorders
Penzes, P., Cahill, M. E., Jones, K. A., VanLeeuwen, J.-E., & Woolfrey, K. M. (2011) · Nature Neuroscience · doi:10.1038/nn.2741 · Cited by 1,523
Influence of dendritic structure on firing pattern in model neocortical neurons
Mainen, Z. F., & Sejnowski, T. J. (1996) · Nature · doi:10.1038/382363a0 · Cited by 1,231
Research works printed but not linked: 1
- Buhl, 1990, Intracellular injection of neurons in fixed brain tissue combined with other neuroanatomical techniques at the light- and electron- microscopic level, 273
Cited by
Sorted by citations
Arendt, T., Stieler, J. T., & Holzer, M. (2016) · Brain Research Bulletin · doi:10.1016/j.brainresbull.2016.08.018 · Cited by 609
Tau Protein Modifications and Interactions: Their Role in Function and Dysfunction
Mietelska‐Porowska, A., Wasik, U., Goras, M., Filipek, A., & Niewiadomska, G. (2014) · International Journal of Molecular Sciences · doi:10.3390/ijms15034671 · Cited by 431
Amyloid-β and tau complexity — towards improved biomarkers and targeted therapies
Polanco, J. C., Li, C., Bodea, L., Martínez‐Mármol, R., Meunier, F. A., & Götz, J. (2017) · Nature Reviews Neurology · doi:10.1038/nrneurol.2017.162 · Cited by 386
Alquezar, C., Arya, S., & Kao, A. W. (2021) · Frontiers in Neurology · doi:10.3389/fneur.2020.595532 · Cited by 367
Hypothesis: Tau pathology is an initiating factor in sporadic Alzheimer's disease
Arnsten, A. F. T., Datta, D., Del Tredici, K., & Braak, H. (2021) · Alzheimer's & Dementia · doi:10.1002/alz.12192 · Cited by 361
Metadata
- Authors
- Merino-Serrais, P., Benavides-Piccione, R., Blazquez-Llorca, L., Kastanauskaite, A., Rábano, A., Avila, J., & DeFelipe, J.
- Affiliations
- Consejo Superior de Investigaciones Científicas (ES)
- Fundacion Centro De Investigacion De Enfermedades Neurologicas (ES)
- Corresponding author
- DeFelipe, Javier
- Venue
- Brain
- Publisher
- Oxford University Press (OUP)
- Published
- 2013-05-28
- Volume
- 136
- Issue
- 6
- Pages
- 1913-1928
- ISSN
- 0006-8950 (ISSN-L)
- 1460-2156
- PMC
- PMC3673457
- OpenAlex
- W2121418448
- Cited by
- 134
- References
- 91
- Citations by year
- 2026: 3 · 2025: 9 · 2024: 6 · 2023: 15 · 2022: 10 · 2021: 13 · 2020: 17 · 2019: 8 · 2018: 7 · 2017: 16 · 2016: 8 · 2015: 10 · 2014: 10 · 2013: 2
- FWCI
- 6.96
- Type
- journal article
- Language
- en
- Open access
- hybrid
- doi.org
- Licence
- cc-by-nc
- Locations
- Brain (publishedVersion, cc-by-nc)
- Europe PMC (PubMed Central) (publishedVersion, cc-by-nc)
- PubMed Central (publishedVersion, cc-by-nc)
- PubMed (publishedVersion)
- DIGITAL.CSIC (Spanish National Research Council (CSIC)) (submittedVersion, cc-by-nc)
- Funders
- Ministerio de Economía y Competitividad
- Topics
- Life Sciences › Neuroscience › Cellular and Molecular Neuroscience › Alzheimer's disease research and treatments
- Life Sciences › Neuroscience › Cellular and Molecular Neuroscience › Neuroscience and Neuropharmacology Research
- Health Sciences › Medicine › Psychiatry and Mental health › Dementia and Cognitive Impairment Research
- Keywords
- Alzheimer's disease, tau phosphorylation, phosphorylated tau, dendritic spines, pyramidal neurons, neurofibrillary tangles, parahippocampal cortex, CA1, postsynaptic structures, cognitive impairment
- MeSH terms
- Alzheimer Disease, Cell Count, Cerebral Cortex, Humans, Phosphorylation, tau Proteins, Pyramidal Cells, Dendritic Spines
About these checks
Registry, retraction, Cites and statistics results are computed, not judged, with one exception: a printed reference that no index lists is read once by a model before it counts as a citation error. Claims are extracted by a model and kept only when their quote appears verbatim in the text; each cited source is then checked, with a model’s help, for whether it says what the claim relies on. Those verdicts can be wrong — read the claim’s quote and the cited source before relying on one.
A language model drew the claims from the paper on 2026-11-02, under version 3 of the claim definition (model deepseek-v4.1-flash, prompt extract-v3).
A second model labelled each claim on 2026-11-02 (model jev-1.13-20260917, definition revision gold-guideline-v0.2).
Cited sources are checked with a language model’s help (gpt-6-sol).
Statistics and arithmetic are recomputed, not judged.
Confidence bands are shown only for fields calibrated on our annotated test set. None is calibrated yet, so no band is shown.
What counts as a claim ›How we measure confidence ›How we check this ›
Are you an author, or do you see a problem with this page? Request a review
