

The DOI matches its Crossref record; 5 of the 5 references it cites were found in a registry or an index.
Common signatures of differential microRNA expression in Parkinson’s and Alzheimer’s disease brains
Published version of a preprint
Abstract
Dysregulation of microRNA gene expression has been implicated in many neurodegenerative diseases, including Parkinson’s disease. However, the individual dysregulated microRNAs remain largely unknown. Previous meta-analyses have highlighted several microRNAs being differentially expressed in post-mortem Parkinson’s disease and Alzheimer's disease brains versus controls, but they were based on small sample sizes. In this study, we quantified the expression of the most compelling Parkinson’s and Alzheimer’s disease microRNAs from these meta-analyses (‘candidate miRNAs’) in one of the largest Parkinson’s/Alzheimer’s disease case–control post-mortem brain collections available (n = 451), thereby quadruplicating previously investigated sample sizes. Parkinson’s disease candidate microRNA hsa-miR-132-3p was differentially expressed in our Parkinson’s (P = 4.89E−06) and Alzheimer’s disease samples (P = 3.20E−24) compared with controls. Alzheimer’s disease candidate microRNAs hsa-miR-132-5p (P = 4.52E−06) and hsa-miR-129-5p (P = 0.0379) were differentially expressed in our Parkinson’s disease samples. Combining these novel data with previously published data substantially improved the statistical support (α = 3.85E−03) of the corresponding meta-analyses, clearly implicating these microRNAs in both Parkinson’s and Alzheimer’s disease. Furthermore, hsa-miR-132-3p/-5p (but not hsa-miR-129-5p) showed association with α-synuclein neuropathological Braak staging (P = 3.51E−03/P = 0.0117), suggesting that hsa-miR-132-3p/-5p play a role in α-synuclein aggregation beyond the early disease phase. Our study represents the largest independent assessment of recently highlighted candidate microRNAs in Parkinson’s and Alzheimer’s disease brains, to date. Our results implicate hsa-miR-132-3p/-5p and hsa-miR-129-5p to be differentially expressed in both Parkinson’s and Alzheimer’s disease, pinpointing shared pathogenic mechanisms across these neurodegenerative diseases. Intriguingly, based on publicly available high-throughput sequencing of RNA isolated by cross-linking immunoprecipitation data, hsa-miR-132 may interact with SNCA messenger RNA in the human brain, possibly pinpointing novel therapeutic approaches in fighting Parkinson’s disease.
Overview
The claims and statistics of this paper haven’t been checked yet.
Run the check — free, no account needed. It reads the open-access text and checks the sources it cites.
Integrity signals
Registry
Cites
Statistics
Figures
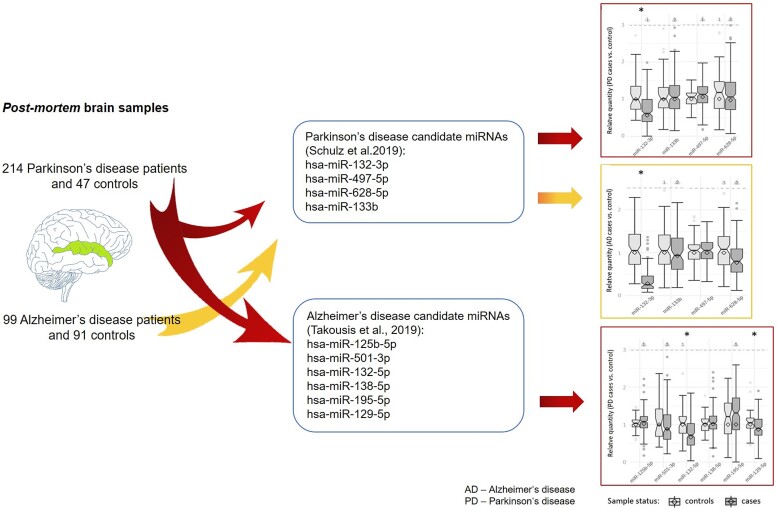
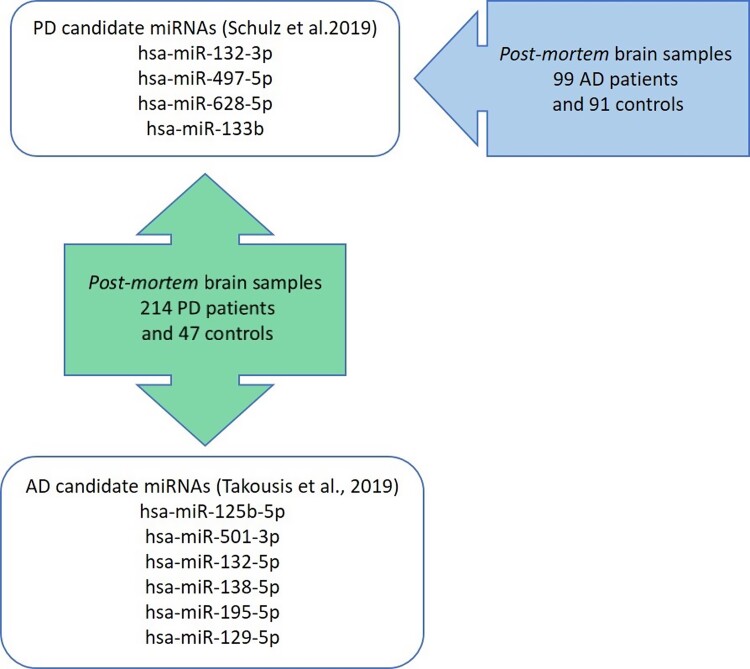
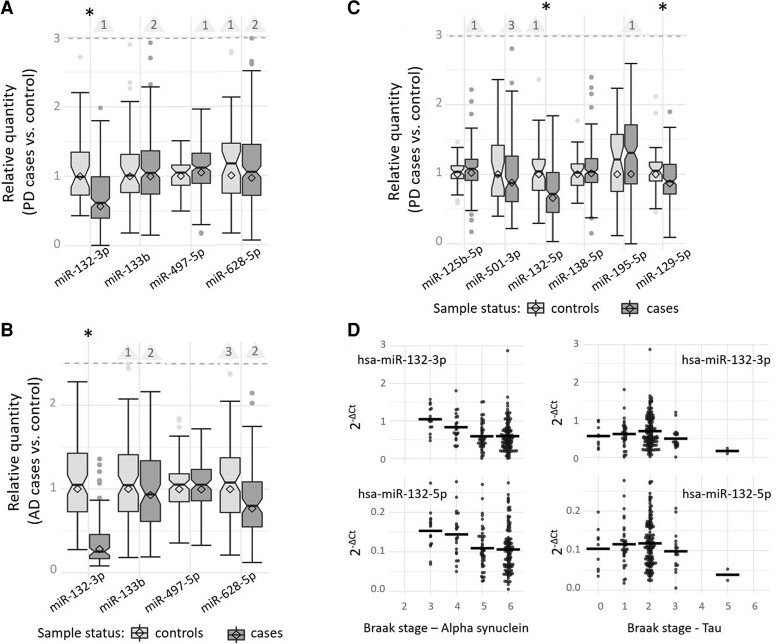
Verification
Claims the paper makes
The claims and statistics of this paper haven’t been checked yet.
Run the check — free, no account needed. It reads the open-access text and checks the sources it cites.
Claims other papers make about this one
Each is checked against this paper’s own text: does it say what the citing paper says it does?
The source backs part of the claim, not all of it — or backs it for a different population, condition or comparison.
In the citing paper
“Dysregulation of miRs has been observed in various neurodegenerative and neuropsychiatric diseases, including Alzheimer’s disease (AD), Parkinson’s disease (PD), amyotrophic lateral sclerosis (ALS), schizophrenia, and depression [13–19].”
From A role for astrocytic miR-129-5p in frontotemporal dementia (2025) · cites this paper as [16]
Experimental — accuracy not yet measuredIn the citing paper
“Another study reported decreased levels of miR-129-5p in postmortem brains from PD patients [16].”
From A role for astrocytic miR-129-5p in frontotemporal dementia (2025) · cites this paper as [16]
Self-check
Percentages, sums and reported differences re-computed from the paper’s own numbers.
The self-check needs the paper’s full text.
Citations
Cites
Neuropathological stageing of Alzheimer-related changes.
Braak, H., & Braak, E. (1991) · Acta Neuropathologica · doi:10.1007/bf00308809 · Cited by 16,123
Dorsey, E. R., Elbaz, A., Nichols, E., Abbasi, N., Abd-Allah, F., Abdelalim, A., Adsuar, J. C., Ansha, M. G., Brayne, C., Choi, J.-Y. J., et al. (2018) · The Lancet Neurology · doi:10.1016/s1474-4422(18)30295-3 · Cited by 2,816
Alafuzoff, I., Arzberger, T., Al‐Sarraj, S., Bodi, I., Bogdanovic, N., Braak, H., Bugiani, O., Del‐Tredici, K., Ferrer, I., Gelpi, E., et al. (2008) · Brain Pathology · doi:10.1111/j.1750-3639.2008.00147.x · Cited by 467
Transcriptome-wide Discovery of microRNA Binding Sites in Human Brain
Boudreau, R. L., Jiang, P., Gilmore, B. L., Spengler, R. M., Tirabassi, R., Nelson, J. A., Ross, C. A., Xing, Y., & Davidson, B. L. (2014) · Neuron · doi:10.1016/j.neuron.2013.10.062 · Cited by 217
MiRNA Profile in the Substantia Nigra of Parkinson’s Disease and Healthy Subjects
Cardo, L. F., Coto, E., Ribacoba, R., Menéndez, M., Moris, G., Suárez, E., & Alvarez, V. (2014) · Journal of Molecular Neuroscience · doi:10.1007/s12031-014-0428-y · Cited by 75
Research works printed but not linked: 26
- de Lau, 2006, Epidemiology of Parkinson’s disease, Lancet Neurol, 5, 525, 10.1016/S1474-4422(06)70471-9 · DOI · Paper page
- Lill, 2016, Genetics of Parkinson’s disease, Mol Cell Probes, 30, 386, 10.1016/j.mcp.2016.11.001 · DOI
- Nalls, 2019, Identification of novel risk loci, causal insights, and heritable risk for Parkinson’s disease: A meta-analysis of genome-wide association studies, Lancet Neurol, 18, 1091, 10.1016/S1474-4422(19)30320-5 · DOI · Paper page
- Noyce, 2012, Meta-analysis of early nonmotor features and risk factors for Parkinson disease, Ann Neurol, 72, 893, 10.1002/ana.23687 · DOI
- Labbe, 2016, Epigenetic regulation in Parkinson ‘s disease, Acta Neuropathol, 132, 515, 10.1007/s00401-016-1590-9 · DOI
- Bartel, 2018, Metazoan microRNAs, Cell, 173, 20, 10.1016/j.cell.2018.03.006 · DOI · Paper page
- Kuo, 2021, The role of noncoding RNAs in Parkinson’s disease: Biomarkers and associations with pathogenic pathways, J Biomed Sci, 28, 78, 10.1186/s12929-021-00775-x · DOI
- Evans, 2021, Parkinson’s disease and microRNAs—Lessons from model organisms and human studies, Exp Gerontol, 155, 111585, 10.1016/j.exger.2021.111585 · DOI
- Schulz, 2019, Meta-analyses identify differentially expressed microRNAs in Parkinson’s disease, Ann Neurol, 85, 835, 10.1002/ana.25490 · DOI
- Takousis, 2019, Differential expression of microRNAs in Alzheimer’s disease brain, blood, and cerebrospinal fluid, Alzheimers Dement, 15, 1468, 10.1016/j.jalz.2019.06.4952 · DOI · Paper page
- Dobricic, 2022, Differential microRNA expression analyses across two brain regions in Alzheimer’s disease, Transl Psychiatry, 12, 352, 10.1038/s41398-022-02108-4 · DOI · Paper page
- Guimarães, 2017, Pattern of reduced functional connectivity and structural abnormalities in Parkinson’s disease: An exploratory study, Front Neurol, 7, 1
- Haroutunian, 2009, Transcriptional vulnerability of brain regions in Alzheimer’s disease and dementia, Neurobiol Aging, 30, 561, 10.1016/j.neurobiolaging.2007.07.021 · DOI
- Alafuzoff, 2009, Staging/typing of Lewy body related alpha-synuclein pathology: A study of the BrainNet Europe Consortium, Acta Neuropathol, 117, 635, 10.1007/s00401-009-0523-2 · DOI
- Roth, 1986, CAMDEX. A standardised instrument for the diagnosis of mental disorder in the elderly with special reference to the early detection of dementia, Br J Psychiatry, 149, 698, 10.1192/bjp.149.6.698 · DOI · Paper page
- Mirra, 1991, The Consortium to Establish a Registry for Alzheimer’s Disease (CERAD). Part II. Standardization of the neuropathologic assessment of Alzheimer’s disease, Neurology, 41, 479, 10.1212/WNL.41.4.479 · DOI · Paper page
- Hyman, 2012, National Institute on Aging-Alzheimer’s Association guidelines for the neuropathologic assessment of Alzheimer’s disease, Alzheimers Dement, 8, 1, 10.1016/j.jalz.2011.10.007 · DOI · Paper page
- Bellenguez, 2022, New insights into the genetic etiology of Alzheimer’s disease and related dementias, Nat Genet, 54, 412, 10.1038/s41588-022-01024-z · DOI · Paper page
- Xing, 2020, Down regulation of miR-218, miR-124, and miR-144 relates to Parkinson’s disease via activating NF-κB signaling, Kaohsiung J Med Sci, 36, 786, 10.1002/kjm2.12241 · DOI
- Schulze, 2018, Sporadic Parkinson’s disease derived neuronal cells show disease-specific mRNA and small RNA signatures with abundant deregulation of piRNAs, Acta Neuropathol Commun, 6, 58, 10.1186/s40478-018-0561-x · DOI
- Wanet, 2012, MiR-212/132 expression and functions: Within and beyond the neuronal compartment, Nucleic Acids Res, 40, 4742, 10.1093/nar/gks151 · DOI
- Gillardon, 2008, MicroRNA and proteome expression profiling in early-symptomatic α-synuclein(A30P)-transgenic mice, Proteomics Clin Appl, 2, 697, 10.1002/prca.200780025 · DOI
- Hernandez-Rapp, 2015, Memory formation and retention are affected in adult miR-132/212 knockout mice, Behav Brain Res, 287, 15, 10.1016/j.bbr.2015.03.032 · DOI · Paper page
- Hernandez-Rapp, 2016, MicroRNA-132/212 deficiency enhances Aβ production and senile plaque deposition in Alzheimer’s disease triple transgenic mice, Sci Rep, 6, 30953, 10.1038/srep30953 · DOI
- El Fatimy, 2018, MicroRNA-132 provides neuroprotection for tauopathies via multiple signaling pathways, Acta Neuropathol, 136, 537, 10.1007/s00401-018-1880-5 · DOI · Paper page
- Zeng, 2019, MicroRNA-129-5p alleviates nerve injury and inflammatory response of Alzheimer’s disease via downregulating SOX6, Cell Cycle, 18, 3095, 10.1080/15384101.2019.1669388 · DOI
Cited by
Sorted by citations
A role for astrocytic miR-129-5p in frontotemporal dementia
Kaurani, L., Pradhan, R., Schröder, S., Burkhardt, S., Schuetz, A.-L., Krüger, D. M., Pena, T., Heutink, P., Sananbenesi, F., & Fischer, A. (2025) · Translational Psychiatry · doi:10.1038/s41398-025-03338-y · Cited by 10
Metadata
- Authors
- Dobricic, V., Schilling, M., Farkas, I., Gveric, D. O., Ohlei, O., Schulz, J., Middleton, L., Gentleman, S. M., Parkkinen, L., Bertram, L., & Lill, C. M.
- Affiliations
- Lübeck Interdisciplinary Platform for Genome Analytics (LIGA), University of Lübeck , 23562 Lübeck , Germany
- Multiple Sclerosis and Parkinson’s Tissue Bank, Imperial College London , London W12 0NN , UK
- Ageing and Epidemiology Unit (AGE), School of Public Health, Imperial College London , London W6 8RF , UK
- Department of Brain Sciences, Hammersmith Hospital campus, Imperial College London , London W12 0HS , UK
- Nuffield Department of Clinical Neurosciences, Oxford Parkinson’s Disease Centre, University of Oxford , Oxford OX3 9DU , UK
- ORCID
- Bertram, Lars
- Venue
- Brain Communications
- Publisher
- Oxford University Press (OUP)
- Published
- 2022-10-28
- Volume
- 4
- Issue
- 6
- ISSN
- 2632-1297
- PMC
- PMC9645562
- Cited by
- 22
- References
- 5
- Language
- en
- Funders
- Deutsche Forschungsgemeinschaft (#391523883)
- Cure Alzheimer’s Fund
- Brain Bank
- Imperial College London
- Parkinson’s UK (258197, SC037554)
- The Oxford Brain Bank
- Medical Research Council
- Brains for Dementia Research
- Alzheimer Society and Alzheimer Research UK
- NIHR Oxford Biomedical Research Centre
- Michael J. Fox Foundation
About these checks
Registry, retraction, Cites and statistics results are computed, not judged, with one exception: a printed reference that no index lists is read once by a model before it counts as a citation error. Claims are extracted by a model and kept only when their quote appears verbatim in the text; each cited source is then checked, with a model’s help, for whether it says what the claim relies on. Those verdicts can be wrong — read the claim’s quote and the cited source before relying on one.
Statistics and arithmetic are recomputed, not judged.
Confidence bands are shown only for fields calibrated on our annotated test set. None is calibrated yet, so no band is shown.
What counts as a claim ›How we measure confidence ›How we check this ›
Are you an author, or do you see a problem with this page? Request a review
