

The DOI matches its Crossref record; 56 of the 56 references it cites were found in a registry or an index.
Cortical Folding Patterns and Predicting Cytoarchitecture
Open accessAbstract
The human cerebral cortex is made up of a mosaic of structural areas, frequently referred to as Brodmann areas (BAs). Despite the widespread use of cortical folding patterns to perform ad hoc estimations of the locations of the BAs, little is understood regarding 1) how variable the position of a given BA is with respect to the folds, 2) whether the location of some BAs is more variable than others, and 3) whether the variability is related to the level of a BA in a putative cortical hierarchy. We use whole-brain histology of 10 postmortem human brains and surface-based analysis to test how well the folds predict the locations of the BAs. We show that higher order cortical areas exhibit more variability than primary and secondary areas and that the folds are much better predictors of the BAs than had been previously thought. These results further highlight the significance of cortical folding patterns and suggest a common mechanism for the development of the folds and the cytoarchitectonic fields.
Overview
The claims and statistics of this paper haven’t been checked yet.
Run the check — free, no account needed. It reads the open-access text and checks the sources it cites.
Integrity signals
Registry
Cites
Statistics
Figures
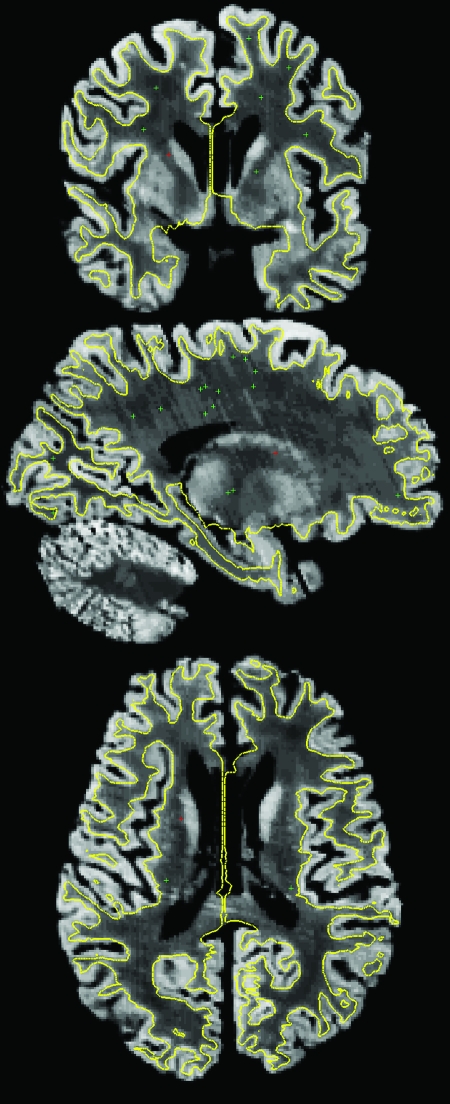
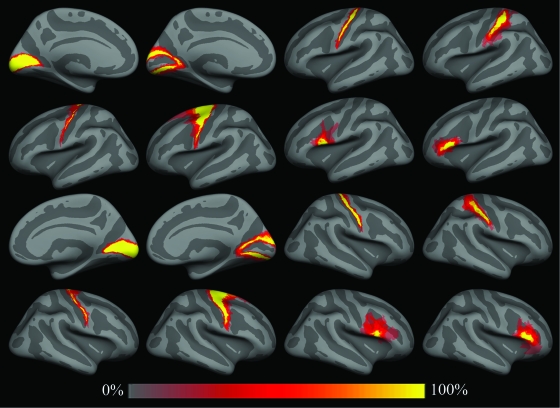
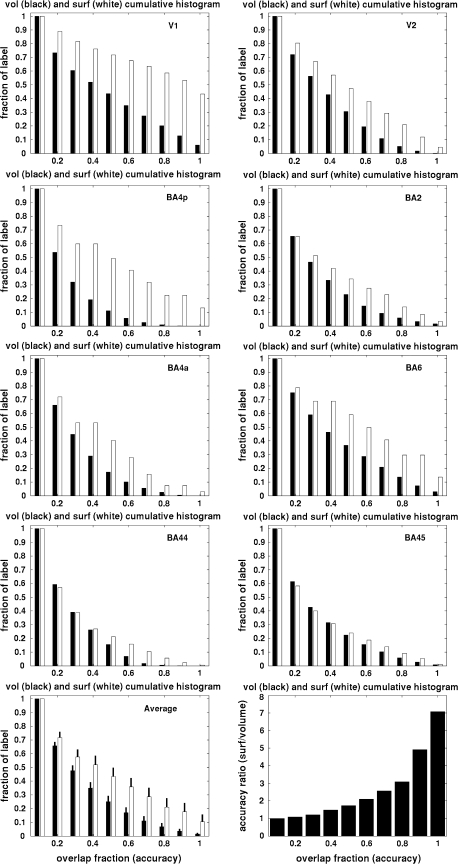
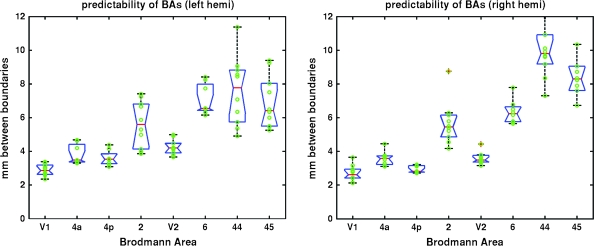
Verification
Claims the paper makes
The claims and statistics of this paper haven’t been checked yet.
Run the check — free, no account needed. It reads the open-access text and checks the sources it cites.
Claims other papers make about this one
Each is checked against this paper’s own text: does it say what the citing paper says it does?
In the citing paper
“functional areal boundaries (see Parcellation Choice) of heteromodal association areas are variable with respect to sulcal and gyral anatomy (Fischl et al., 2008).”
From Development of large-scale functional networks from birth to adulthood: A guide to the neuroimaging literature (2017) · cites this paper as Fischl et al., 2008
Self-check
Percentages, sums and reported differences re-computed from the paper’s own numbers.
The self-check needs the paper’s full text.
Citations
Cites
Co-Planar Stereotaxic Atlas of the Human Brain
Talairach, J., & Tournoux, P. (1988) · Medical Entomology and Zoology · Cited by 11,798
Cortical Surface-Based Analysis
Dale, A. M., Fischl, B., & Sereno, M. I. (1999) · NeuroImage · doi:10.1006/nimg.1998.0395 · Cited by 10,910
Self-citationDistributed hierarchical processing in the primate cerebral cortex
Felleman, D. J., & Van Essen, D. C. (1991) · Cerebral Cortex · doi:10.1093/cercor/1.1.1 · Cited by 7,783
Cortical Surface-Based Analysis
Fischl, B., Sereno, M. I., & Dale, A. M. (1999) · NeuroImage · doi:10.1006/nimg.1998.0396 · Cited by 6,147
Self-citationDISCONNEXION SYNDROMES IN ANIMALS AND MAN
Geschwind, N. (1965) · Brain · doi:10.1093/brain/88.2.237 · Cited by 3,419
Specification of Cerebral Cortical Areas
Rakic, P. (1988) · Science · doi:10.1126/science.3291116 · Cited by 3,127 · cited 2×
“…areas is that the 1978 Cortical Folding Patterns d Fischl et al. specification of the architectonic regions is present in a protomap in the proliferative ventricular zone in the form of radial columns that guide the formation and migration of cortical neurons during neurodevelopment (Rakic 1988).”
Background(1909) · Cited by 2,575
DISCONNEXION SYNDROMES IN ANIMALS AND MAN
Geschwind, N. (1965) · Brain · doi:10.1093/brain/88.3.585 · Cited by 1,840
Fischl, B. R., Liu, A., & Dale, A. M. (2001) · IEEE Transactions on Medical Imaging · doi:10.1109/42.906426 · Cited by 1,755
Self-citationAN ANATOMICAL STUDY OF CONVERGING SENSORY PATHWAYS WITHIN THE CEREBRAL CORTEX OF THE MONKEY
Jones, E. G., & Powell, T. P. S. (1970) · Brain · doi:10.1093/brain/93.4.793 · Cited by 1,717
Research works printed but not linked: 6
- 2007, PNAS, 108, 7652
- 1933, J PSYCHOL NEUROL, 45, 381
- 1988, COMP PRIMATE BIOL, 4, 39
- 1911, J PSYCHOL NEUROL, 18, 107
- 2004, Journal of Anatomy, 205, 217
- 1995, Journal of Anatomy, 187, 515
Cited by
Sorted by citations
Fischl, B. (2012) · NeuroImage · doi:10.1016/j.neuroimage.2012.01.021 · Cited by 9,526
Self-citationThe organization of the human cerebral cortex estimated by intrinsic functional connectivity
Thomas Yeo, B. T., Krienen, F. M., Sepulcre, J., Sabuncu, M. R., Lashkari, D., Hollinshead, M., Roffman, J. L., Smoller, J. W., Zöllei, L., Polimeni, J. R., et al. (2011) · Journal of Neurophysiology · doi:10.1152/jn.00338.2011 · Cited by 9,182
Self-citationThe organization of the human cerebellum estimated by intrinsic functional connectivity
Buckner, R. L., Krienen, F. M., Castellanos, A., Diaz, J. C., & Yeo, B. T. T. (2011) · Journal of Neurophysiology · doi:10.1152/jn.00339.2011 · Cited by 7,304
Self-citationThe minimal preprocessing pipelines for the Human Connectome Project
Glasser, M. F., Sotiropoulos, S. N., Wilson, J. A., Coalson, T. S., Fischl, B., Andersson, J. L., Xu, J., Jbabdi, S., Webster, M., Polimeni, J. R., et al. (2013) · NeuroImage · doi:10.1016/j.neuroimage.2013.04.127 · Cited by 5,253
Self-citationLocal-global parcellation of the human cerebral cortex from intrinsic functional connectivity MRI
Schaefer, A., Kong, R., Gordon, E. M., Laumann, T. O., Zuo, X.-N., Holmes, A. J., Eickhoff, S. B., & Yeo, B. T. T. (2018) · Cerebral Cortex · doi:10.1093/cercor/bhx179 · Cited by 3,657
Self-citationFunction in the human connectome: task-fMRI and individual differences in behavior
Barch, D. M., Burgess, G. C., Harms, M. P., Petersen, S. E., Schlaggar, B. L., Corbetta, M., Glasser, M. F., Curtiss, S., Dixit, S., Feldt, C., et al. (2013) · NeuroImage · doi:10.1016/j.neuroimage.2013.05.033 · Cited by 1,529
Generation and evaluation of a cortical area parcellation from resting-state correlations
Gordon, E. M., Laumann, T. O., Adeyemo, B., Huckins, J. F., Kelley, W. M., & Petersen, S. E. (2016) · Cerebral Cortex · doi:10.1093/cercor/bhu239 · Cited by 1,463
Mapping Human Cortical Areas In Vivo Based on Myelin Content as Revealed by T1- and T2-Weighted MRI
Glasser, M. F., & Van Essen, D. C. (2011) · The Journal of Neuroscience · doi:10.1523/jneurosci.2180-11.2011 · Cited by 1,447
Winkler, A. M., Kochunov, P., Blangero, J., Almasy, L., Zilles, K., Fox, P. T., Duggirala, R., & Glahn, D. C. (2010) · NeuroImage · doi:10.1016/j.neuroimage.2009.12.028 · Cited by 1,172
Self-citationIndividual Variability in Functional Connectivity Architecture of the Human Brain
Mueller, S., Wang, D., Fox, M., Yeo, B. T. T., Sepulcre, J., Sabuncu, M. R., Shafee, R., Lu, J., & Liu, H. (2013) · Neuron · doi:10.1016/j.neuron.2012.12.028 · Cited by 1,168
Self-citationThe Human Connectome Project's neuroimaging approach
Glasser, M. F., Smith, S. M., Marcus, D. S., Andersson, J. L. R., Auerbach, E. J., Behrens, T. E. J., Coalson, T. S., Harms, M. P., Jenkinson, M., Moeller, S., et al. (2016) · Nature Neuroscience · doi:10.1038/nn.4361 · Cited by 1,090
Consolidation alters motor sequence-specific distributed representations
Pinsard, B., Boutin, A., Gabitov, E., Lungu, O., Benali, H., & Doyon, J. (2019) · eLife · doi:10.7554/elife.39324 · Cited by 1,066
BigBrain: An Ultrahigh-Resolution 3D Human Brain Model
Amunts, K., Lepage, C., Borgeat, L., Mohlberg, H., Dickscheid, T., Rousseau, M.-É., Bludau, S., Bazin, P., Lewis, L. B., Oros‐Peusquens, A., et al. (2013) · Science · doi:10.1126/science.1235381 · Cited by 884
Self-citationThe functional architecture of the ventral temporal cortex and its role in categorization
Kalanit Grill-spector, A., & Weiner, K. S. (2014) · Nature reviews. Neuroscience · doi:10.1038/nrn3747 · Cited by 891
MSM: a new flexible framework for Multimodal Surface Matching
Robinson, E. C., Jbabdi, S., Glasser, M. F., Andersson, J., Burgess, G. C., Harms, M. P., Smith, S. M., Van Essen, D. C., & Jenkinson, M. (2014) · NeuroImage · doi:10.1016/j.neuroimage.2014.05.069 · Cited by 640
On testing for spatial correspondence between maps of human brain structure and function
Alexander-Bloch, A. F., Shou, H., Liu, S., Satterthwaite, T. D., Glahn, D. C., Shinohara, R. T., Vandekar, S. N., & Raznahan, A. (2018) · NeuroImage · doi:10.1016/j.neuroimage.2018.05.070 · Cited by 947
The organization of the human striatum estimated by intrinsic functional connectivity
Choi, E. Y., Yeo, B. T. T., & Buckner, R. L. (2012) · Journal of Neurophysiology · doi:10.1152/jn.00270.2012 · Cited by 746
Self-citationGraph analysis of the human connectome: Promise, progress, and pitfalls
Fornito, A., Zalesky, A., & Breakspear, M. (2013) · NeuroImage · doi:10.1016/j.neuroimage.2013.04.087 · Cited by 743
Task-free MRI predicts individual differences in brain activity during task performance
Tavor, I., Jones, Ō. P., Mars, R. B., Smith, S. M., Behrens, T. E. J., & Jbabdi, S. (2016) · Science · doi:10.1126/science.aad8127 · Cited by 756
Michalareas, G., Vezoli, J., van Pelt, S., Schoffelen, J.-M., Kennedy, H., & Fries, P. (2016) · Neuron · doi:10.1016/j.neuron.2015.12.018 · Cited by 696
Evans, A. C., Janke, A. L., Collins, D. L., & Baillet, S. (2012) · NeuroImage · doi:10.1016/j.neuroimage.2012.01.024 · Cited by 727
New method for fMRI investigations of language: defining ROIs functionally in individual subjects
Fedorenko, E., Hsieh, P.-J., Nieto-Castañón, A., Whitfield-Gabrieli, S., & Kanwisher, N. (2010) · Journal of Neurophysiology · doi:10.1152/jn.00032.2010 · Cited by 686
Parcellations and Hemispheric Asymmetries of Human Cerebral Cortex Analyzed on Surface-Based Atlases
Van Essen, D. C., Glasser, M. F., Dierker, D. L., Harwell, J., & Coalson, T. (2012) · Cerebral Cortex · doi:10.1093/cercor/bhr291 · Cited by 616
Braga, R. M., & Buckner, R. L. (2017) · Neuron · doi:10.1016/j.neuron.2017.06.038 · Cited by 602
Reliability of dissimilarity measures for multi-voxel pattern analysis
Walther, A., Nili, H., Ejaz, N., Alink, A., Kriegeskorte, N., & Diedrichsen, J. (2015) · NeuroImage · doi:10.1016/j.neuroimage.2015.12.012 · Cited by 567
Computational anatomy with the SPM software
Ashburner, J. (2009) · Magnetic Resonance Imaging · doi:10.1016/j.mri.2009.01.006 · Cited by 565
Makropoulos, A., Robinson, E. C., Schuh, A., Wright, R., Fitzgibbon, S. P., Božek, J., Counsell, S. J., Steinweg, J. K., Vecchiato, K., Passerat‐Palmbach, J., et al. (2018) · NeuroImage · doi:10.1016/j.neuroimage.2018.01.054 · Cited by 571
Zuo, X., Xu, T., Jiang, L., Yang, Z., Cao, X., Yong He, A., Zang, Y., Castellanos, F. X., & Milham, M. P. (2012) · NeuroImage · doi:10.1016/j.neuroimage.2012.10.017 · Cited by 510
Diffeomorphic registration using geodesic shooting and Gauss–Newton optimisation
Ashburner, J., & Friston, K. J. (2011) · NeuroImage · doi:10.1016/j.neuroimage.2010.12.049 · Cited by 494
Imaging-based parcellations of the human brain
Eickhoff, S. B., Yeo, B. T. T., & Genon, S. (2018) · Nature reviews. Neuroscience · doi:10.1038/s41583-018-0071-7 · Cited by 484
Self-citationA Generative Model for Image Segmentation Based on Label Fusion
Sabuncu, M. R., Yeo, B. T. T., Leemput, K. V., Fischl, B. R., & Golland, P. (2010) · IEEE Transactions on Medical Imaging · doi:10.1109/tmi.2010.2050897 · Cited by 486
Self-citationGrowth and folding of the mammalian cerebral cortex: from molecules to malformations
Sun, T., & Hevner, R. F. (2014) · Nature reviews. Neuroscience · doi:10.1038/nrn3707 · Cited by 489
Language-Selective and Domain-General Regions Lie Side by Side within Broca’s Area
Fedorenko, E. G., Duncan, J., & Kanwisher, N. (2012) · Current Biology · doi:10.1016/j.cub.2012.09.011 · Cited by 494
Trends and properties of human cerebral cortex: Correlations with cortical myelin content
Glasser, M. F., Goyal, M. S., Preuss, T. M., Raichle, M. E., & Essen, D. C. V. (2013) · NeuroImage · doi:10.1016/j.neuroimage.2013.03.060 · Cited by 456
Comprehensive cellular‐resolution atlas of the adult human brain
Ding, S., Royall, J. J., Sunkin, S. M., Ng, L., Facer, B. A. C., Lesnar, P., Guillozet‐Bongaarts, A., McMurray, B., Szafer, A., Dolbeare, T. A., et al. (2016) · Journal of Comparative Neurology · doi:10.1002/cne.24080 · Cited by 447
Self-citationFunctional Specialization and Flexibility in Human Association Cortex
Yeo, B. T. T., Krienen, F. M., Eickhoff, S. B., Yaakub, S. N., Fox, P. T., Buckner, R. L., Asplund, C. L., & Chee, M. W. L. (2014) · Cerebral Cortex · doi:10.1093/cercor/bhu217 · Cited by 448
Self-citationThe anatomical and functional specialization of the fusiform gyrus
Weiner, K. S., & Zilles, K. (2015) · Neuropsychologia · doi:10.1016/j.neuropsychologia.2015.06.033 · Cited by 460
Self-citationLaminar analysis of 7T BOLD using an imposed spatial activation pattern in human V1
Polimeni, J. R., Fischl, B. R., Greve, D. N., & Wald, L. L. (2010) · NeuroImage · doi:10.1016/j.neuroimage.2010.05.005 · Cited by 431
Self-citationDeficient approaches to human neuroimaging
Stelzer, J., Lohmann, G., Mueller, K., Buschmann, T., & Turner, R. (2014) · Frontiers in Human Neuroscience · doi:10.3389/fnhum.2014.00462 · Cited by 418
Grayson, D. S., & Fair, D. A. (2017) · NeuroImage · doi:10.1016/j.neuroimage.2017.01.079 · Cited by 411
“On top of these issues, functional areal boundaries (see Parcellation Choice) of heteromodal association areas are variable with respect to sulcal and gyral anatomy (Fischl et al., 2008).”
BackgroundThe human inferior parietal lobule in stereotaxic space
Caspers, S., Eickhoff, S. B., Geyer, S., Scheperjans, F., Mohlberg, H., Zilles, K., & Amunts, K. (2008) · Brain Structure and Function · doi:10.1007/s00429-008-0195-z · Cited by 395
Self-citationUsing brain imaging to improve spatial targeting of transcranial magnetic stimulation for depression
Cash, R. F. H., Weigand, A., Zalesky, A., Siddiqi, S. H., Downar, J., Fitzgerald, P. B., & Fox, M. D. (2021) · Biological Psychiatry · doi:10.1016/j.biopsych.2020.05.033 · Cited by 366
Fridriksson, J., den Ouden, D., Hillis, A. E., Hickok, G. S., Rorden, C., Basilakos, A., Yourganov, G., & Bonilha, L. (2017) · Brain · doi:10.1093/brain/awx363 · Cited by 404
Age-associated reductions in cerebral blood flow are independent from regional atrophy
Chen, J. J., Rosas, H. D., & Salat, D. H. (2010) · NeuroImage · doi:10.1016/j.neuroimage.2010.12.032 · Cited by 380
Emrich, S. M., Riggall, A. C., LaRocque, J. J., & Postle, B. R. (2013) · The Journal of Neuroscience · doi:10.1523/jneurosci.5732-12.2013 · Cited by 343
Spherical Demons: Fast Diffeomorphic Landmark-Free Surface Registration
Yeo, B. T. T., Sabuncu, M. R., Vercauteren, T. K., Ayache, N., Fischl, B. R., & Golland, P. (2009) · IEEE Transactions on Medical Imaging · doi:10.1109/tmi.2009.2030797 · Cited by 345
Self-citationApparent thinning of human visual cortex during childhood is associated with myelination
Natu, V. S., Gomez, J., Barnett, M., Jeska, B., Kirilina, E. P., Jaeger, C., Zhen, Z., Cox, S., Weiner, K. S., Weiskopf, N., et al. (2019) · Proceedings of the National Academy of Sciences · doi:10.1073/pnas.1904931116 · Cited by 353
An algorithmic method for functionally defining regions of interest in the ventral visual pathway
Julian, J. B., Fedorenko, E. G., Webster, J. M., & Kanwisher, N. (2012) · NeuroImage · doi:10.1016/j.neuroimage.2012.02.055 · Cited by 334
Multimodal surface matching with higher-order smoothness constraints
Robinson, E. C., Garcia, K., Glasser, M. F., Chen, Z., Coalson, T. S., Makropoulos, A., Božek, J., Wright, R., Schuh, A., Webster, M., et al. (2017) · NeuroImage · doi:10.1016/j.neuroimage.2017.10.037 · Cited by 326
Which fMRI clustering gives good brain parcellations?
Thirion, B., Varoquaux, G. P., Dohmatob, E., & Poline, J. (2014) · Frontiers in Neuroscience · doi:10.3389/fnins.2014.00167 · Cited by 329
Frost, M. A., & Goebel, R. (2011) · NeuroImage · doi:10.1016/j.neuroimage.2011.08.035 · Cited by 305
Studying neuroanatomy using MRI
Lerch, J. P., van der Kouwe, A. J. W., Raznahan, A., Paus, T., Johansen‐Berg, H., Miller, K. L., Smith, S. M., Fischl, B. R., & Sotiropoulos, S. N. (2017) · Nature Neuroscience · doi:10.1038/nn.4501 · Cited by 330
Self-citationThe impact of traditional neuroimaging methods on the spatial localization of cortical areas
Coalson, T. S., Essen, D. C. V., & Glasser, M. F. (2018) · Proceedings of the National Academy of Sciences · doi:10.1073/pnas.1801582115 · Cited by 311
Linking pattern completion in the hippocampus to predictive coding in visual cortex
Hindy, N. C., Ng, F. Y., & Turk-Browne, N. B. (2016) · Nature Neuroscience · doi:10.1038/nn.4284 · Cited by 246
Salat, D. H., Lee, S. Y., van der Kouwe, A. J. W., Greve, D. N., Fischl, B. R., & Rosas, H. D. (2009) · NeuroImage · doi:10.1016/j.neuroimage.2009.06.074 · Cited by 296
Self-citationBuilding connectomes using diffusion MRI: why, how and but
Sotiropoulos, S. N., & Zalesky, A. (2019) · NMR in Biomedicine · doi:10.1002/nbm.3752 · Cited by 290
Ghosh, S. S., Kakunoori, S., Augustinack, J., Nieto-Castanon, A., Kovelman, I., Gaab, N., Christodoulou, J. A., Triantafyllou, C., Gabrieli, J. D. E., & Fischl, B. (2010) · NeuroImage · doi:10.1016/j.neuroimage.2010.05.075 · Cited by 281
Self-citationHippocampal sharp-wave ripples linked to visual episodic recollection in humans
Norman, Y., Yeagle, E. M., Khuvis, S., Harel, M., Mehta, A. D., & Malach, R. (2019) · Science · doi:10.1126/science.aax1030 · Cited by 270
Huntenburg, J. M., Bazin, P., Goulas, A., Tardif, C. L., Villringer, A., & Margulies, D. S. (2017) · Cerebral Cortex · doi:10.1093/cercor/bhx030 · Cited by 261
Broca’s Area Is Not a Natural Kind
Fedorenko, E. G., & Blank, I. (2020) · Trends in Cognitive Sciences · doi:10.1016/j.tics.2020.01.001 · Cited by 272
Evaluation and statistical inference for human connectomes
Pestilli, F., Yeatman, J. D., Rokem, A., Kay, K. N., & Wandell, B. A. (2014) · Nature Methods · doi:10.1038/nmeth.3098 · Cited by 259
Mapping the Human Cortical Surface by Combining Quantitative T1 with Retinotopy†
Sereno, M. I., Lutti, A., Weiskopf, N., & Dick, F. (2012) · Cerebral Cortex · doi:10.1093/cercor/bhs213 · Cited by 261
Evaluation of volume-based and surface-based brain image registration methods
Klein, A., Ghosh, S. S., Avants, B., Yeo, B. T. T., Fischl, B., Ardekani, B., Gee, J. C., Mann, J. J., & Parsey, R. V. (2010) · NeuroImage · doi:10.1016/j.neuroimage.2010.01.091 · Cited by 255
Self-citationIndividual-Specific Areal-Level Parcellations Improve Functional Connectivity Prediction of Behavior
Kong, R., Yang, Q., Gordon, E. M., Xue, A., Yan, X., Orbán, C., Zuo, X., Spreng, R. N., Ge, T., Holmes, A. J., et al. (2021) · Cerebral Cortex · doi:10.1093/cercor/bhab101 · Cited by 261
Self-citationStructural abnormalities in the dyslexic brain: A meta‐analysis of voxel‐based morphometry studies
Richlan, F., Kronbichler, M., & Wimmer, H. (2012) · Human Brain Mapping · doi:10.1002/hbm.22127 · Cited by 270
Broca’s area: Nomenclature, anatomy, typology and asymmetry
Keller, S. S., Crow, T. J., Foundas, A. L., Amunts, K., & Roberts, N. (2009) · Brain and Language · doi:10.1016/j.bandl.2008.11.005 · Cited by 251
Self-citationNieto-Castañón, A., & Fedorenko, E. (2012) · NeuroImage · doi:10.1016/j.neuroimage.2012.06.065 · Cited by 247
Geyer, S., Weiß, M., Reimann, K., Lohmann, G., & Turner, R. (2011) · Frontiers in Human Neuroscience · doi:10.3389/fnhum.2011.00019 · Cited by 256
Cytoarchitecture, probability maps and functions of the human frontal pole
Bludau, S., Eickhoff, S. B., Mohlberg, H., Caspers, S., Laird, A. R., Fox, P. T., Schleicher, A., Zilles, K., & Amunts, K. (2013) · NeuroImage · doi:10.1016/j.neuroimage.2013.05.052 · Cited by 265
Self-citationA population-average MRI-based atlas collection of the rhesus macaque
McLaren, D. G., Kosmatka, K. J., Oakes, T. R., Kroenke, C. D., Kohama, S. G., Matochik, J. A., Ingram, D. K., & Johnson, S. C. (2008) · NeuroImage · doi:10.1016/j.neuroimage.2008.10.058 · Cited by 243
Hand use predicts the structure of representations in sensorimotor cortex
Ejaz, N., Hamada, M., & Diedrichsen, J. (2015) · Nature Neuroscience · doi:10.1038/nn.4038 · Cited by 233
False positive rates in surface-based anatomical analysis
Greve, D. N., & Fischl, B. R. (2017) · NeuroImage · doi:10.1016/j.neuroimage.2017.12.072 · Cited by 234
Self-citationRelaxed genetic control of cortical organization in human brains compared with chimpanzees
Gómez‐Robles, A., Hopkins, W. D., Schapiro, S. J., & Sherwood, C. C. (2015) · Proceedings of the National Academy of Sciences · doi:10.1073/pnas.1512646112 · Cited by 235
Yousaf, T., Dervenoulas, G., & Politis, M. (2018) · International review of neurobiology · doi:10.1016/bs.irn.2018.08.008 · Cited by 244
Quantifying inter-individual anatomical variability in the subcortex using 7 T structural MRI
Keuken, M. C., Bazin, P., Crown, L., Hootsmans, J., Laufer, A., Müller-Axt, C., Sier, R., van der Putten, E. J., Schäfer, A., Turner, R., et al. (2014) · NeuroImage · doi:10.1016/j.neuroimage.2014.03.032 · Cited by 223
Ultra-high field MRI: Advancing systems neuroscience towards mesoscopic human brain function
Dumoulin, S. O., Fracasso, A., van der Zwaag, W., Siero, J. C. W., & Petridou, N. (2017) · NeuroImage · doi:10.1016/j.neuroimage.2017.01.028 · Cited by 216
Structural integration in language and music: Evidence for a shared system
Fedorenko, E. G., Patel, A. D., Casasanto, D. J., Winawer, J. A., & Gibson, E. A. F. (2008) · Memory & Cognition · doi:10.3758/mc.37.1.1 · Cited by 244
A Surface-based Analysis of Language Lateralization and Cortical Asymmetry
Greve, D. N., der Haegen, L. V., Cai, Q., Stufflebeam, S. M., Sabuncu, M. R., Fischl, B. R., & Brysbaert, M. (2013) · Journal of Cognitive Neuroscience · doi:10.1162/jocn_a_00405 · Cited by 231
Self-citationIndividual variability of the system-level Organization of the Human Brain
Gordon, E. M., Laumann, T. O., Adeyemo, B., & Petersen, S. E. (2015) · Cerebral Cortex · doi:10.1093/cercor/bhv239 · Cited by 219
Skill learning strengthens cortical representations of motor sequences
Wiestler, T., & Diedrichsen, J. (2013) · eLife · doi:10.7554/elife.00801 · Cited by 226
Kochunov, P., Jahanshad, N., Marcus, D., Winkler, A., Sprooten, E., Nichols, T. E., Wright, S. N., Hong, L. E., Patel, B., Behrens, T., et al. (2015) · NeuroImage · doi:10.1016/j.neuroimage.2015.02.050 · Cited by 215
fMRI reveals language-specific predictive coding during naturalistic sentence comprehension
Shain, C., Blank, I. A., van Schijndel, M., Schuler, W., & Fedorenko, E. (2020) · Neuropsychologia · doi:10.1016/j.neuropsychologia.2019.107307 · Cited by 215
Individual-specific features of brain systems identified with resting state functional correlations
Gordon, E. M., Laumann, T. O., Adeyemo, B., Gilmore, A. W., Nelson, S. M., Dosenbach, N. U. F., & Petersen, S. E. (2016) · NeuroImage · doi:10.1016/j.neuroimage.2016.08.032 · Cited by 222
Kelly, C. A. M., Uddin, L. Q., Shehzad, Z. E., Margulies, D. S., Castellanos, F. X., Milham, M. P., & Petrides, M. (2010) · European Journal of Neuroscience · doi:10.1111/j.1460-9568.2010.07279.x · Cited by 213
Schenker-Ahmed, N. M., Hopkins, W. D., Spocter, M. A., Garrison, A. R., Stimpson, C. D., Erwin, J. M., Hof, P. R., & Sherwood, C. C. (2009) · Cerebral Cortex · doi:10.1093/cercor/bhp138 · Cited by 212
Klein, J. C., Rushworth, M. F. S., Behrens, T. E. J., Mackay, C. E., de Crespigny, A. J., D'Arceuil, H. E., & Johansen‐Berg, H. (2010) · NeuroImage · doi:10.1016/j.neuroimage.2010.02.062 · Cited by 203
Cash, R. F. H., Cocchi, L., Lv, J., Wu, Y., Fitzgerald, P. B., & Zalesky, A. (2021) · Human Brain Mapping · doi:10.1002/hbm.25330 · Cited by 211
The future of the human connectome
Essen, D. C. V., & Uǧurbil, K. (2012) · NeuroImage · doi:10.1016/j.neuroimage.2012.01.032 · Cited by 197
Continuity, Divergence, and the Evolution of Brain Language Pathways
Rilling, J. K., Glasser, M. F., Jbabdi, S., Andersson, J., & Preuss, T. M. (2012) · Frontiers in Evolutionary Neuroscience · doi:10.3389/fnevo.2011.00011 · Cited by 189
Fast fMRI can detect oscillatory neural activity in humans
Lewis, L. D., Setsompop, K., Rosen, B. R., & Polimeni, J. R. (2016) · Proceedings of the National Academy of Sciences · doi:10.1073/pnas.1608117113 · Cited by 198
An approach for parcellating human cortical areas using resting-state correlations
Wig, G. S., Laumann, T. O., & Petersen, S. E. (2013) · NeuroImage · doi:10.1016/j.neuroimage.2013.07.035 · Cited by 188
The Endocast of MH1, Australopithecus sediba
Carlson, K. J., Stout, D., Jashashvili, T., de Ruiter, D. J., Tafforeau, P., Carlson, K., & Berger, L. R. (2011) · Science · doi:10.1126/science.1203922 · Cited by 183
Measuring and comparing brain cortical surface area and other areal quantities
Winkler, A. M., Sabuncu, M. R., Yeo, B. T. T., Fischl, B. R., Greve, D. N., Kochunov, P., Nichols, T. E., Blangero, J., & Glahn, D. C. (2012) · NeuroImage · doi:10.1016/j.neuroimage.2012.03.026 · Cited by 186
Self-citationStructural Connectivity for Visuospatial Attention: Significance of Ventral Pathways
Umarova, R. M., Saur, D., Schnell, S., Kaller, C. P., Vry, M., Glauche, V., Rijntjes, M., Hennig, J., Kiselev, V. G., & Weiller, C. (2009) · Cerebral Cortex · doi:10.1093/cercor/bhp086 · Cited by 186
Differential Tangential Expansion as a Mechanism for Cortical Gyrification
Ronan, L., Voets, N., Rua, C., Alexander‐Bloch, A. F., Hough, M., Mackay, C. E., Crow, T. J., James, A. C., Giedd, J. N., & Fletcher, P. C. (2013) · Cerebral Cortex · doi:10.1093/cercor/bht082 · Cited by 174
Syntactic processing is distributed across the language system
Blank, I., Balewski, Z. Z., Mahowald, K., & Fedorenko, E. G. (2015) · NeuroImage · doi:10.1016/j.neuroimage.2015.11.069 · Cited by 170
Lack of selectivity for syntax relative to word meanings throughout the language network
Fedorenko, E., Blank, I. A., Siegelman, M., & Mineroff, Z. (2020) · Cognition · doi:10.1016/j.cognition.2020.104348 · Cited by 170
Cortical thickness gradients in structural hierarchies
Wagstyl, K., Ronan, L., Goodyer, I. M., & Fletcher, P. C. (2015) · NeuroImage · doi:10.1016/j.neuroimage.2015.02.036 · Cited by 169
Robotic hand augmentation drives changes in neural body representation
Kieliba, P., Clode, D., Maimon-Mor, R. O., & Makin, T. R. (2021) · Science Robotics · doi:10.1126/scirobotics.abd7935 · Cited by 170
In-vivo measurement of cortical morphology: means and meanings
Mangin, J., Jouvent, É., & Cachia, A. (2010) · Current Opinion in Neurology · doi:10.1097/wco.0b013e32833a0afc · Cited by 166
Metadata
- Authors
- Fischl, B., Rajendran, N., Busa, E., Augustinack, J., Hinds, O., Yeo, B. T. T., Mohlberg, H., Amunts, K., & Zilles, K.
- Affiliations
- Harvard University (US)
- McGovern Institute for Brain Research (US)
- Massachusetts Institute of Technology (US)
- Forschungszentrum Jülich (DE)
- Corresponding author
- Fischl, B.
- Venue
- Cerebral Cortex
- Publisher
- Oxford University Press (OUP)
- Published
- 2007-12-12
- Volume
- 18
- Issue
- 8
- Pages
- 1973-1980
- ISSN
- 1047-3211 (ISSN-L)
- 1460-2199
- PMC
- PMC2474454
- OpenAlex
- W2154281919
- Cited by
- 737
- References
- 56
- Citations by year
- 2026: 18 · 2025: 22 · 2024: 34 · 2023: 38 · 2022: 45 · 2021: 58 · 2020: 52 · 2019: 44 · 2018: 55 · 2017: 56 · 2016: 41 · 2015: 40 · 2014: 32 · 2013: 48 · 2012: 42
- FWCI
- 19.50
- Type
- journal article
- Language
- en
- Open access
- hybrid
- doi.org
- Licence
- cc-by-nc
- Locations
- Cerebral Cortex (publishedVersion, cc-by-nc)
- Europe PMC (PubMed Central) (publishedVersion, cc-by-nc)
- PubMed Central (publishedVersion, cc-by-nc)
- PubMed (publishedVersion)
- Digital Access to Scholarship at Harvard (DASH) (Harvard University) (submittedVersion, cc-by)
- DSpace@MIT (Massachusetts Institute of Technology) (submittedVersion, cc-by-nc)
- JuSER (Forschungszentrum Jülich) (submittedVersion)
- RWTH Publications (RWTH Aachen) (submittedVersion)
- Funders
- Deutsche Forschungsgemeinschaft
- National Institutes of Health (BIRN002, RR14075, EB005149)
- National Institute of Mental Health
- National Institute of Neurological Disorders and Stroke (R01NS052585)
- National Institute of Biomedical Imaging and Bioengineering (R01EB001550, R01EB006758, U54EB005149)
- National Center for Research Resources (BIRN002, U24 RR021382, P41-RR-14075, RR 14075, U24RR021382, R01 RR1659401A1, R01-RR16594, P41RR014075, BIRN002, R01RR016594)
- Topics
- Health Sciences › Medicine › Radiology, Nuclear Medicine and Imaging › Advanced Neuroimaging Techniques and Applications
- Life Sciences › Neuroscience › Cognitive Neuroscience › Functional Brain Connectivity Studies
- Life Sciences › Neuroscience › Developmental Neuroscience › Neurogenesis and neuroplasticity mechanisms
- Keywords
- cortical folding, Brodmann areas, cytoarchitecture, cortical hierarchy, cortical development, postmortem brain, surface-based analysis
- MeSH terms
- Brain Mapping, Cerebral Cortex, Humans, Predictive Value of Tests
About these checks
Registry, retraction, Cites and statistics results are computed, not judged, with one exception: a printed reference that no index lists is read once by a model before it counts as a citation error. Claims are extracted by a model and kept only when their quote appears verbatim in the text; each cited source is then checked, with a model’s help, for whether it says what the claim relies on. Those verdicts can be wrong — read the claim’s quote and the cited source before relying on one.
Statistics and arithmetic are recomputed, not judged.
Confidence bands are shown only for fields calibrated on our annotated test set. None is calibrated yet, so no band is shown.
What counts as a claim ›How we measure confidence ›How we check this ›
Are you an author, or do you see a problem with this page? Request a review
