Cited by 110

The DOI matches its Crossref record; 4 of the 4 references it cites were found in a registry or an index.

A minicircuitry involving REST and CREB controls miR-9-2 expression during human neuronal differentiation

Laneve, Pietro, Gioia, Ubaldo, Andriotto, Anastasia, Moretti, Francesca, Bozzoni, Irene, Caffarelli, Elisa·2010·Nucleic Acids Research

Overview

The claims and statistics of this paper haven’t been checked yet.

Run the check — free, no account needed. It reads the open-access text and checks the sources it cites.

A few free checks a day · papers already verified open instantly · results are public

Integrity signals

Registry

Crossref · 10.1093/nar/gkq604

Cites

4 of 4 references verified0 citation errors · 0 not checkable

Statistics

Figures

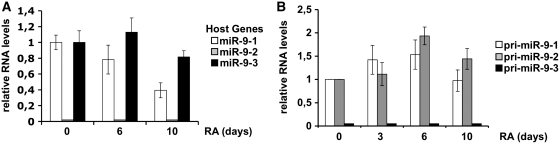
Figure 1. Expression profiles of miR-9 transcripts. (A) Expression profiling of miR-9-1, miR-9-2 and miR-9-3 host gene transcripts by qRT–PCR. (B) Expression profiling of miR-9 primary transcripts (pri-miR-9) by RT–PCR. In both (A) and (B) panels, the expression levels were evaluated at specific time-points (days, indicated below each bar) of RA treatment and normalized against GAPDH mRNA levels. White, grey and black bars refer to miR-9-1, miR-9-2 and miR-9-3 genes, respectively. Error bars in the histograms represent the standard deviation obtained from three independent experiments.
Figure 1. Expression profiles of miR-9 transcripts. (A) Expression profiling of miR-9-1, miR-9-2 and miR-9-3 host gene transcripts by qRT–PCR. (B) Expression profiling of miR-9 primary transcripts (pri-miR-9) by RT–PCR. In both (A) and (B) panels, the expression levels were evaluated at specific time-points (days, indicated below each bar) of RA treatment and normalized against GAPDH mRNA levels. White, grey and black bars refer to miR-9-1, miR-9-2 and miR-9-3 genes, respectively. Error bars in the histograms represent the standard deviation obtained from three independent experiments.CC BY-NC · PubMed Central
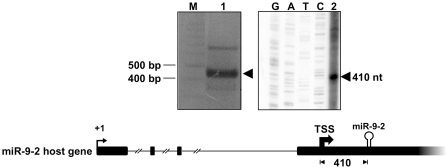
Figure 2. Identification of miR-9-2 TSS by 5′RACE and primer extension analyses. Left panel: the product of 5′RACE (lane 1) was fractionated along with a DNA ladder (lane M). The arrowhead points to the amplified product. Right panel: the primer extension reaction (lane 2) was run in parallel with the sequencing reaction (lanes G, A, T and C). The arrowhead indicates the extended product. In the underneath schematic representation, the 5′ end of the reported miR-9-2 host transcript (+1) is pointed out by a thin arrow. The thick arrow points to the miR-9-2 TSS; the distance of the TSS from miR-9-2 stem loop structure is reported as nucleotide length.
Figure 2. Identification of miR-9-2 TSS by 5′RACE and primer extension analyses. Left panel: the product of 5′RACE (lane 1) was fractionated along with a DNA ladder (lane M). The arrowhead points to the amplified product. Right panel: the primer extension reaction (lane 2) was run in parallel with the sequencing reaction (lanes G, A, T and C). The arrowhead indicates the extended product. In the underneath schematic representation, the 5′ end of the reported miR-9-2 host transcript (+1) is pointed out by a thin arrow. The thick arrow points to the miR-9-2 TSS; the distance of the TSS from miR-9-2 stem loop structure is reported as nucleotide length.CC BY-NC · PubMed Central
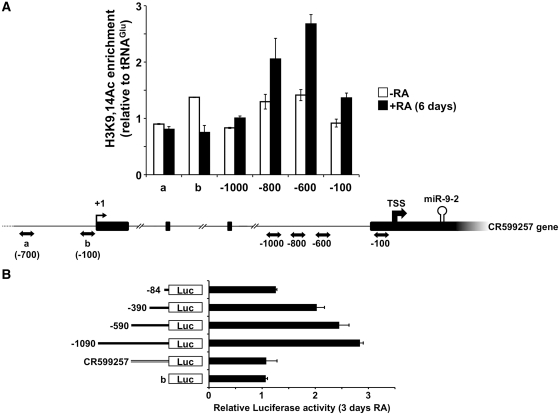
Figure 3. Identification of miR-9-2 promoter. (A) Analysis of histone acetylation on miR-9-2 and CR599257 gene upstream regions. ChIP assays were performed on chromatin samples from 6 days-RA treated (black bars) or untreated (white bars) cells, immunoprecipitated with antibodies against H3K9,14Ac. PCR-amplified regions are reported below each bar of the histogram and are indicated by double-headed arrows in the underneath schematic representation. Immunoprecipitation levels are expressed as fold enrichment with respect to an unrelated region (tRNAGlu). Error bars in the histogram represent the standard deviation obtained from three independent experiments. (B) Analysis of CR599257 and miR-9-2 promoter activity by luciferase assay. The luciferase-based reporter construct (−1090), containing the 1-kb region upstream of the miR-9-2 TSS, and its deletion mutant derivatives thereof were tested together with the construct containing the conserved 500-bp region upstream of the CR599257 gene TSS. For each reporter construct, schematized on the left, the histogram shows luciferase expression levels, evaluated as the ratio between the values measured in 3 days RA-treated versus untreated cells. The promoter-less reporter construct was tested as control (b). Error bars in the histogram represent the standard deviation obtained from three independent experiments.
Figure 3. Identification of miR-9-2 promoter. (A) Analysis of histone acetylation on miR-9-2 and CR599257 gene upstream regions. ChIP assays were performed on chromatin samples from 6 days-RA treated (black bars) or untreated (white bars) cells, immunoprecipitated with antibodies against H3K9,14Ac. PCR-amplified regions are reported below each bar of the histogram and are indicated by double-headed arrows in the underneath schematic representation. Immunoprecipitation levels are expressed as fold enrichment with respect to an unrelated region (tRNAGlu). Error bars in the histogram represent the standard deviation obtained from three independent experiments. (B) Analysis of CR599257 and miR-9-2 promoter activity by luciferase assay. The luciferase-based reporter construct (−1090), containing the 1-kb region upstream of the miR-9-2 TSS, and its deletion mutant derivatives thereof were tested together with the construct containing the conserved 500-bp region upstream of the CR599257 gene TSS. For each reporter construct, schematized on the left, the histogram shows luciferase expression levels, evaluated as the ratio between the values measured in 3 days RA-treated versus untreated cells. The promoter-less reporter construct was tested as control (b). Error bars in the histogram represent the standard deviation obtained from three independent experiments.CC BY-NC · PubMed Central
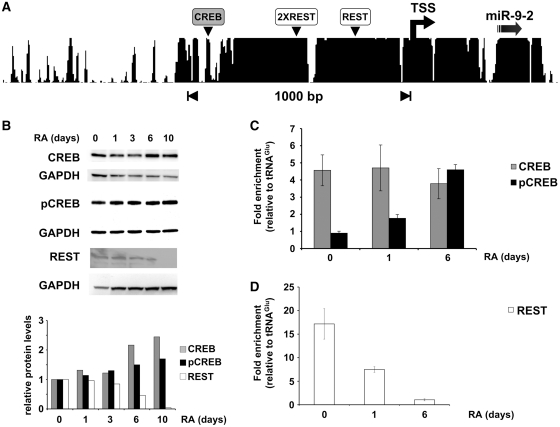
Figure 4. Association of transcriptional factors with miR-9-2 promoter chromatin. (A) Conservation of the region upstream of miR-9-2 stem loop structure in mammals, according to UCSC genome browser. The conserved binding sites for CREB and REST are indicated by grey and white boxes, respectively, according to the Chip-Mapper Web Server. (B) Analysis of total CREB (CREB), phospho-CREB (pCREB) and REST (REST) protein levels. Upper panels: SK-N-BE cells were treated with RA for the times indicated above each lane and total protein extracts were analyzed by western blot. Signals were normalized for GAPDH levels. Lower panel: densitometric analyses of western blots. Results are normalized against GAPDH and expressed as RQs versus untreated cells (lane 0). (C) and (D) ChIP analysis of total CREB and phospho-CREB (CREB and pCREB respectively) and REST occupancy at the miR-9-2 promoter. Chromatin samples were obtained by cells treated with RA for the times (days) indicated below each bar. Immunoprecipitation levels are expressed as fold enrichment with respect to the tRNAGlu gene. Error bars in the histograms represent the standard deviation obtained from three independent experiments.
Figure 4. Association of transcriptional factors with miR-9-2 promoter chromatin. (A) Conservation of the region upstream of miR-9-2 stem loop structure in mammals, according to UCSC genome browser. The conserved binding sites for CREB and REST are indicated by grey and white boxes, respectively, according to the Chip-Mapper Web Server. (B) Analysis of total CREB (CREB), phospho-CREB (pCREB) and REST (REST) protein levels. Upper panels: SK-N-BE cells were treated with RA for the times indicated above each lane and total protein extracts were analyzed by western blot. Signals were normalized for GAPDH levels. Lower panel: densitometric analyses of western blots. Results are normalized against GAPDH and expressed as RQs versus untreated cells (lane 0). (C) and (D) ChIP analysis of total CREB and phospho-CREB (CREB and pCREB respectively) and REST occupancy at the miR-9-2 promoter. Chromatin samples were obtained by cells treated with RA for the times (days) indicated below each bar. Immunoprecipitation levels are expressed as fold enrichment with respect to the tRNAGlu gene. Error bars in the histograms represent the standard deviation obtained from three independent experiments.CC BY-NC · PubMed Central
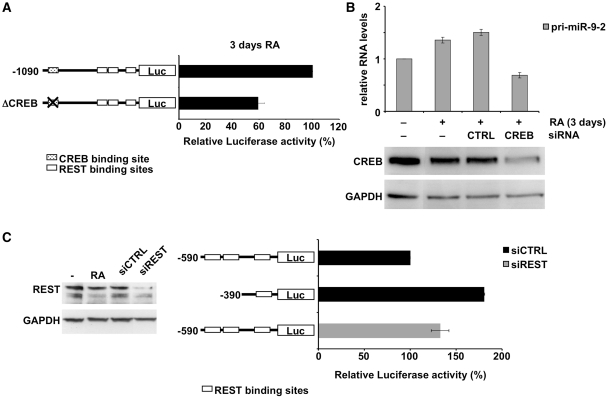
Figure 5. Functional analysis of transcriptional factor activities. (A) Functional analysis of CREB by luciferase assay. Cells were transfected with the constructs, represented aside each histogram bar, and grown in the presence or in the absence of RA. Values for each construct were calculated as the ratio of luciferase activities in 3 days RA-treated versus untreated cells, normalized against control cells transfected with the −1090 construct, and expressed as percentage. (B) Upper panel: functional analysis of CREB by knock down experiment. Cells treated with RA for 3 days (+RA) were transfected with siRNAs against CREB (CREB siRNA) or with an unrelated siRNA (CTRL siRNA). Results are based on qRT–PCR analysis of pri-miR-9-2 levels. Error bars in the histograms represent the standard deviation obtained from three independent experiments. Lower panel: western blot analysis of CREB levels in untreated (lane −RA), RA-treated (lanes +RA), and CREB-interfered cells (lane CREB siRNA). The anti-CREB RNAi caused a 60% decrease in protein level as evaluated from three independent experiments. As control, cells transfected with an unrelated siRNA were utilized (lane CTRL siRNA). GAPDH was employed as a loading control. (C) Left panel: western blot analysis of REST levels in untreated (lane −), 3 days RA-treated (lane RA), and REST-interfered cells (lane siREST). The anti-REST RNAi caused a 80% decrease in protein level as evaluated from three independent experiments. As control, cells transfected with an unrelated siRNA were utilized (lane siCTRL). GAPDH was employed as a loading control. Right panel: functional analysis of REST. Luciferase-based constructs, represented aside each histogram bar, were co-transfected with an unrelated siRNA (black bars) or with siRNAs-interfering for REST expression (grey bar) in proliferating cells. Luciferase activity was normalized against control cells transfected with the −590 construct and the control siRNA, and expressed as percentage. Error bars in the histograms represent the standard deviation obtained from three independent experiments. In both (A) and (C) panels, the binding sites for CREB and REST are depicted as dotted and white boxes, respectively.
Figure 5. Functional analysis of transcriptional factor activities. (A) Functional analysis of CREB by luciferase assay. Cells were transfected with the constructs, represented aside each histogram bar, and grown in the presence or in the absence of RA. Values for each construct were calculated as the ratio of luciferase activities in 3 days RA-treated versus untreated cells, normalized against control cells transfected with the −1090 construct, and expressed as percentage. (B) Upper panel: functional analysis of CREB by knock down experiment. Cells treated with RA for 3 days (+RA) were transfected with siRNAs against CREB (CREB siRNA) or with an unrelated siRNA (CTRL siRNA). Results are based on qRT–PCR analysis of pri-miR-9-2 levels. Error bars in the histograms represent the standard deviation obtained from three independent experiments. Lower panel: western blot analysis of CREB levels in untreated (lane −RA), RA-treated (lanes +RA), and CREB-interfered cells (lane CREB siRNA). The anti-CREB RNAi caused a 60% decrease in protein level as evaluated from three independent experiments. As control, cells transfected with an unrelated siRNA were utilized (lane CTRL siRNA). GAPDH was employed as a loading control. (C) Left panel: western blot analysis of REST levels in untreated (lane −), 3 days RA-treated (lane RA), and REST-interfered cells (lane siREST). The anti-REST RNAi caused a 80% decrease in protein level as evaluated from three independent experiments. As control, cells transfected with an unrelated siRNA were utilized (lane siCTRL). GAPDH was employed as a loading control. Right panel: functional analysis of REST. Luciferase-based constructs, represented aside each histogram bar, were co-transfected with an unrelated siRNA (black bars) or with siRNAs-interfering for REST expression (grey bar) in proliferating cells. Luciferase activity was normalized against control cells transfected with the −590 construct and the control siRNA, and expressed as percentage. Error bars in the histograms represent the standard deviation obtained from three independent experiments. In both (A) and (C) panels, the binding sites for CREB and REST are depicted as dotted and white boxes, respectively.CC BY-NC · PubMed Central
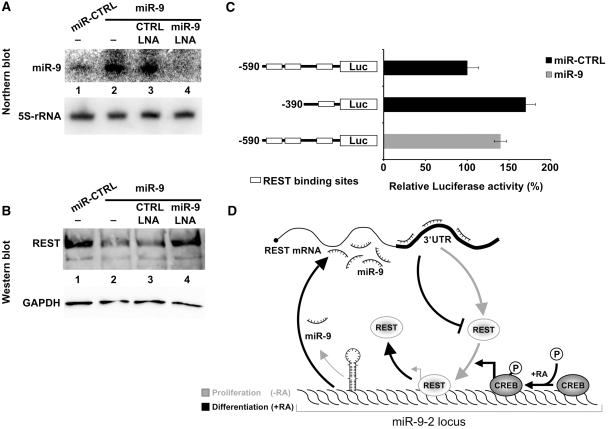
Figure 6. Feed-back regulatory loop between miR-9 and REST. (A) The ectopic expression of miR-9 was verified by northern blot (lanes 2–4) and normalized with respect to 5S-rRNA expression. SK-N-BE cells were transfected with the plasmid overexpressing miR-9 in the absence of LNA (lane 2), or together with a control LNA (lane 3), or with the anti-miR-9 LNA (lane 4). RNA from cells transfected with the control plasmid expressing an unrelated 21-nt long RNA was analyzed in lane 1. (B) Western blot analysis of REST protein levels. SK-N-BE cells were transfected with the plasmid overexpressing miR-9 in the absence of LNA (lane 2), or together with a control LNA (lane 3), or with the anti-miR-9 LNA (lane 4). The overexpression of miR-9 caused a 70% decrease in protein level (lane 2) as evaluated from three independent experiments. Proteins from cells transfected with the control plasmid expressing an unrelated 21-nt long RNA were analyzed in lane 1. GAPDH protein levels were used as a loading control. (C) Effect of miR-9 over-expression on REST activity. Reporter luciferase-based constructs (indicated on the left) were co-transfected with the control plasmid expressing an unrelated 21-nt long RNA (black bars) or with the plasmid over-expressing miR-9 (grey bar) in proliferating cells. Luciferase activity was normalized against cells transfected with the −590 construct and with the unrelated 21-nt long RNA, and expressed as percentage. Binding sites for REST are depicted as white boxes. Error bars in the histogram represent the standard deviation obtained from three independent experiments. (D) Minicircuitry illustrating the functional interplay between miR-9, REST and CREB. In proliferating SK-N-BE cells (grey arrows), REST occupies miR-9-2 promoter and represses miR-9 expression at the transcriptional level. Upon RA treatment (black arrows) the dismissal of REST and the phosphorylation of CREB, already bound to the promoter, induce miR-9 transcription, which in turn represses REST expression, contributing to the maintenance of the differentiation program.
Figure 6. Feed-back regulatory loop between miR-9 and REST. (A) The ectopic expression of miR-9 was verified by northern blot (lanes 2–4) and normalized with respect to 5S-rRNA expression. SK-N-BE cells were transfected with the plasmid overexpressing miR-9 in the absence of LNA (lane 2), or together with a control LNA (lane 3), or with the anti-miR-9 LNA (lane 4). RNA from cells transfected with the control plasmid expressing an unrelated 21-nt long RNA was analyzed in lane 1. (B) Western blot analysis of REST protein levels. SK-N-BE cells were transfected with the plasmid overexpressing miR-9 in the absence of LNA (lane 2), or together with a control LNA (lane 3), or with the anti-miR-9 LNA (lane 4). The overexpression of miR-9 caused a 70% decrease in protein level (lane 2) as evaluated from three independent experiments. Proteins from cells transfected with the control plasmid expressing an unrelated 21-nt long RNA were analyzed in lane 1. GAPDH protein levels were used as a loading control. (C) Effect of miR-9 over-expression on REST activity. Reporter luciferase-based constructs (indicated on the left) were co-transfected with the control plasmid expressing an unrelated 21-nt long RNA (black bars) or with the plasmid over-expressing miR-9 (grey bar) in proliferating cells. Luciferase activity was normalized against cells transfected with the −590 construct and with the unrelated 21-nt long RNA, and expressed as percentage. Binding sites for REST are depicted as white boxes. Error bars in the histogram represent the standard deviation obtained from three independent experiments. (D) Minicircuitry illustrating the functional interplay between miR-9, REST and CREB. In proliferating SK-N-BE cells (grey arrows), REST occupies miR-9-2 promoter and represses miR-9 expression at the transcriptional level. Upon RA treatment (black arrows) the dismissal of REST and the phosphorylation of CREB, already bound to the promoter, induce miR-9 transcription, which in turn represses REST expression, contributing to the maintenance of the differentiation program.CC BY-NC · PubMed Central

Verification

Claims the paper makes

The claims and statistics of this paper haven’t been checked yet.

Run the check — free, no account needed. It reads the open-access text and checks the sources it cites.

A few free checks a day · papers already verified open instantly · results are public

Claims other papers make about this one

Each is checked against this paper’s own text: does it say what the citing paper says it does?

Self-check

Percentages, sums and reported differences re-computed from the paper’s own numbers.

The self-check needs the paper’s full text.

Citations

Cites

Show all 4 references

Research works printed but not linked: 35

  1. Gao, 2008, Posttranscriptional control of neuronal development by microRNA networks, Trends Neurosci., 31, 20, 10.1016/j.tins.2007.10.004 · DOI
  2. Schratt, 2009, microRNAs at the synapse, Nat Rev Neurosci., 10, 842, 10.1038/nrn2763 · DOI · Paper page
  3. Cullen, 2004, Transcription and processing of human microRNA precursors, Mol. Cell., 16, 861, 10.1016/j.molcel.2004.12.002 · DOI
  4. Kim, 2007, Processing of intronic microRNAs, EMBO J., 26, 775, 10.1038/sj.emboj.7601512 · DOI · Paper page
  5. Morlando, 2008, Primary microRNA transcripts are processed co-transcriptionally, Nat. Struct. Mol. Biol., 15, 902, 10.1038/nsmb.1475 · DOI
  6. Pasquinelli, 2005, MicroRNAs: a developing story, Curr. Opin. Genet. Dev., 15, 200, 10.1016/j.gde.2005.01.002 · DOI
  7. Calin, 2006, MicroRNAs and chromosomal abnormalities in cancer cells, Oncogene, 25, 6202, 10.1038/sj.onc.1209910 · DOI
  8. Zhang, 2007, MicroRNAs in tumorigenesis: a primer, Am. J. Pathol., 171, 728, 10.2353/ajpath.2007.070070 · DOI
  9. Suzuki, 2009, Modulation of microRNA processing by p53, Nature, 460, 529, 10.1038/nature08199 · DOI
  10. Lee, 2009, MicroRNAs in cancer, Annu. Rev. Pathol., 4, 199, 10.1146/annurev.pathol.4.110807.092222 · DOI
  11. Li, 2006, MicroRNA-9a ensures the precise specification of sensory organ precursors in Drosophila, Genes Dev., 20, 2793, 10.1101/gad.1466306 · DOI · Paper page
  12. Leucht, 2008, MicroRNA-9 directs late organizer activity of the midbrain-hindbrain boundary, Nat. Neurosci., 11, 641, 10.1038/nn.2115 · DOI · Paper page
  13. Shibata, 2008, MicroRNA-9 modulates Cajal-Retzius cell differentiation by suppressing Foxg1 expression in mouse medial pallium, J. Neurosci., 28, 10415, 10.1523/JNEUROSCI.3219-08.2008 · DOI · Paper page
  14. Ferretti, 2009, MicroRNA profiling in human medulloblastoma, Int. J. Cancer, 124, 568, 10.1002/ijc.23948 · DOI
  15. Laneve, 2007, The interplay between microRNAs and the neurotrophin receptor tropomyosin-related kinase C controls proliferation of human neuroblastoma cells, Proc. Natl Acad. Sci. USA, 104, 7957, 10.1073/pnas.0700071104 · DOI
  16. Pall, 2008, Improved northern blot method for enhanced detection of small RNA, Nat. Protoc., 3, 1077, 10.1038/nprot.2008.67 · DOI
  17. Deo, 2006, Detection of mammalian microRNA expression by in situ hybridization with RNA oligonucleotides, Dev. Dyn., 235, 2538, 10.1002/dvdy.20847 · DOI
  18. Guenther, 2007, A chromatin landmark and transcription initiation at most promoters in human cells, Cell, 130, 77, 10.1016/j.cell.2007.05.042 · DOI
  19. Ozsolak, 2008, Chromatin structure analyses identify miRNA promoters, Genes Dev., 22, 3172, 10.1101/gad.1706508 · DOI
  20. Ko, 2008, Bioimaging of the unbalanced expression of microRNA9 and microRNA9* during the neuronal differentiation of P19 cells, FEBS J., 275, 2605, 10.1111/j.1742-4658.2008.06408.x · DOI
  21. Flavell, 2008, Genome-wide analysis of MEF2 transcriptional program reveals synaptic target genes and neuronal activity-dependent polyadenylation site selection, Neuron., 60, 1022, 10.1016/j.neuron.2008.11.029 · DOI · Paper page
  22. Ji, 2009, Progressive lengthening of 3′ untranslated regions of mRNAs by alternative polyadenylation during mouse embryonic development, Proc. Natl Acad. Sci. USA, 106, 7028, 10.1073/pnas.0900028106 · DOI
  23. Krichevsky, 2006, Specific microRNAs modulate embryonic stem cell-derived neurogenesis, Stem Cells, 24, 857, 10.1634/stemcells.2005-0441 · DOI · Paper page
  24. Lukiw, 2007, Induction of specific micro RNA (miRNA) species by ROS-generating metal sulfates in primary human brain cells, J. Inorg. Biochem., 101, 1265, 10.1016/j.jinorgbio.2007.06.004 · DOI
  25. Croce, 2009, Causes and consequences of microRNA dysregulation in cancer, Nat. Rev. Genet., 10, 704, 10.1038/nrg2634 · DOI
  26. Tonini, 2003, Genetic and epigenetic alterations in neuroblastoma, Cancer Lett., 197, 69, 10.1016/S0304-3835(03)00081-8 · DOI
  27. Wang, 2009, High-resolution human core-promoter prediction with CoreBoost_HM, Genome Res., 19, 266, 10.1101/gr.081638.108 · DOI
  28. Monteys, 2010, Structure and activity of putative intronic miRNA promoters, RNA, 16, 495, 10.1261/rna.1731910 · DOI · Paper page
  29. Zhou, 2007, Characterization and identification of microRNA core promoters in four model species, PLoS Comput. Biol., 3, e37, 10.1371/journal.pcbi.0030037 · DOI
  30. Lunyak, 2002, Corepressor-dependent silencing of chromosomal regions encoding neuronal genes, Science, 298, 1747, 10.1126/science.1076469 · DOI · Paper page
  31. Impey, 1996, Induction of CRE-mediated gene expression by stimuli that generate long-lasting LTP in area CA1 of the hippocampus, Neuron., 16, 973, 10.1016/S0896-6273(00)80120-8 · DOI · Paper page
  32. Vo, 2005, A cAMP-response element binding protein-induced microRNA regulates neuronal morphogenesis, Proc. Natl Acad. Sci. USA, 102, 16426, 10.1073/pnas.0508448102 · DOI · Paper page
  33. Gonzalez, 1989, Cyclic AMP stimulates somatostatin gene transcription by phosphorylation of CREB at serine 133, Cell, 59, 675, 10.1016/0092-8674(89)90013-5 · DOI
  34. Wu, 2006, Comparative sequence analysis reveals an intricate network among REST, CREB and miRNA in mediating neuronal gene expression, Genome Biol, 7, R85, 10.1186/gb-2006-7-9-r85 · DOI · Paper page
  35. Conaco, 2006, Reciprocal actions of REST and a microRNA promote neuronal identity, Proc. Natl Acad. Sci. USA, 103, 2422, 10.1073/pnas.0511041103 · DOI · Paper page

Cited by

Sorted by citations

Metadata

Authors
Laneve, P., Gioia, U., Andriotto, A., Moretti, F., Bozzoni, I., & Caffarelli, E.
Venue
Nucleic Acids Research
Published
2010-07-12
Volume
38
Issue
20
Pages
6895-6905
ISSN
  • 1362-4962
  • 0305-1048
Cited by
110
References
4
Language
en

About these checks

Registry, retraction, Cites and statistics results are computed, not judged, with one exception: a printed reference that no index lists is read once by a model before it counts as a citation error. Claims are extracted by a model and kept only when their quote appears verbatim in the text; each cited source is then checked, with a model’s help, for whether it says what the claim relies on. Those verdicts can be wrong — read the claim’s quote and the cited source before relying on one.

Statistics and arithmetic are recomputed, not judged.

Confidence bands are shown only for fields calibrated on our annotated test set. None is calibrated yet, so no band is shown.

What counts as a claim ›How we measure confidence ›How we check this ›

Are you an author, or do you see a problem with this page? Request a review