

The DOI matches its Crossref record; 16 of the 16 references it cites were found in a registry or an index.
ULK2 is essential for degradation of ubiquitinated protein aggregates and homeostasis in skeletal muscle
Abstract
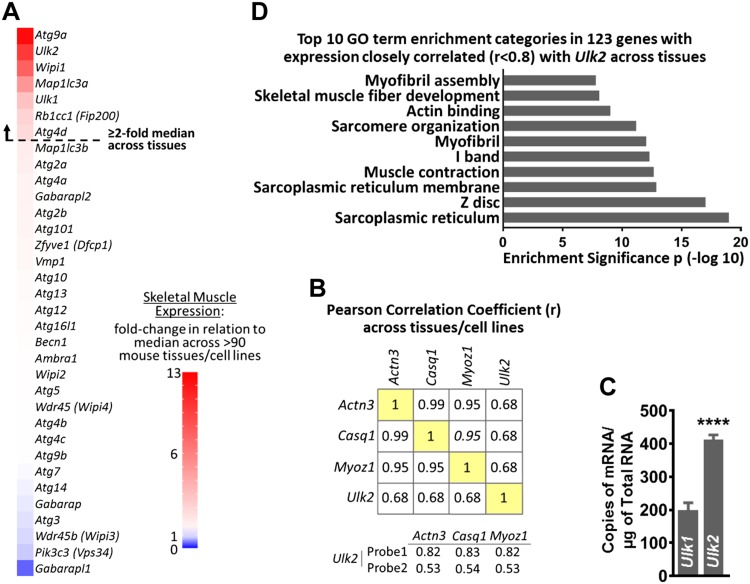
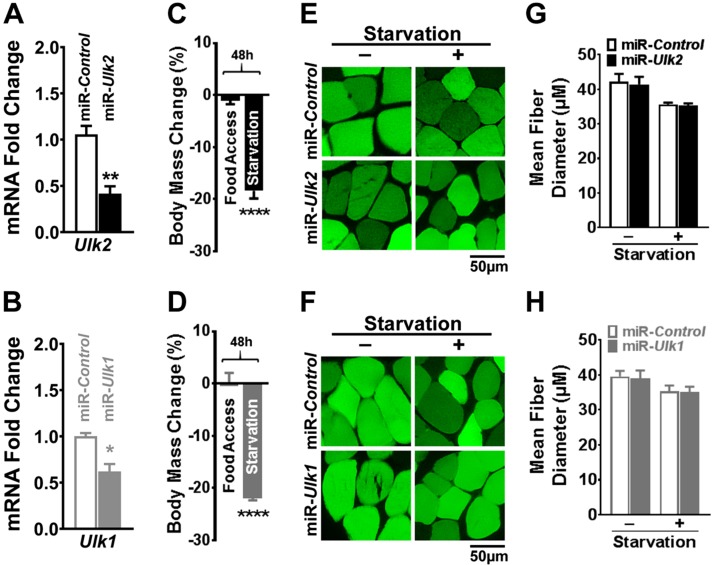
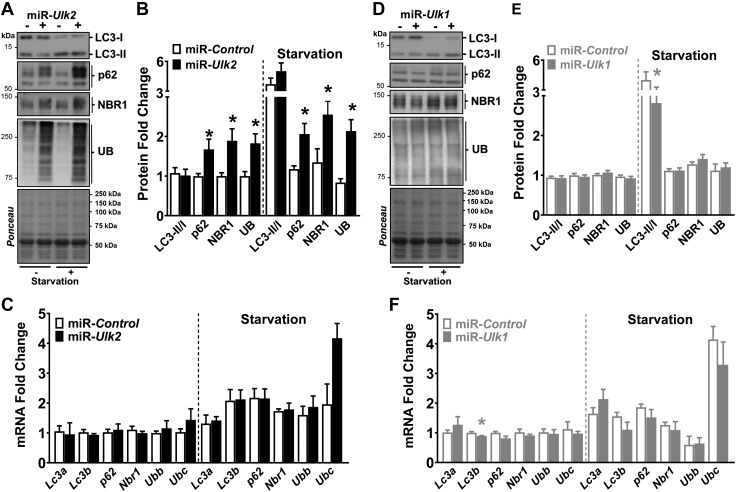
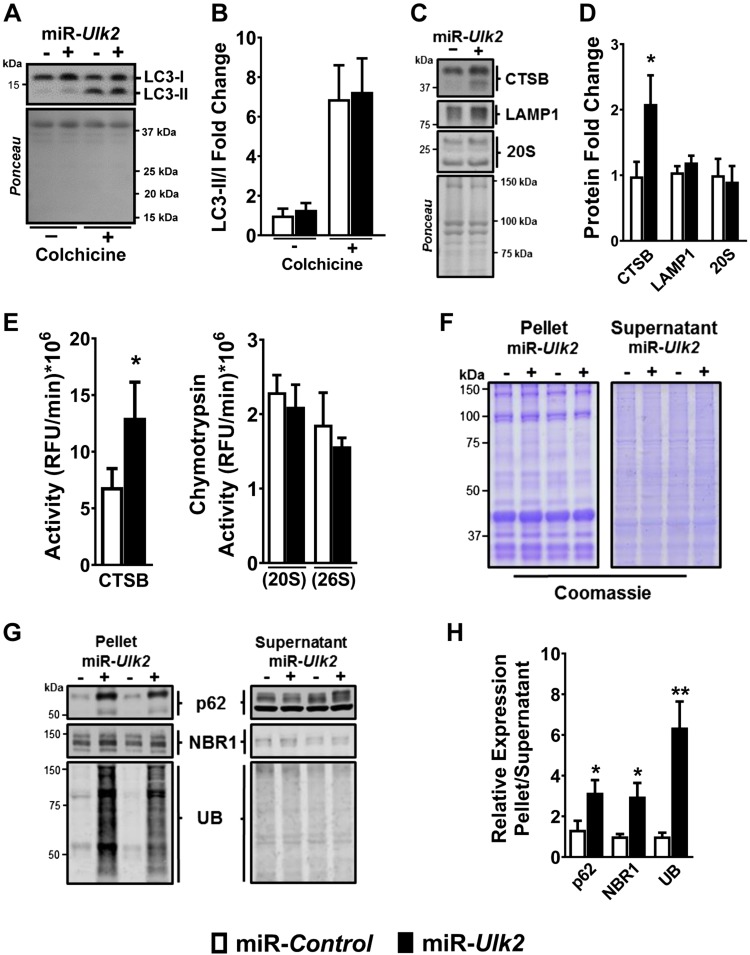
Basal protein turnover, which largely relies on the degradation of ubiquitinated substrates, is instrumental for maintenance of muscle mass and function. However, the regulation of ubiquitinated protein degradation in healthy, nonatrophying skeletal muscle is still evolving, and potential tissue‐specific modulators remain unknown. Using an unbiased expression analysis of 34 putative autophagy genes across mouse tissues, we identified unc‐51 like autophagy activating kinase ( Ulk )2, a homolog of the yeast autophagy related protein 1, as particularly enriched in skeletal muscle. Subsequent experiments revealed accumulations of insoluble ubiquitinated protein aggregates associated with the adaptors sequestosome 1 (SQSTM1, also known as p62) and next to breast cancer type 1 susceptibility protein gene 1 protein (NBR1) in adult muscles with ULK2 deficiency. ULK2 deficiency also led to impaired muscle force and caused myofiber atrophy and degeneration. These features were not observed in muscles with deficiency of the ULK2 paralog, ULK1. Furthermore, short‐term ULK2 deficiency did not impair autophagy initiation, autophagosome to lysosome fusion, or protease activities of the lysosome and proteasome. Altogether, our results indicate that skeletal muscle ULK2 has a unique role in basal selective protein degradation by stimulating the recognition and proteolytic sequestration of insoluble ubiquitinated protein aggregates associated with p62 and NBR1. These findings have potential implications for conditions of poor protein homeostasis in muscles as observed in several myopathies and aging.—Fuqua, J. D., Mere, C. P., Kronemberger, A., Blomme, J., Bae, D., Turner, K. D., Harris, M. P., Scudese, E., Edwards, M., Ebert, S. M., de Sousa, L. G. O., Bodine, S. C., Yang, L., Adams, C. M., Lira, V. A. ULK2 is essential for degradation of ubiquitinated protein aggregates and homeostasis in skeletal muscle. FASEB J. 33, 11735‐11745 (2019). www.fasebj.org
Overview
The claims and statistics of this paper haven’t been checked yet.
Run the check — free, no account needed. It reads the open-access text and checks the sources it cites.
Integrity signals
Registry
Cites
Statistics
Figures
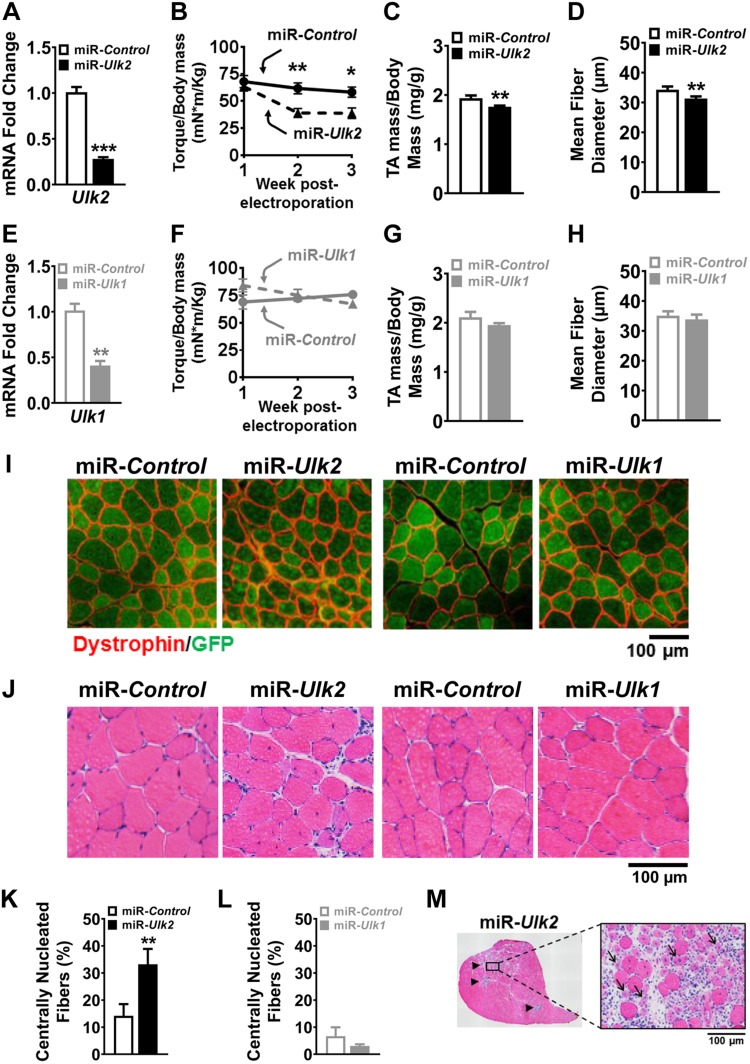
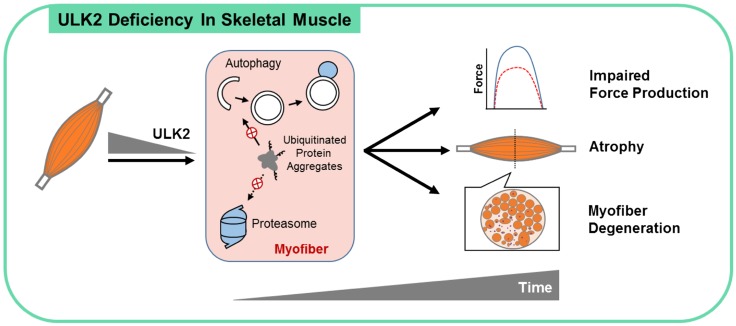
Verification
Claims the paper makes
The claims and statistics of this paper haven’t been checked yet.
Run the check — free, no account needed. It reads the open-access text and checks the sources it cites.
Claims other papers make about this one
Each is checked against this paper’s own text: does it say what the citing paper says it does?
The source backs part of the claim, not all of it — or backs it for a different population, condition or comparison.
In the citing paper
“ULK2 has a higher degree of identity with ULK1 than any of the other homologs”
From Guidelines for the use and interpretation of assays for monitoring autophagy (4th edition) 1 (2021) · cites this paper as [641]
Experimental — accuracy not yet measuredIn the citing paper
“they may have both similar and distinct functions that are tissue-or cell-type specific [637-641]”
From Guidelines for the use and interpretation of assays for monitoring autophagy (4th edition) 1 (2021) · cites this paper as [641]
Self-check
Percentages, sums and reported differences re-computed from the paper’s own numbers.
The self-check needs the paper’s full text.
Citations
Cites
Guidelines for the use and interpretation of assays for monitoring autophagy (3rd edition).
Klionsky, D. J., Abdelmohsen, K., Abe, A., Abedin, M. J., Abeliovich, H., Acevedo Arozena, A., Adachi, H., Adams, C. M., Adams, P. D., Adeli, K., et al. (2016) · Autophagy · doi:10.1080/15548627.2015.1100356 · Cited by 5,894
Self-citationAutophagy is required to maintain muscle mass.
Masiero, E., Agatea, L., Mammucari, C., Blaauw, B., Loro, E., Komatsu, M., Metzger, D., Reggiani, C., Schiaffino, S., & Sandri, M. (2009) · Cell Metabolism · doi:10.1016/j.cmet.2009.10.008 · Cited by 1,282
Ubiquitination and selective autophagy
Shaid, S., Brandts, C. H., Serve, H., & Dikic, I. (2013) · Cell Death & Differentiation · doi:10.1038/cdd.2012.72 · Cited by 800
Milan, G., Romanello, V., Pescatore, F., Armani, A., Paik, J.-H., Frasson, L., Seydel, A., Zhao, J., Abraham, R., Goldberg, A. L., et al. (2015) · Nature Communications · doi:10.1038/ncomms7670 · Cited by 709
Thiebaud, D., Jacot, E., Defronzo, R. A., Maeder, E., Jequier, E., & Felber, J.-P. (1982) · Diabetes · doi:10.2337/diacare.31.11.957 · Cited by 489
Lira, V. A., Okutsu, M., Zhang, M., Greene, N. P., Laker, R. C., Breen, D. S., Hoehn, K. L., & Yan, Z. (2013) · The FASEB Journal · doi:10.1096/fj.13-228486 · Cited by 432
Self-citationRaben, N., Hill, V., Shea, L., Takikita, S., Baum, R., Mizushima, N., Ralston, E., & Plotz, P. (2008) · Human Molecular Genetics · doi:10.1093/hmg/ddn292 · Cited by 352 · cited 1×
“Indeed, skeletal muscle is directly compromised by proteotoxic gene mutations such as in amyotrophic lateral sclerosis (12) and Huntington’s disease (13), or by defects in proteolysis such as in Danon disease (14), Pompe disease (15), and collagen VImuscular dystrophy (16).”
BackgroundVisser, M., & Schaap, L. A. (2011) · Clinics in Geriatric Medicine · doi:10.1016/j.cger.2011.03.006 · Cited by 320
Buford, T. W., Anton, S. D., Judge, A. R., Marzetti, E., Wohlgemuth, S. E., Carter, C. S., Leeuwenburgh, C., Pahor, M., & Manini, T. M. (2010) · Ageing Research Reviews · doi:10.1016/j.arr.2010.04.004 · Cited by 295
Physiopathological Mechanism of Sarcopenia
Walrand, S., Guillet, C., Salles, J., Cano, N., & Boirie, Y. (2011) · Clinics in Geriatric Medicine · doi:10.1016/j.cger.2011.03.005 · Cited by 235
Stress-induced Skeletal Muscle Gadd45a Expression Reprograms Myonuclei and Causes Muscle Atrophy
Ebert, S. M., Dyle, M. C., Kunkel, S. D., Bullard, S. A., Bongers, K. S., Fox, D. K., Dierdorff, J. M., Foster, E. D., & Adams, C. M. (2012) · Journal of Biological Chemistry · doi:10.1074/jbc.m112.374777 · Cited by 221
Self-citationThe requirement of uncoordinated 51-like kinase 1 (ULK1) and ULK2 in the regulation of autophagy
Lee, E.-J., & Tournier, C. (2011) · Autophagy · doi:10.4161/auto.7.7.15450 · Cited by 186
Zhou, J., Chong, S. Y., Lim, A., Singh, B. K., Sinha, R. A., Salmon, A. B., & Yen, P. M. (2017) · Aging · doi:10.18632/aging.101181 · Cited by 126
Proteasome dysfunction induces muscle growth defects and protein aggregation
Kitajima, Y., Tashiro, Y., Suzuki, N., Warita, H., Kato, M., Tateyama, M., Ando, R., Izumi, R., Yamazaki, M., Abe, M., et al. (2014) · Journal of Cell Science · doi:10.1242/jcs.150961 · Cited by 79 · cited 1×
“To this matter, skeletal muscle protein degradation is executed by several proteolytic systems, including calpains (19), caspases (20), the proteasomal system (21), and the autophagy-lysosomal system or macroautophagy (22).”
BackgroundGavriilidis, C., Laredj, L., Solinhac, R., Messaddeq, N., Viaud, J., Laporte, J., Sumara, I., & Hnia, K. (2018) · Nature Cell Biology · doi:10.1038/s41556-017-0024-9 · Cited by 56 · cited 2×
“Protein aggregates were isolated using an adapted protocol (11, 37).”
MethodSporadic inclusion body myositis: possible pathogenesis inferred from biomarkers.
Weihl, C. C., & Pestronk, A. (2010) · Current Opinion in Neurology · doi:10.1097/wco.0b013e32833d3897 · Cited by 51
Research works printed but not linked: 38
- 10.5455/aim.2014.22.406-410 · DOI
- 10.1301/nr.2003.may.157-167 · DOI
- 10.1097/01241398-200001000-00016 · DOI
- 10.2337/diab.30.12.1000 · DOI · Paper page
- 10.1056/NEJM199612193352507 · DOI
- 10.1126/science.aac4354 · DOI
- 10.1016/j.cmet.2008.09.002 · DOI · Paper page
- 10.1085/jgp.201611603 · DOI
- 10.1038/35022604 · DOI · Paper page
- 10.1038/nm.2247 · DOI · Paper page
- 10.18632/aging.101141 · DOI
- 10.1073/pnas.95.21.12100 · DOI
- 10.1073/pnas.162172899 · DOI
- 10.1074/jbc.273.39.25216 · DOI
- 10.1681/ASN.2006010083 · DOI · Paper page
- 10.1016/j.cell.2010.01.028 · DOI · Paper page
- 10.1152/physrev.00030.2009 · DOI
- 10.1016/j.ceb.2009.11.014 · DOI · Paper page
- 10.1186/1745-7580-4-5 · DOI
- 10.1038/nprot.2008.211 · DOI · Paper page
- 10.1093/nar/gkn923 · DOI · Paper page
- 10.4161/auto.6.7.12785 · DOI · Paper page
- 10.1016/j.ymeth.2014.12.019 · DOI
- 10.1371/journal.pone.0119382 · DOI
- 10.1172/JCI86522 · DOI
- 10.1152/ajpendo.00380.2013 · DOI
- 10.1152/ajpcell.00104.2009 · DOI · Paper page
- 10.1074/jbc.M703663200 · DOI · Paper page
- 10.1016/j.molcel.2011.06.018 · DOI · Paper page
- 10.1080/15548627.2016.1140293 · DOI · Paper page
- 10.1093/hmg/8.5.813 · DOI
- 10.1038/s41598-017-08480-2 · DOI
- 10.1128/MCB.24.18.8055-8068.2004 · DOI
- 10.1074/jbc.M114.567032 · DOI · Paper page
- 10.4161/auto.26563 · DOI · Paper page
- 10.1128/MCB.01082-08 · DOI · Paper page
- 10.1016/j.molcel.2011.07.039 · DOI
- 10.1371/journal.pgen.1004987 · DOI
Cited by
Sorted by citations
Guidelines for the use and interpretation of assays for monitoring autophagy (4th edition) 1
Klionsky, D. J., Abdel-Aziz, A. K., Abdelfatah, S., Abdellatif, M., Abdoli, A., Abel, S., Abeliovich, H., Abildgaard, M. H., Abudu, Y. P., Acevedo-Arozena, A., et al. (2021) · Autophagy · doi:10.1080/15548627.2020.1797280 · Cited by 2,897
Self-citationMechanisms of muscle atrophy and hypertrophy: implications in health and disease
Sartori, R., Romanello, V., & Sandri, M. (2021) · Nature Communications · doi:10.1038/s41467-020-20123-1 · Cited by 940
Metadata
- Authors
- Fuqua, J. D., Mere, C. P., Kronemberger, A., Blomme, J., Bae, D., Turner, K. D., Harris, M. P., Scudese, E., Edwards, M., Ebert, S. M., de Sousa, L. G. O., Bodine, S. C., Yang, L., Adams, C. M., & Lira, V. A.
- Venue
- The FASEB Journal
- Publisher
- Wiley
- Published
- 2019-08-09
- Volume
- 33
- Issue
- 11
- Pages
- 11735-12745
- ISSN
- 0892-6638
- 1530-6860
- PMC
- PMC6902739
- Cited by
- 47
- References
- 16
- Language
- en
- Funders
- American Heart Association (16SDG30360001)
About these checks
Registry, retraction, Cites and statistics results are computed, not judged, with one exception: a printed reference that no index lists is read once by a model before it counts as a citation error. Claims are extracted by a model and kept only when their quote appears verbatim in the text; each cited source is then checked, with a model’s help, for whether it says what the claim relies on. Those verdicts can be wrong — read the claim’s quote and the cited source before relying on one.
Statistics and arithmetic are recomputed, not judged.
Confidence bands are shown only for fields calibrated on our annotated test set. None is calibrated yet, so no band is shown.
What counts as a claim ›How we measure confidence ›How we check this ›
Are you an author, or do you see a problem with this page? Request a review
