PreprintCited by 12Wnt/β-catenin signaling in development and cancerSignaling Pathways in DiseaseProtein Kinase Regulation and GTPase Signaling

The DOI matches its Crossref record; 1 of the 1 references it cites were found in a registry or an index.

Protein proximity networks and functional evaluation of the Casein Kinase 1 γ family reveals unique roles for CK1 γ 3 in WNT signaling

Open access

Preprint — published as 10.1016/j.jbc.2022.101986

Abstract

The WNT/ β -catenin signaling pathway is evolutionarily conserved and controls normal embryonic development, adult tissue homeostasis and regeneration. Aberrant activation or suppression of WNT signaling contributes to cancer initiation and progression, developmental disorders, neurodegeneration, and bone disease. Despite great need and more than 40 years of research, targeted therapies for the WNT pathway have yet to be fully realized. Kinases are exceptionally druggable and occupy key nodes within the WNT signaling network, but several pathway-relevant kinases remain understudied and ‘dark’. Here we studied the function of the CSNK1 γ subfamily of human kinases. miniTurbo-based proximity biotinylation and mass spectrometry analysis of CSNK1 γ 1, CSNK1 γ 2, and CSNK1 γ 3 revealed numerous established components of the β -catenin- dependent and independent WNT signaling pathway, as well as novel interactors. In gain-of- function experiments leveraging a panel of transcriptional reporters, CSNK1 γ 3 but not CSNK1 γ 1 or CSNK1 γ 2 activated β -catenin-dependent WNT signaling and the Notch pathway. Within the family, CSNK1 γ 3 expression uniquely induced LRP6 phosphorylation. Conversely, siRNA- mediated silencing of CSNK1 γ 3 alone had no impact on WNT signaling, though co-silencing of all three family members decreased WNT pathway activity. We characterized two moderately selective and potent small molecule inhibitors of the CSNK1 γ family. These inhibitors and a CSNK1 γ 3 kinase dead mutant suppressed but did not eliminate WNT-driven LRP6 phosphorylation and β -catenin stabilization. Our data suggest that while CSNK1 γ 3 expression uniquely drives pathway activity, potential functional redundancy within the family necessitates loss of all three family members to suppress the WNT signaling pathway.

Overview

The claims and statistics of this paper haven’t been checked yet.

Run the check — free, no account needed. It reads the open-access text and checks the sources it cites.

A few free checks a day · papers already verified open instantly · results are public

Integrity signals

Registry

Crossref · 10.1101/2021.11.30.470617

Cites

1 of 1 references verified0 citation errors · 0 not checkable

Statistics

Figures

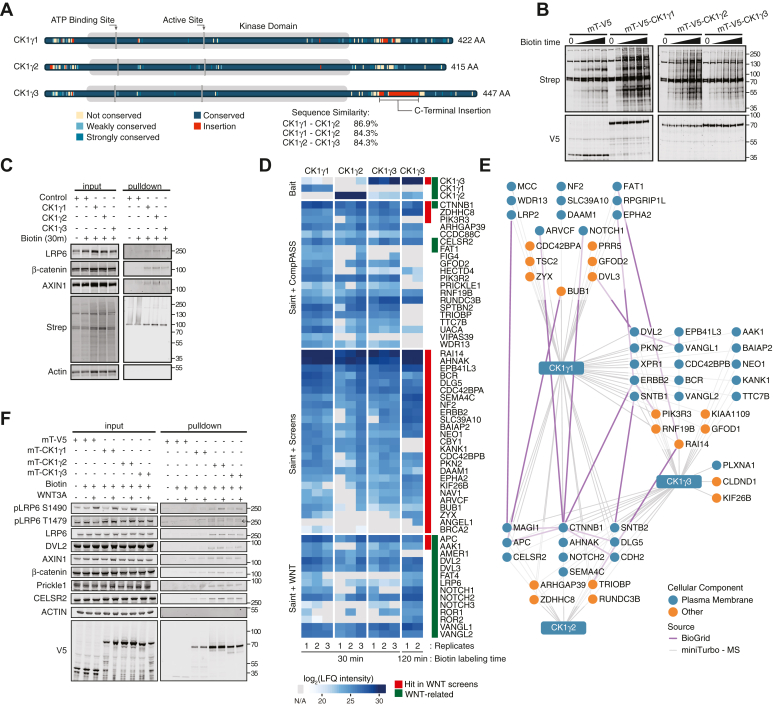
Figure 1 CK1γ proximity-based interaction networks identify WNT components.A, schematic of CK1γ family highlighting conserved amino acids and sequence similarity between family members. B, W. blot analysis of HEK293T cells stably expressing mini-Turbo CK1γ or V5 control incubated with 50 mM of biotin over a time course (untreated, 15 min, 30 min, 45 min, 1 h, and 2 h). C, W. blot analysis of streptavidin affinity pulldown from stable HEK293T cells expressing mini-Turbo CK1γ or V5, treated as indicated. D, heat map demonstrating changes in log2(LFQ intensity) of protein proximity partners for the CK1γ subfamily. Red track indicates hits in previously published WNT screens (Tables S1 and S2). Green track indicates well-established proteins involved in WNT/β-catenin-dependent and WNT/β-catenin-independent signaling. E, streptavidin affinity purification mass spectrometry (APMS) proximity networks for CK1γ1, CK1γ2, and CK1γ. HEK293T cells stably expressing mT-V5-CK1γ were treated with 50 mM biotin for 30 min before streptavidin APMS. Blue circle indicates localization to the plasma membrane. Gray lines represent bait–prey interactions. Purple lines indicate prey–prey interactions collected from the BioGRID database. F, W. blot validation of mT-CK1γ protein–protein interaction networks treated with biotin and WNT3A CM for 30 min. CK1γ, casein kinase 1γ; CM, conditioned media; HEK293T, human embryonic kidney 293T cell line; LFQ, label-free quantitation; W. blot, Western blot.
Figure 1 CK1γ proximity-based interaction networks identify WNT components.A, schematic of CK1γ family highlighting conserved amino acids and sequence similarity between family members. B, W. blot analysis of HEK293T cells stably expressing mini-Turbo CK1γ or V5 control incubated with 50 mM of biotin over a time course (untreated, 15 min, 30 min, 45 min, 1 h, and 2 h). C, W. blot analysis of streptavidin affinity pulldown from stable HEK293T cells expressing mini-Turbo CK1γ or V5, treated as indicated. D, heat map demonstrating changes in log2(LFQ intensity) of protein proximity partners for the CK1γ subfamily. Red track indicates hits in previously published WNT screens (Tables S1 and S2). Green track indicates well-established proteins involved in WNT/β-catenin-dependent and WNT/β-catenin-independent signaling. E, streptavidin affinity purification mass spectrometry (APMS) proximity networks for CK1γ1, CK1γ2, and CK1γ. HEK293T cells stably expressing mT-V5-CK1γ were treated with 50 mM biotin for 30 min before streptavidin APMS. Blue circle indicates localization to the plasma membrane. Gray lines represent bait–prey interactions. Purple lines indicate prey–prey interactions collected from the BioGRID database. F, W. blot validation of mT-CK1γ protein–protein interaction networks treated with biotin and WNT3A CM for 30 min. CK1γ, casein kinase 1γ; CM, conditioned media; HEK293T, human embryonic kidney 293T cell line; LFQ, label-free quantitation; W. blot, Western blot.CC BY · PubMed Central
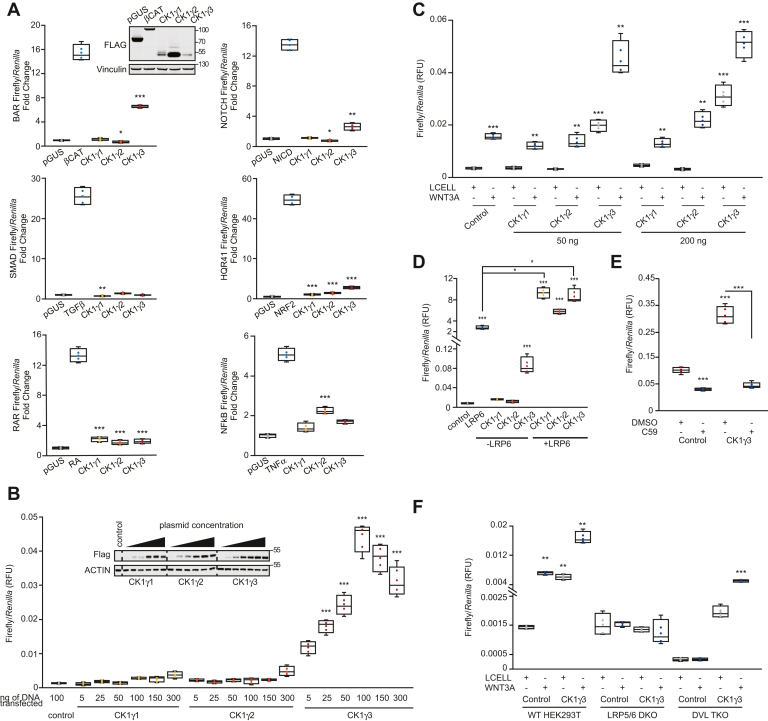
Figure 2 Low-throughput reporter screen identifies CK1γ3 as an activator of WNT signaling.A, HEK293T cells were transiently transfected for 30 h with 100 ng of indicated positive control (β-catenin, NRF2, and NICD) construct or pGUS negative control or the indicated CK1γ construct. About 40 ng TK-Renilla and 40 ng of the indicated Response Element–Luciferase construct was included. Where indicated, cells were treated with (TGFβ 10 ng/ml, TNFα 10 ng/ml, and retinoic acid [RA] 10 ng/ml) for 6 h (TGFβ and TNFα) or 16 h (RA). Inset W. blot demonstrates protein overexpression for the BAR luciferase assay. Each condition was normalized to pGUS control. Error bars represent standard deviation, and statistics are compared to pGUS control. B, BAR luciferase assay from HEK293T B/R (stable BAR-firefly luciferase, TK-Renilla–expressing cell line) cells transfected for 24 h with indicated DNA mass. Statistics are compared to pGUS control. Inset blot is confirmation of overexpression for luciferase assay in B. Dashed line represents cropped blot for removal of redundant untreated sample. C, HEK293T B/R cells were transfected with the indicated construct for 14 h and then treated with Lcell or WNT3A CM for 16 h. All statistics are compared to FLAG-Control Lcell sample. D, HEK293T B/R cells were transfected with the indicated construct for 24 h before luciferase quantitation. Statistics are compared to pGUS control. E, HEK293T B/R cells were transfected with the indicated construct for 14 h and then treated with 10 μM C59 for 18 h. F, WT, LRP5/6 DKO, DVL TKO HEK293T cells transfected with 20 ng BAR-luciferase, 10 ng TK-Renilla, and 70 ng of indicated constructs for 14 h, and then treated with either Lcell CM or WNT3A CM for 18 h. Statistical significance presented is compared with Lcell-treated FLAG-Control cells for each cell type. For all panels: ∗∗∗p < 0.0005, ∗∗p < 0.005, and ∗p < 0.05. All data are plotted as box-and-whisker plots, with the boxes representing the median and the interquartile range. All biological replicates are averaged across three technical replicates. Statistical significance was evaluated by Student’s t test. CK1γ3, casein kinase 1γ3; CM, conditioned media; DKO, double KO; DVL, disheveled; HEK293T, human embryonic kidney 293T cell line; LRP, low-density lipoprotein receptor–related protein; NICD, Notch intracellular domain; NRF2, nuclear factor erythroid 2–related factor 2; TGFβ, transforming growth factor beta; TKO, triple KO; TNFα, tumor necrosis factor alpha; W. blot, Western blot.
Figure 2 Low-throughput reporter screen identifies CK1γ3 as an activator of WNT signaling.A, HEK293T cells were transiently transfected for 30 h with 100 ng of indicated positive control (β-catenin, NRF2, and NICD) construct or pGUS negative control or the indicated CK1γ construct. About 40 ng TK-Renilla and 40 ng of the indicated Response Element–Luciferase construct was included. Where indicated, cells were treated with (TGFβ 10 ng/ml, TNFα 10 ng/ml, and retinoic acid [RA] 10 ng/ml) for 6 h (TGFβ and TNFα) or 16 h (RA). Inset W. blot demonstrates protein overexpression for the BAR luciferase assay. Each condition was normalized to pGUS control. Error bars represent standard deviation, and statistics are compared to pGUS control. B, BAR luciferase assay from HEK293T B/R (stable BAR-firefly luciferase, TK-Renilla–expressing cell line) cells transfected for 24 h with indicated DNA mass. Statistics are compared to pGUS control. Inset blot is confirmation of overexpression for luciferase assay in B. Dashed line represents cropped blot for removal of redundant untreated sample. C, HEK293T B/R cells were transfected with the indicated construct for 14 h and then treated with Lcell or WNT3A CM for 16 h. All statistics are compared to FLAG-Control Lcell sample. D, HEK293T B/R cells were transfected with the indicated construct for 24 h before luciferase quantitation. Statistics are compared to pGUS control. E, HEK293T B/R cells were transfected with the indicated construct for 14 h and then treated with 10 μM C59 for 18 h. F, WT, LRP5/6 DKO, DVL TKO HEK293T cells transfected with 20 ng BAR-luciferase, 10 ng TK-Renilla, and 70 ng of indicated constructs for 14 h, and then treated with either Lcell CM or WNT3A CM for 18 h. Statistical significance presented is compared with Lcell-treated FLAG-Control cells for each cell type. For all panels: ∗∗∗p < 0.0005, ∗∗p < 0.005, and ∗p < 0.05. All data are plotted as box-and-whisker plots, with the boxes representing the median and the interquartile range. All biological replicates are averaged across three technical replicates. Statistical significance was evaluated by Student’s t test. CK1γ3, casein kinase 1γ3; CM, conditioned media; DKO, double KO; DVL, disheveled; HEK293T, human embryonic kidney 293T cell line; LRP, low-density lipoprotein receptor–related protein; NICD, Notch intracellular domain; NRF2, nuclear factor erythroid 2–related factor 2; TGFβ, transforming growth factor beta; TKO, triple KO; TNFα, tumor necrosis factor alpha; W. blot, Western blot.CC BY · PubMed Central
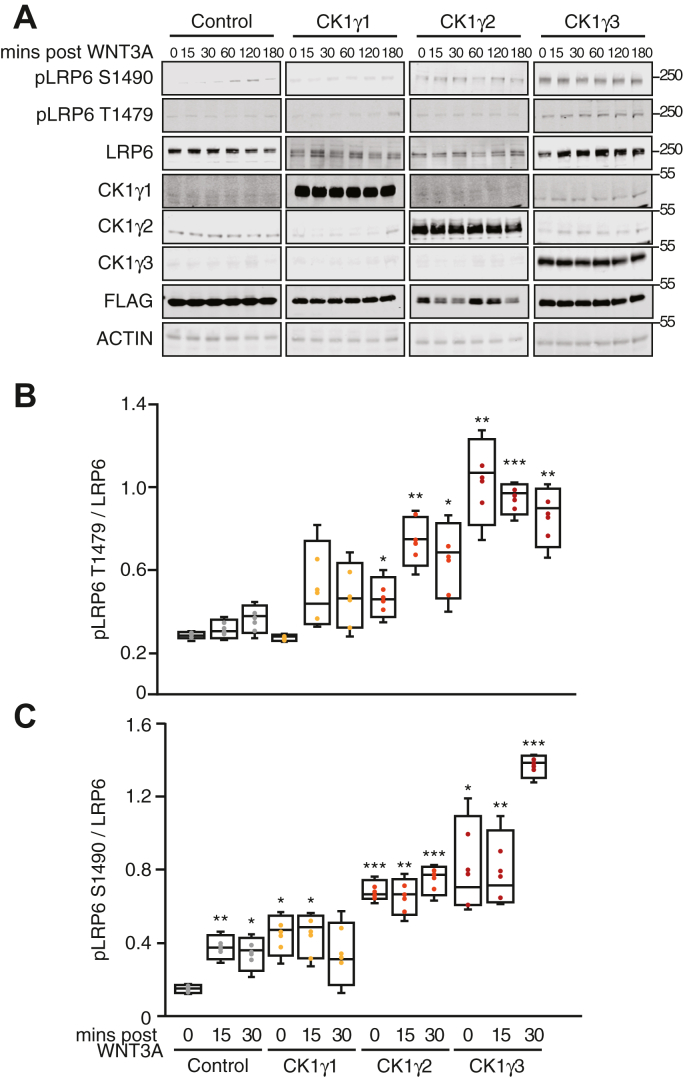
Figure 3 Overexpression of CK1γ3 activates WNT signaling by increasing LRP6 phosphorylation.A, HEK293T cells were transfected with the indicated construct for 14 h and then exposed to WNT3A CM for indicated time and analyzed by W. blot. B and C, quantification of W. blots from A at indicated time points. pLRP6 T1479 (B) and pLRP6 S1490 (C) across four replicates, normalized to total LRP6. For all panels: ∗∗∗p < 0.0005, ∗∗p < 0.005, and ∗p < 0.05. All data are plotted as box-and-whisker plots, with the boxes representing the median and the interquartile range. All biological replicates are averaged across three technical replicates. Statistical significance was evaluated by Student’s t test. All statistics are compared to FLAG-Control untreated sample. CK1γ3, casein kinase 1γ3; CM, conditioned media; HEK293T, human embryonic kidney 293T cell line; LRP6, low-density lipoprotein receptor–related protein 6; W. blot, Western blot.
Figure 3 Overexpression of CK1γ3 activates WNT signaling by increasing LRP6 phosphorylation.A, HEK293T cells were transfected with the indicated construct for 14 h and then exposed to WNT3A CM for indicated time and analyzed by W. blot. B and C, quantification of W. blots from A at indicated time points. pLRP6 T1479 (B) and pLRP6 S1490 (C) across four replicates, normalized to total LRP6. For all panels: ∗∗∗p < 0.0005, ∗∗p < 0.005, and ∗p < 0.05. All data are plotted as box-and-whisker plots, with the boxes representing the median and the interquartile range. All biological replicates are averaged across three technical replicates. Statistical significance was evaluated by Student’s t test. All statistics are compared to FLAG-Control untreated sample. CK1γ3, casein kinase 1γ3; CM, conditioned media; HEK293T, human embryonic kidney 293T cell line; LRP6, low-density lipoprotein receptor–related protein 6; W. blot, Western blot.CC BY · PubMed Central
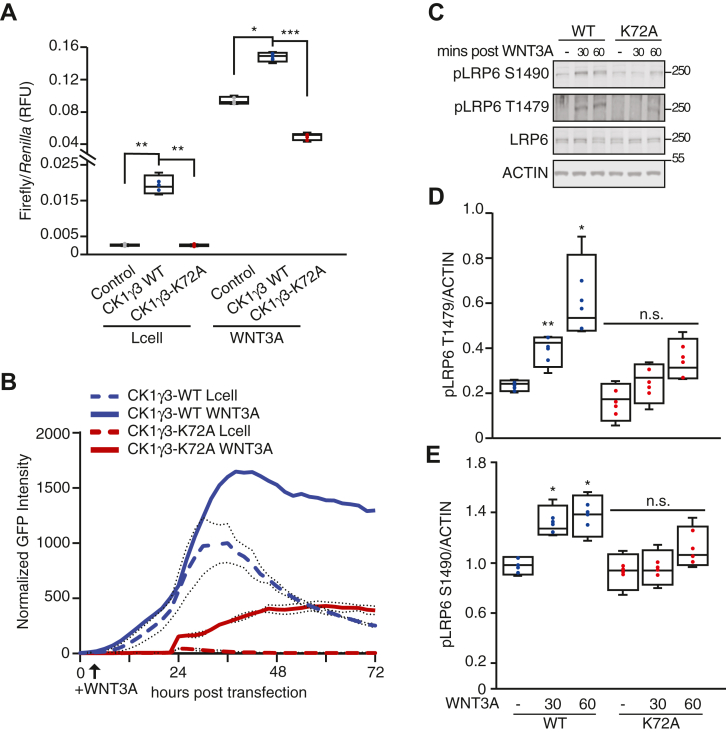
Figure 4 CK1γ3 kinase activity is required for maximum WNT3A activation.A, HEK293T B/R cells were transfected with the indicated construct for 14 h, treated with Lcell or WNT3A CM for 18 h, and then analyzed by luciferase assay. B, live-cell imaging of HEK293T cells stably expressing a BAR-GFP fluorescent reporter transiently transfected with the indicated expression construct, CK1γ3-WT or CK1γ3-K72A. Lcell or WNT3A CM was added at 8 h, and cells were monitored for an additional 72 h. Data are averaged across four replicates. C, HEK293T cells transfected with either CK1γ3-WT or CK1γ3-K72A for 14 h then either untreated or treated with WNT3A CM for 30 or 60 min. Samples were then analyzed by W. blot. D and E, quantification of W. blot from A for indicated time points, pLRP6 T1479 (D) and pLRP6 S1490 (E) across four biological replicates, normalized to total LRP6. All statistics are compared to FLAG-CK1γ3 Lcell sample. For all panels: ∗∗∗p < 0.0005, ∗∗p < 0.005, and ∗p < 0.05. All biological replicates are represented in box-and-whisker plots, with the boxes representing the median and the interquartile range. All biological replicates are averaged across three technical replicates. Statistical significance was evaluated by Student’s t test. CK1γ3, casein kinase 1γ3; CM, conditioned media; HEK293T, human embryonic kidney 293T cell line; LRP6, low-density lipoprotein receptor–related protein 6; W, blot, Western blot.
Figure 4 CK1γ3 kinase activity is required for maximum WNT3A activation.A, HEK293T B/R cells were transfected with the indicated construct for 14 h, treated with Lcell or WNT3A CM for 18 h, and then analyzed by luciferase assay. B, live-cell imaging of HEK293T cells stably expressing a BAR-GFP fluorescent reporter transiently transfected with the indicated expression construct, CK1γ3-WT or CK1γ3-K72A. Lcell or WNT3A CM was added at 8 h, and cells were monitored for an additional 72 h. Data are averaged across four replicates. C, HEK293T cells transfected with either CK1γ3-WT or CK1γ3-K72A for 14 h then either untreated or treated with WNT3A CM for 30 or 60 min. Samples were then analyzed by W. blot. D and E, quantification of W. blot from A for indicated time points, pLRP6 T1479 (D) and pLRP6 S1490 (E) across four biological replicates, normalized to total LRP6. All statistics are compared to FLAG-CK1γ3 Lcell sample. For all panels: ∗∗∗p < 0.0005, ∗∗p < 0.005, and ∗p < 0.05. All biological replicates are represented in box-and-whisker plots, with the boxes representing the median and the interquartile range. All biological replicates are averaged across three technical replicates. Statistical significance was evaluated by Student’s t test. CK1γ3, casein kinase 1γ3; CM, conditioned media; HEK293T, human embryonic kidney 293T cell line; LRP6, low-density lipoprotein receptor–related protein 6; W, blot, Western blot.CC BY · PubMed Central
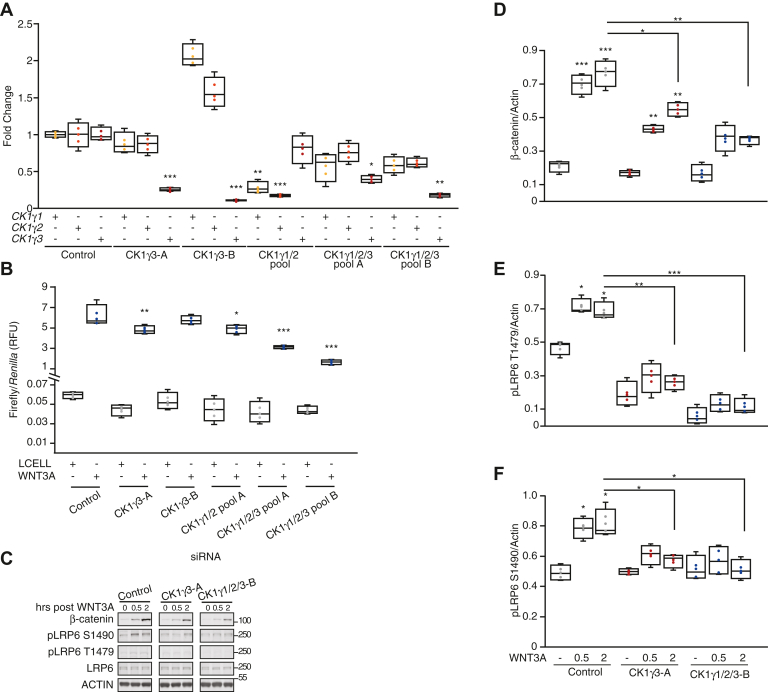
Figure 5 Loss of CK1γ1/2/3 impairs WNT activation.A–C, RKO B/R cells were transfected with indicated siRNA or pooled siRNA for 48 h and then split for the following experiments: 24 h postsplit gene expression was analyzed by RT–qPCR (A), 6 h postsplit cells were treated with WNT3A for 18 h and then analyzed by luciferase assay (B), 24 h postsplit cells were exposed to a WNT3A time course, harvested at the indicated time post WNT3A, and analyzed by W. blot. For A, all statistics are compared to siControl expression for the specific gene. For B, all statistics are compared to siControl WNT3A-treated cells. D–F, quantification of W. blot from E, β-catenin (D), pLRP6 T1479 (E), and pLRP6 S1490 (F) across four replicates, normalized to actin. Statistics are compared to siControl untreated cells, unless otherwise stated. For all panels: ∗∗∗p < 0.0005, ∗∗p < 0.005, and ∗p < 0.05. All biological replicates are represented in box-and-whisker plots, with the boxes representing the median and the interquartile range. All biological replicates are averaged across three technical replicates. Statistical significance was evaluated by Student’s t test. CK1γ, casein kinase 1γ; qPCR, quantitative PCR; W. blot, Western blot.
Figure 5 Loss of CK1γ1/2/3 impairs WNT activation.A–C, RKO B/R cells were transfected with indicated siRNA or pooled siRNA for 48 h and then split for the following experiments: 24 h postsplit gene expression was analyzed by RT–qPCR (A), 6 h postsplit cells were treated with WNT3A for 18 h and then analyzed by luciferase assay (B), 24 h postsplit cells were exposed to a WNT3A time course, harvested at the indicated time post WNT3A, and analyzed by W. blot. For A, all statistics are compared to siControl expression for the specific gene. For B, all statistics are compared to siControl WNT3A-treated cells. D–F, quantification of W. blot from E, β-catenin (D), pLRP6 T1479 (E), and pLRP6 S1490 (F) across four replicates, normalized to actin. Statistics are compared to siControl untreated cells, unless otherwise stated. For all panels: ∗∗∗p < 0.0005, ∗∗p < 0.005, and ∗p < 0.05. All biological replicates are represented in box-and-whisker plots, with the boxes representing the median and the interquartile range. All biological replicates are averaged across three technical replicates. Statistical significance was evaluated by Student’s t test. CK1γ, casein kinase 1γ; qPCR, quantitative PCR; W. blot, Western blot.CC BY · PubMed Central
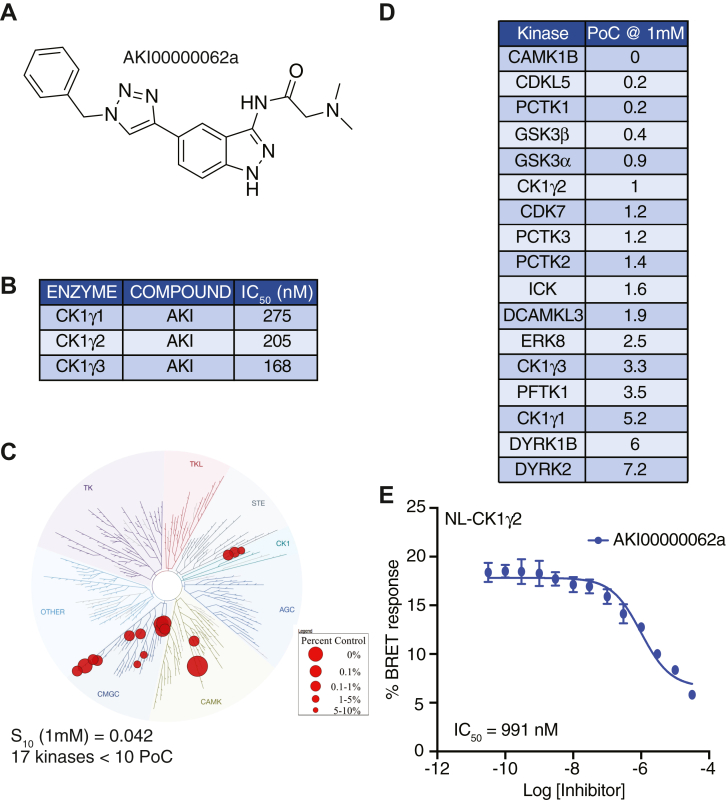
Figure 6 Summary of data for AKI00000062a.A, structure of AKI00000062a. B, enzymatic profiling of AKI00000062a versus CK1γ family kinases. C, kinome tree representation of kinases with PoC <10 when AKI00000062a was profiled at 1 μM versus 403 WT kinases. D, specific kinases (n = 17) with PoC <10 in kinome-wide profiling. E, Nanoluc-CK1γ2 NanoBRET curve, and corresponding IC50 value for AKI00000062a. CK1γ, casein kinase 1γ; PoC, Percent of Control.
Figure 6 Summary of data for AKI00000062a.A, structure of AKI00000062a. B, enzymatic profiling of AKI00000062a versus CK1γ family kinases. C, kinome tree representation of kinases with PoC <10 when AKI00000062a was profiled at 1 μM versus 403 WT kinases. D, specific kinases (n = 17) with PoC <10 in kinome-wide profiling. E, Nanoluc-CK1γ2 NanoBRET curve, and corresponding IC50 value for AKI00000062a. CK1γ, casein kinase 1γ; PoC, Percent of Control.CC BY · PubMed Central
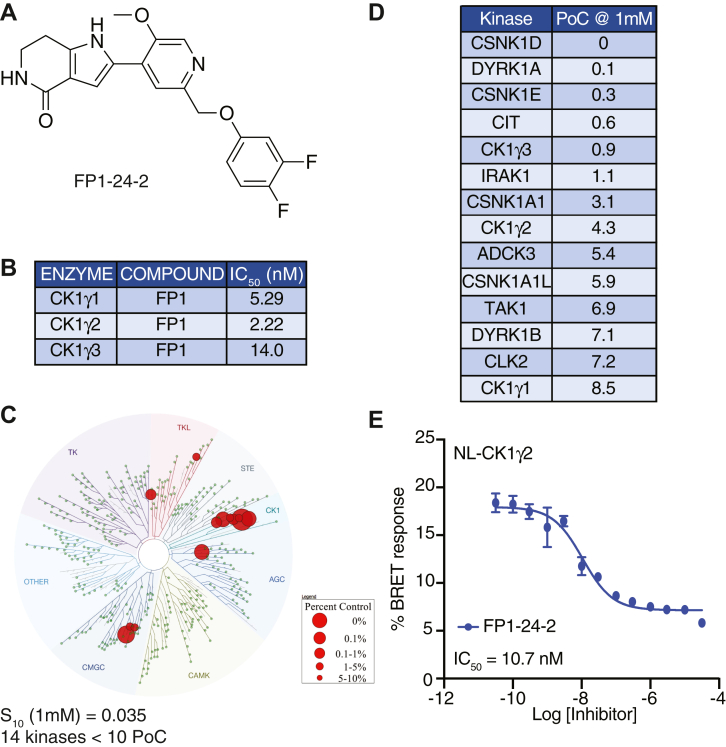
Figure 7 Summary of data for FP1-24-2.A, structure of FP1-24-2. B, enzymatic profiling of FP1-24-2 against CK1γ family kinases. C, kinome tree representation of kinases with PoC <10 when FP1-24-2 was profiled at 1 μM versus 403 WT kinases. D, specific kinases (n = 14) with PoC <10 in kinome-wide profiling. E, Nanoluc-CK1γ2 NanoBRET curve and corresponding IC50 value for FP1-24-2. CK1γ, casein kinase 1γ; PoC, Percent of Control.
Figure 7 Summary of data for FP1-24-2.A, structure of FP1-24-2. B, enzymatic profiling of FP1-24-2 against CK1γ family kinases. C, kinome tree representation of kinases with PoC <10 when FP1-24-2 was profiled at 1 μM versus 403 WT kinases. D, specific kinases (n = 14) with PoC <10 in kinome-wide profiling. E, Nanoluc-CK1γ2 NanoBRET curve and corresponding IC50 value for FP1-24-2. CK1γ, casein kinase 1γ; PoC, Percent of Control.CC BY · PubMed Central
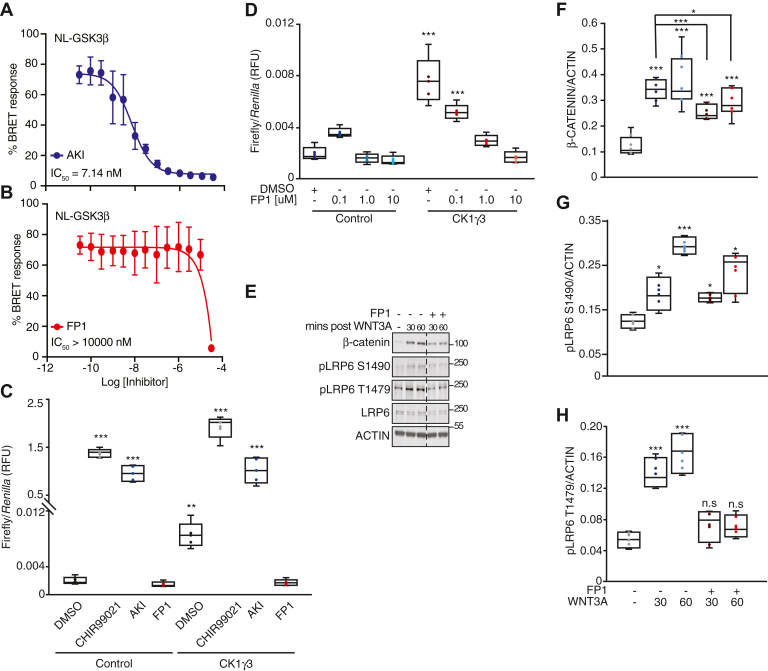
Figure 8 CK1γ inhibition suppresses β-catenin stabilization and LRP6 phosphorylation.A and B, Nanoluc-GSK3β NanoBRET curve and corresponding IC50 value for AKI and FP1, respectively. C, HEK293T B/R cells were transfected with the indicated construct for 14 h and then treated with 10 μM of the indicated compound for 18 h and analyzed by luciferase assay. D, HEK293T B/R cells were transfected with the indicated construct for 14 h, treated with DMSO, 0.1, 1.0, or 10 μM of FP1 for 18 h, and then analyzed by luciferase assay. E, RKO cells were pretreated with FP1 or DMSO for 1 h, treated with WNT3A ligand for 30 or 60 min, and then analyzed by W. blot. Dashed line represents cropped blot for removal of redundant untreated sample. F–H, quantification of W. blot from E, β-catenin (F), pLRP6 S1490 (G), and pLRP6 T1479 (H) across four replicates, normalized to actin. For all panels: ∗∗∗p < 0.0005, ∗∗p < 0.005, and ∗p < 0.05 and are compared to DMSO control unless otherwise indicated. All biological replicates are represented in box-and-whisker plots, with the boxes representing the median and the interquartile range. All biological replicates are averaged across three technical replicates. Statistical significance was evaluated by Student’s t test. AKI, AKI00000062a; CK1γ, casein kinase 1γ; DMSO, dimethyl sulfoxide; FP1, FP1-24-2; GSK3β, glycogen synthase kinase 3β; HEK293T, human embryonic kidney 293T cell line; W. blot, Western blot.
Figure 8 CK1γ inhibition suppresses β-catenin stabilization and LRP6 phosphorylation.A and B, Nanoluc-GSK3β NanoBRET curve and corresponding IC50 value for AKI and FP1, respectively. C, HEK293T B/R cells were transfected with the indicated construct for 14 h and then treated with 10 μM of the indicated compound for 18 h and analyzed by luciferase assay. D, HEK293T B/R cells were transfected with the indicated construct for 14 h, treated with DMSO, 0.1, 1.0, or 10 μM of FP1 for 18 h, and then analyzed by luciferase assay. E, RKO cells were pretreated with FP1 or DMSO for 1 h, treated with WNT3A ligand for 30 or 60 min, and then analyzed by W. blot. Dashed line represents cropped blot for removal of redundant untreated sample. F–H, quantification of W. blot from E, β-catenin (F), pLRP6 S1490 (G), and pLRP6 T1479 (H) across four replicates, normalized to actin. For all panels: ∗∗∗p < 0.0005, ∗∗p < 0.005, and ∗p < 0.05 and are compared to DMSO control unless otherwise indicated. All biological replicates are represented in box-and-whisker plots, with the boxes representing the median and the interquartile range. All biological replicates are averaged across three technical replicates. Statistical significance was evaluated by Student’s t test. AKI, AKI00000062a; CK1γ, casein kinase 1γ; DMSO, dimethyl sulfoxide; FP1, FP1-24-2; GSK3β, glycogen synthase kinase 3β; HEK293T, human embryonic kidney 293T cell line; W. blot, Western blot.CC BY · PubMed Central

Verification

Claims the paper makes

The claims and statistics of this paper haven’t been checked yet.

Run the check — free, no account needed. It reads the open-access text and checks the sources it cites.

A few free checks a day · papers already verified open instantly · results are public

Self-check

Percentages, sums and reported differences re-computed from the paper’s own numbers.

The self-check needs the paper’s full text.

Citations

Cites

Show all 1 references

Research works printed but not linked: 80

  1. 10.1016/j.cell.2006.10.018 · DOI · Paper page
  2. 10.1016/j.cell.2012.05.012 · DOI · Paper page
  3. 10.1016/S0197-0186(02)00056-6 · DOI
  4. 10.1016/j.cell.2017.05.016 · DOI · Paper page
  5. 10.1038/onc.2016.304 · DOI · Paper page
  6. 10.1038/nm.3074 · DOI · Paper page
  7. 10.1186/1476-4598-7-83 · DOI
  8. 10.1186/1471-2407-9-217 · DOI
  9. 10.1593/neo.05607 · DOI
  10. 10.1038/nrc3419 · DOI
  11. 10.1634/theoncologist.2015-0057 · DOI
  12. 10.1038/sj.onc.1210055 · DOI · Paper page
  13. 10.1101/cshperspect.a007898 · DOI · Paper page
  14. 10.3109/08977194.2012.752737 · DOI
  15. 10.1126/science.1228734 · DOI
  16. 10.1073/pnas.96.11.6273 · DOI
  17. 10.1016/S0092-8674(02)00685-2 · DOI
  18. 10.1111/bph.14048 · DOI
  19. 10.1038/nrm2717 · DOI
  20. MacDonald, B. T. , and He, X . (2012) Frizzled and LRP5/6 receptors for Wnt/beta- catenin signaling. Cold Spring Harb Perspect Biol 4 · DOI
  21. 10.1126/science.1137065 · DOI
  22. 10.1016/S1097-2765(01)00224-6 · DOI · Paper page
  23. 10.1242/jcs.067546 · DOI
  24. 10.1016/j.tibs.2009.10.002 · DOI
  25. 10.1016/j.ceb.2014.08.003 · DOI
  26. 10.1128/MCB.01466-10 · DOI
  27. 10.1016/j.celrep.2018.12.023 · DOI
  28. 10.1126/science.1232253 · DOI
  29. 10.1210/me.2009-0084 · DOI
  30. 10.1016/j.pharmthera.2014.11.016 · DOI · Paper page
  31. 10.1038/nature04170 · DOI
  32. 10.1038/nature04185 · DOI
  33. 10.1093/nar/gkaa853 · DOI
  34. 10.4049/jimmunol.1302552 · DOI
  35. 2019, Casein kinase-1gamma1 and 3 stimulate tumor necrosis factor-induced necroptosis through RIPK3, Cell Death Dis, 10, 923, 10.1038/s41419-019-2146-4 · DOI
  36. 10.1016/j.celrep.2016.06.010 · DOI
  37. 10.1242/dev.116715 · DOI
  38. 10.1016/S1097-2765(03)00427-1 · DOI
  39. 10.1016/S0960-9822(03)00370-1 · DOI
  40. 10.1242/jcs.002956 · DOI
  41. 10.1371/journal.pone.0004046 · DOI
  42. 10.1371/journal.pone.0004926 · DOI
  43. 10.1038/nbt.4201 · DOI · Paper page
  44. 10.1126/science.1230593 · DOI · Paper page
  45. 10.1038/nmeth.1541 · DOI · Paper page
  46. 10.1016/j.jprot.2013.10.023 · DOI
  47. 10.1016/j.cell.2015.06.043 · DOI · Paper page
  48. Biechele, T. L. , Kulikauskas, R. M. , Toroni, R. A. , Lucero, O. M. , Swift, R. D. , James, R. G. , Robin, N. C. , Dawson, D. W. , Moon, R. T. , and Chien, A. J . (2012) Wnt/beta-catenin signaling and AXIN1 regulate apoptosis triggered by inhibition of the mutant kinase BRAFV600E in human melanoma. Sci Signal 5, ra3 · DOI
  49. Lebensohn, A. M. , Dubey, R. , Neitzel, L. R. , Tacchelly-Benites, O. , Yang, E. , Marceau, C. D. , Davis, E. M. , Patel, B. B. , Bahrami-Nejad, Z. , Travaglini, K. J. , Ahmed, Y. , Lee, E. , Carette, J. E. , and Rohatgi, R . (2016) Comparative genetic screens in human cells reveal new regulatory mechanisms in WNT signaling. Elife 5 · DOI
  50. 10.1073/pnas.1605691113 · DOI
  51. Major, M. B. , Roberts, B. S. , Berndt, J. D. , Marine, S. , Anastas, J. , Chung, N. , Ferrer, M. , Yi, X. , Stoick-Cooper, C. L. , von Haller, P. D. , Kategaya, L. , Chien, A. , Angers, S. , MacCoss, M. , Cleary, M. A. , Arthur, W. T. , and Moon, R. T. (2008) New regulators of Wnt/beta-catenin signaling revealed by integrative molecular screening. Sci Signal 1, ra12 · DOI
  52. Walker, M. P. , Stopford, C. M. , Cederlund, M. , Fang, F. , Jahn, C. , Rabinowitz, A. D. , Goldfarb, D. , Graham, D. M. , Yan, F. , Deal, A. M. , Fedoriw, Y. , Richards, K. L. , Davis, I. J. , Weidinger, G. , Damania, B. , and Major, M. B . (2015) FOXP1 potentiates Wnt/beta- catenin signaling in diffuse large B cell lymphoma. Sci Signal 8, ra12 · DOI
  53. Tamir, T. Y. , Bowman, B. M. , Agajanian, M. J. , Goldfarb, D. , Schrank, T. P. , Stohrer, T. , Hale, A. E. , Siesser, P. F. , Weir, S. J. , Murphy, R. M. , LaPak, K. M. , Weissman, B. E. , Moorman, N. J. , and Major, M. B . (2020) Gain-of-function genetic screen of the kinome reveals BRSK2 as an inhibitor of the NRF2 transcription factor. J Cell Sci 133 · DOI
  54. 10.1006/abbi.1998.1046 · DOI
  55. 10.1158/0008-5472.CAN-12-2258 · DOI
  56. 10.1242/jcs.195685 · DOI
  57. 10.1007/s00018-010-0329-3 · DOI
  58. 2012, Structure-Based Design of Potent and Selective CK1γ Inhibitors, ACS medicinal chemistry letters, 3, 1059, 10.1021/ml300278f · DOI
  59. 10.1186/1476-4598-13-231 · DOI
  60. 10.1186/s12859-016-1413-y · DOI
  61. 2018, Quantitative, Wide-Spectrum Kinase Profiling in Live Cells for Assessing the Effect of Cellular ATP on Target Engagement, Cell chemical biology, 25, 206, 10.1016/j.chembiol.2017.10.010 · DOI
  62. 10.1038/srep40716 · DOI
  63. 10.1038/nrd.2018.21 · DOI · Paper page
  64. 10.1038/ng1375 · DOI
  65. 2019, Drosophila ZDHHC8 palmitoylates scribble and Ras64B and controls growth and viability, PLoS One, 14, e0198149, 10.1371/journal.pone.0198149 · DOI
  66. 2019, The Tumor Suppressor SCRIB is a Negative Modulator of the Wnt/beta-Catenin Signaling Pathway, Proteomics, 19, e1800487, 10.1002/pmic.201800487 · DOI
  67. 10.1016/j.ydbio.2009.06.024 · DOI · Paper page
  68. 10.1016/j.cell.2010.06.011 · DOI · Paper page
  69. 10.1101/cshperspect.a011189 · DOI
  70. Steinhart, Z. , and Angers, S . (2018) Wnt signaling in development and tissue homeostasis. Development 145 · DOI · Paper page
  71. 2017, Functional redundancy between Apc and Apc2 regulates tissue homeostasis and prevents tumorigenesis in murine mammary epithelium, Oncogene, 36, 1793, 10.1038/onc.2016.342 · DOI
  72. 10.1016/j.devcel.2007.04.001 · DOI
  73. 10.1021/cr400525m · DOI
  74. 10.1042/BST20160172 · DOI
  75. 10.1007/978-1-62703-764-8_14 · DOI
  76. 10.1038/nprot.2016.136 · DOI
  77. 10.1093/nar/gky1049 · DOI · Paper page
  78. 10.1089/omi.2011.0118 · DOI · Paper page
  79. 10.1038/nbt.1990 · DOI · Paper page
  80. 10.1021/acsmedchemlett.9b00399 · DOI

Metadata

Authors
Agajanian, M. J., Potjewyd, F. M., Bowman, B. M., Solomon, S., LaPak, K. M., Bhatt, D. P., Smith, J. L., Goldfarb, D., Axtman, A. D., & Major, M. B.
Affiliations
  • University of North Carolina at Chapel Hill (US)
  • Washington University in St. Louis (US)
Corresponding author
Major, Michael B.
Venue
Journal of Biological Chemistry
Publisher
openRxiv
Published
2021-11-30
Volume
298
Issue
6
Pages
101986-101986
ISSN
0021-9258 (ISSN-L)
OpenAlex
W4224939721
Cited by
12
References
1
Citations by year
2026: 6 · 2025: 1 · 2024: 1 · 2023: 4
FWCI
0.49
Type
journal article
Language
en
Open access
Licence
cc-by
Locations
  • Journal of Biological Chemistry (publishedVersion, cc-by)
  • bioRxiv (Cold Spring Harbor Laboratory) (acceptedVersion)
  • PubMed Central (publishedVersion, cc-by)
  • PubMed (publishedVersion)
  • Digital Commons@Becker (Washington University School of Medicine) (submittedVersion, cc-by)
Funders
  • Howard Hughes Medical Institute
  • Boehringer Ingelheim
  • Pfizer
  • North Carolina Biotechnology Center (2018-IDG-1030)
  • Meso Scale Diagnostics
  • Takeda Pharmaceuticals U.S.A.
  • Genome Canada (115766)
  • Merck KGaA
  • Wellcome Trust (106169/ZZ14/Z)
  • European Federation of Pharmaceutical Industries and Associations (115766)
  • Ontario Ministry of Economic Development and Innovation
  • Canada Foundation for Innovation
  • Fundação de Amparo à Pesquisa do Estado de São Paulo (106169/ZZ14/Z)
  • Ministero dello Sviluppo Economico
  • Innovative Medicines Initiative
  • National Institutes of Health (5f99ca245724-02, 1097737, F99/K00)
  • Genentech
  • Novartis Pharma
  • National Institute on Aging (U54AG065187)
  • National Cancer Institute (F99 CA245724, K00CA245724, F99/K00, T32CA009547)
  • National Institute of Diabetes and Digestive and Kidney Diseases (U24DK116204)
  • Janssen Pharmaceuticals
  • Eshelman Institute for Innovation, University of North Carolina at Chapel Hill
Topics
  • Life Sciences › Biochemistry, Genetics and Molecular Biology › Molecular Biology › Wnt/β-catenin signaling in development and cancer
  • Life Sciences › Biochemistry, Genetics and Molecular Biology › Molecular Biology › Signaling Pathways in Disease
  • Life Sciences › Biochemistry, Genetics and Molecular Biology › Molecular Biology › Protein Kinase Regulation and GTPase Signaling
Keywords
Wnt/β-catenin signaling, protein-protein interaction network, LRP6 phosphorylation, β-catenin stabilization, kinase inhibitors, functional redundancy, kinase families, cancer signaling
MeSH terms
Humans, Phosphorylation, Casein Kinase I, Wnt Proteins, beta Catenin, Wnt Signaling Pathway, Low Density Lipoprotein Receptor-Related Protein-6

About these checks

Registry, retraction, Cites and statistics results are computed, not judged, with one exception: a printed reference that no index lists is read once by a model before it counts as a citation error. Claims are extracted by a model and kept only when their quote appears verbatim in the text; each cited source is then checked, with a model’s help, for whether it says what the claim relies on. Those verdicts can be wrong — read the claim’s quote and the cited source before relying on one.

Statistics and arithmetic are recomputed, not judged.

Confidence bands are shown only for fields calibrated on our annotated test set. None is calibrated yet, so no band is shown.

What counts as a claim ›How we measure confidence ›How we check this ›

Are you an author, or do you see a problem with this page? Request a review

How to cite

Cite CoChat for the checks on this page, and the paper for its own findings.

This page
CoChat. (2026). Citation check: Protein proximity networks and functional evaluation of the Casein Kinase 1 γ family reveals unique roles for CK1 γ 3 in WNT signaling. https://app.cochat.ai/papers/10.1101/2021.11.30.470617
The paper
Agajanian, M. J., Potjewyd, F. M., Bowman, B. M., Solomon, S., LaPak, K. M., Bhatt, D. P., Smith, J. L., Goldfarb, D., Axtman, A. D., & Major, M. B. (2021). Protein proximity networks and functional evaluation of the Casein Kinase 1 γ family reveals unique roles for CK1 γ 3 in WNT signaling. Journal of Biological Chemistry. https://doi.org/10.1101/2021.11.30.470617