PreprintCited by 3Cellular Mechanics and InteractionsProtein Kinase Regulation and GTPase SignalingProtein Structure and Dynamics

The DOI matches its Crossref record; 1 of the 1 references it cites were found in a registry or an index.

Human plastins are novel cytoskeletal pH sensors with a reduced F-actin bundling capacity at basic pH

Open access

Preprint — published as 10.1016/j.jmb.2025.169306 · Paper page

Abstract

Intracellular pH (pH i ) is a fundamental component of cell homeostasis. Controlled elevations in pH i precede and accompany cell polarization, cytokinesis, and directional migration. pH dysregulation contributes to cancer, neurodegenerative diseases, diabetes, and other metabolic disorders. While cytoskeletal rearrangements are crucial for these processes, only a few cytoskeletal proteins, namely Cdc42, cofilin, talin, cortactin, α-actinin, and AIP1 have been documented as pH sensors. Here, we report that actin-bundling proteins plastin 2 (PLS2, aka LCP1) and plastin 3 (PLS3) respond to physiological scale pH fluctuations by a reduced F-actin bundling at alkaline pH. The inhibition of PLS2 actin-bundling activity at elevated pH stems from the reduced affinity of the N-terminal actin-binding domain (ABD1) to actin. In fibroblast cells, elevated cytosolic pH caused the dissociation of ectopically expressed PLS2 from actin structures, whereas acidic conditions promoted its tighter association with focal adhesions and stress fibers. We identified His207 as one of the pH-sensing residues whose mutation to Lys and Tyr reduces pH sensitivity by enhancing and inhibiting the bundling ability, respectively. Our results suggest that weaker actin bundling by plastin isoforms at alkaline pH favors higher dynamics of the actin cytoskeleton. Therefore, like other cytoskeleton pH sensors, plastins promote disassembly and faster dynamics of cytoskeletal components during cytokinesis and cell migration. Since both plastins are implemented in cancer, their pH sensitivity may contribute to the accelerated proliferation and enhanced invasive and metastatic potentials of cancer cells at alkaline pH i . Abstract Figure:

Overview

The claims and statistics of this paper haven’t been checked yet.

Run the check — free, no account needed. It reads the open-access text and checks the sources it cites.

A few free checks a day · papers already verified open instantly · results are public

Integrity signals

Registry

Crossref · 10.1101/2025.03.26.645573

Cites

1 of 1 references verified0 citation errors · 0 not checkable

Statistics

Figures

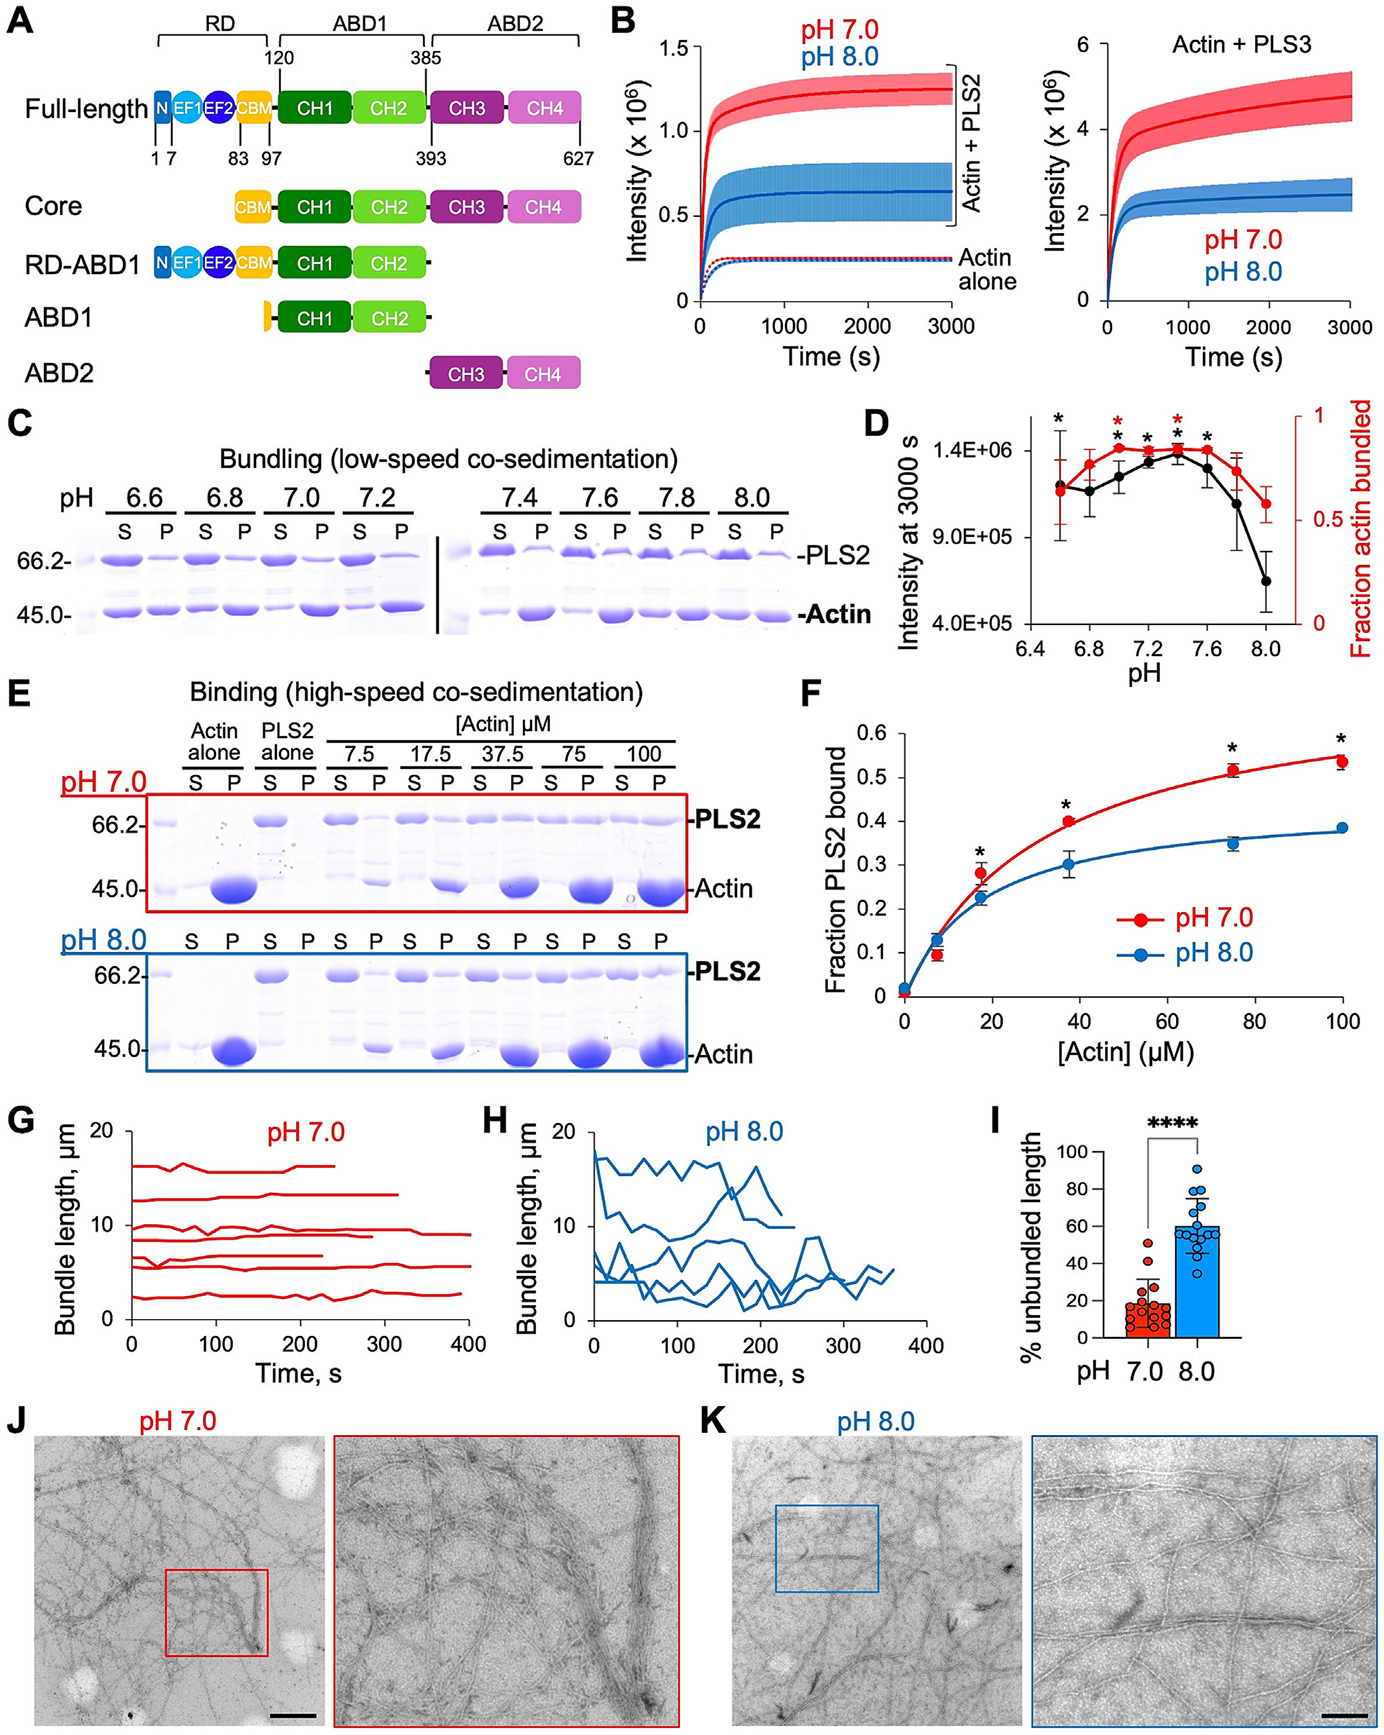
Figure 1. PLS2 and 3 bundling ability is negatively regulated by alkaline pH. (A) Schematic of plastin domains and PLS2 constructs used in this study. N,N-terminal 7-a.a. sequence; EF1 and 2, EF-hand motifs; CBM, calmodulin-binding motif; CH1-4, calponin-homology domains; RD, regulatory domain; ABD1 and 2, actin-binding domains. Numbers represent PLS2’s amino acid sequence. (B) Light scattering traces of F-actin bundling by PLS2 (left panel; full range of traces at pH from 6.6 to 8.0 is shown in Figure S1A) and that of by PLS3 (right panel) at pH 7 (red) and pH 8 (blue). Dotted lines (left panel) represent light scattering traces upon actin polymerization at pH 7.0 (red) and pH 8.0 (blue); see also Figure S1E. Solid lines represent averaged extrapolated data; colored areas represent SD of the mean (n ≥ 3). (C) Representative 10% SDS-PAGE gels of supernatant (S) and pellet (P) fractions from low-speed co-sedimentation of actin bundles formed by PLS2 under different buffer pH conditions. (D) Light scattering intensity (black) of the reactions at 3000 s (shown in B and in Figure S1A) and the fraction of actin pelleted (red) in low-speed centrifugation assays (shown in C) were plotted as functions of pH. Error bars represent the SD of the mean (n ≥ 3); asterisks are color-coded and indicate significant differences from the corresponding value at pH 8.0. P values for light-scattering and centrifugation assays are reported in Tables S1 and S2, respectively. (E) Representative 10% SDS-PAGE gels of supernatant (S) and pellet (P) fractions from high-speed co-sedimentation of PLS2 with increasing concentrations of F-actin at pH 7.0 and 8.0. (F) Quantitation of the high-speed co-sedimentation data (E). Error bars represent SD of the mean (n = 3). Asterisks indicate significant difference in fraction of PLS2 bound to actin at 17.5 (P = 0.014), 37.5 (P = 0.04), 75 (P = 0.014), and 100 μM actin (P = 0.005). (G–I) TIRF microscopy of actin bundling by PLS3. Bundles with lengths visually not increasing over the analyzed period were selected (see Methods); 15 bundles pooled from 3 biological replicates were analyzed. The lengths of individual bundles (or their segments, where all filaments stayed together as a bundle at each time point) were measured and plotted over time for pH 7.0 (G) and pH 8.0 (H). Representative plots for only some of the analyzed bundles are shown in G and H for clarity; note overall greater variability of the individual bundle lengths, which appear as zigzag instead of straight lines, and frequent unzipping (unbundling) events evidenced by the drops of bundle lengths at pH 8.0, as compared to pH 7.0. (I) The difference between maximum and minimum bundle length (percent unbundled) during 2-min evaluation period was expressed as percent of the maximum bundle length for each analyzed bundle; data are presented as mean ± SD, dots represent individual bundles, n = 15; ****, P < 0.0001 determined by two-tailed t-test. (J, K) TEM images of bundles formed by PLS2 at pH 7.0 (J) and 8.0 (K). Boxed areas are enlarged for clarity. Scale bars are 500 nm.
Figure 1. PLS2 and 3 bundling ability is negatively regulated by alkaline pH. (A) Schematic of plastin domains and PLS2 constructs used in this study. N,N-terminal 7-a.a. sequence; EF1 and 2, EF-hand motifs; CBM, calmodulin-binding motif; CH1-4, calponin-homology domains; RD, regulatory domain; ABD1 and 2, actin-binding domains. Numbers represent PLS2’s amino acid sequence. (B) Light scattering traces of F-actin bundling by PLS2 (left panel; full range of traces at pH from 6.6 to 8.0 is shown in Figure S1A) and that of by PLS3 (right panel) at pH 7 (red) and pH 8 (blue). Dotted lines (left panel) represent light scattering traces upon actin polymerization at pH 7.0 (red) and pH 8.0 (blue); see also Figure S1E. Solid lines represent averaged extrapolated data; colored areas represent SD of the mean (n ≥ 3). (C) Representative 10% SDS-PAGE gels of supernatant (S) and pellet (P) fractions from low-speed co-sedimentation of actin bundles formed by PLS2 under different buffer pH conditions. (D) Light scattering intensity (black) of the reactions at 3000 s (shown in B and in Figure S1A) and the fraction of actin pelleted (red) in low-speed centrifugation assays (shown in C) were plotted as functions of pH. Error bars represent the SD of the mean (n ≥ 3); asterisks are color-coded and indicate significant differences from the corresponding value at pH 8.0. P values for light-scattering and centrifugation assays are reported in Tables S1 and S2, respectively. (E) Representative 10% SDS-PAGE gels of supernatant (S) and pellet (P) fractions from high-speed co-sedimentation of PLS2 with increasing concentrations of F-actin at pH 7.0 and 8.0. (F) Quantitation of the high-speed co-sedimentation data (E). Error bars represent SD of the mean (n = 3). Asterisks indicate significant difference in fraction of PLS2 bound to actin at 17.5 (P = 0.014), 37.5 (P = 0.04), 75 (P = 0.014), and 100 μM actin (P = 0.005). (G–I) TIRF microscopy of actin bundling by PLS3. Bundles with lengths visually not increasing over the analyzed period were selected (see Methods); 15 bundles pooled from 3 biological replicates were analyzed. The lengths of individual bundles (or their segments, where all filaments stayed together as a bundle at each time point) were measured and plotted over time for pH 7.0 (G) and pH 8.0 (H). Representative plots for only some of the analyzed bundles are shown in G and H for clarity; note overall greater variability of the individual bundle lengths, which appear as zigzag instead of straight lines, and frequent unzipping (unbundling) events evidenced by the drops of bundle lengths at pH 8.0, as compared to pH 7.0. (I) The difference between maximum and minimum bundle length (percent unbundled) during 2-min evaluation period was expressed as percent of the maximum bundle length for each analyzed bundle; data are presented as mean ± SD, dots represent individual bundles, n = 15; ****, P < 0.0001 determined by two-tailed t-test. (J, K) TEM images of bundles formed by PLS2 at pH 7.0 (J) and 8.0 (K). Boxed areas are enlarged for clarity. Scale bars are 500 nm.CC BY · PubMed Central
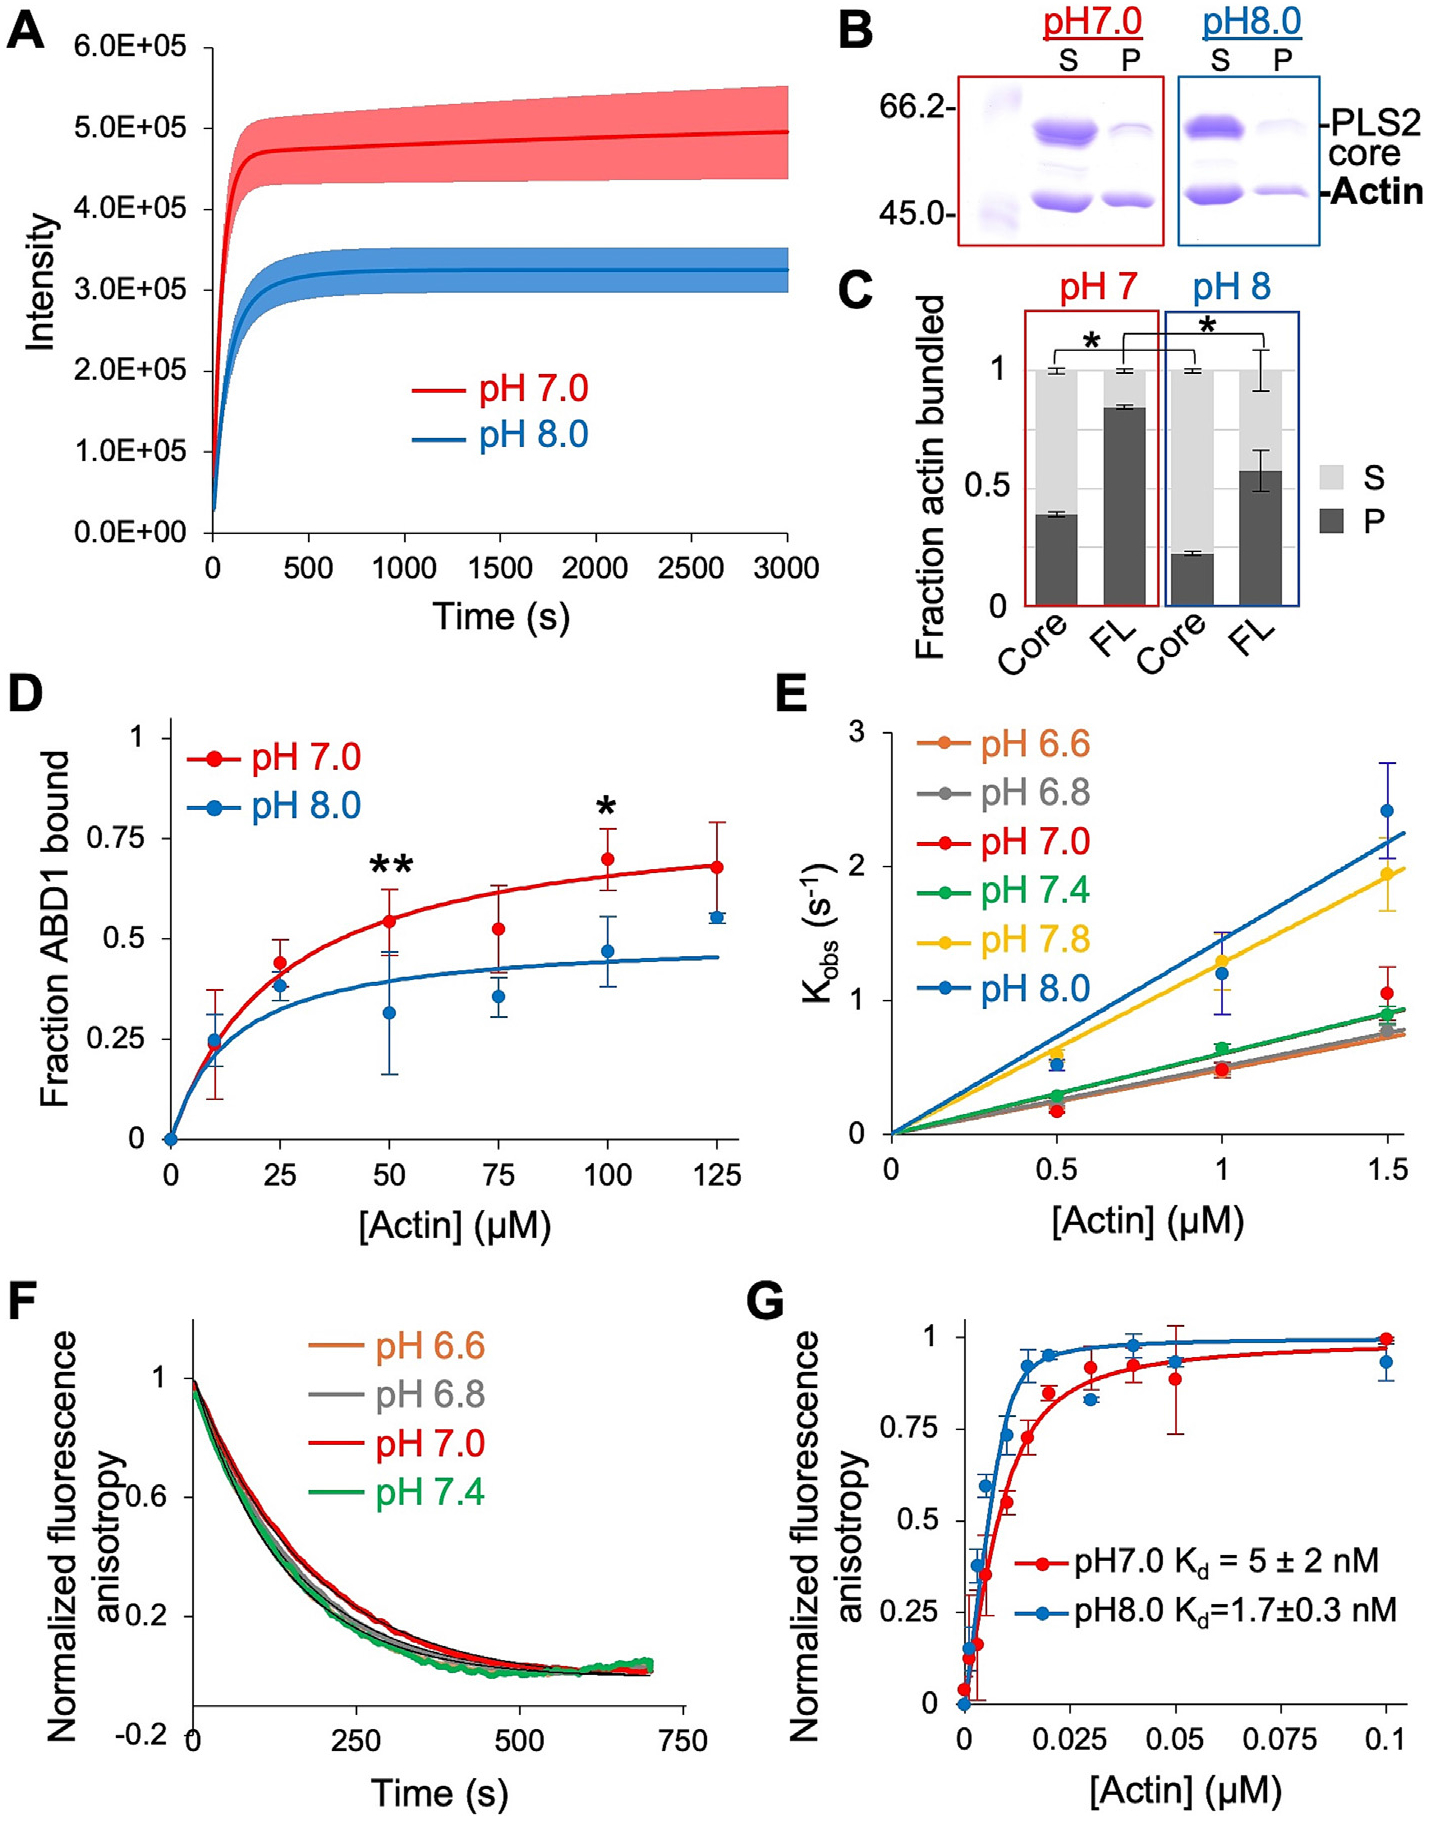
Figure 2. pH-dependence of PLS2 stems from weakened ABD1 binding to actin at basic pH. (A) Light scattering traces of F-actin bundling by PLS2-core at pH 7.0 (red) and 8.0 (blue). Solid lines represent averaged extrapolated data; colored areas represent SD of the mean (n = 3). (B) Representative 10% SDS-PAGE gels of supernatant (S) and pellet (P) fractions from low-speed centrifugation of actin bundles formed by PLS2-core at pH 7.0 and 8.0. (C) Quantitation of the low-speed centrifugation data; error bars represent SD of the mean (n =3; *, P = 0.01). (D) Fraction of ABD1 depleted from the supernatant during high-speed co-sedimentation with increasing F-actin concentrations at pH 7.0 (red) and pH 8.0 (blue). Error bars represent SD of the mean (n = 3, except for 50 and 100 μM Actin points, where n = 6; **, P = 0.002; *, P = 0.02). (E) Slopes from linear fits of kobs values (symbols) determined from kinetic association experiments of FM-ABD2 with F-actin were used to obtain kon values for each pH value (Table 1); error bars represent SD of the mean (n ≥ 8). (F) Dissociation kinetics (color curves) of FM-ABD2 from F-actin upon competition with excess unlabeled ABD2 were averaged (n ≥ 4) and fit to single exponential (black curves) to obtain koff values (Table 1). (G) Equilibrium binding data (symbols) of FM-ABD2 binding to phalloidin-stabilized F-actin at pH 7 (red) and pH 8 (blue) fit to a quadratic isotherm (lines). Error bars represent the SD of the mean (n = 3). Kd values are the mean ± SD of three technical replicates.
Figure 2. pH-dependence of PLS2 stems from weakened ABD1 binding to actin at basic pH. (A) Light scattering traces of F-actin bundling by PLS2-core at pH 7.0 (red) and 8.0 (blue). Solid lines represent averaged extrapolated data; colored areas represent SD of the mean (n = 3). (B) Representative 10% SDS-PAGE gels of supernatant (S) and pellet (P) fractions from low-speed centrifugation of actin bundles formed by PLS2-core at pH 7.0 and 8.0. (C) Quantitation of the low-speed centrifugation data; error bars represent SD of the mean (n =3; *, P = 0.01). (D) Fraction of ABD1 depleted from the supernatant during high-speed co-sedimentation with increasing F-actin concentrations at pH 7.0 (red) and pH 8.0 (blue). Error bars represent SD of the mean (n = 3, except for 50 and 100 μM Actin points, where n = 6; **, P = 0.002; *, P = 0.02). (E) Slopes from linear fits of kobs values (symbols) determined from kinetic association experiments of FM-ABD2 with F-actin were used to obtain kon values for each pH value (Table 1); error bars represent SD of the mean (n ≥ 8). (F) Dissociation kinetics (color curves) of FM-ABD2 from F-actin upon competition with excess unlabeled ABD2 were averaged (n ≥ 4) and fit to single exponential (black curves) to obtain koff values (Table 1). (G) Equilibrium binding data (symbols) of FM-ABD2 binding to phalloidin-stabilized F-actin at pH 7 (red) and pH 8 (blue) fit to a quadratic isotherm (lines). Error bars represent the SD of the mean (n = 3). Kd values are the mean ± SD of three technical replicates.CC BY · PubMed Central
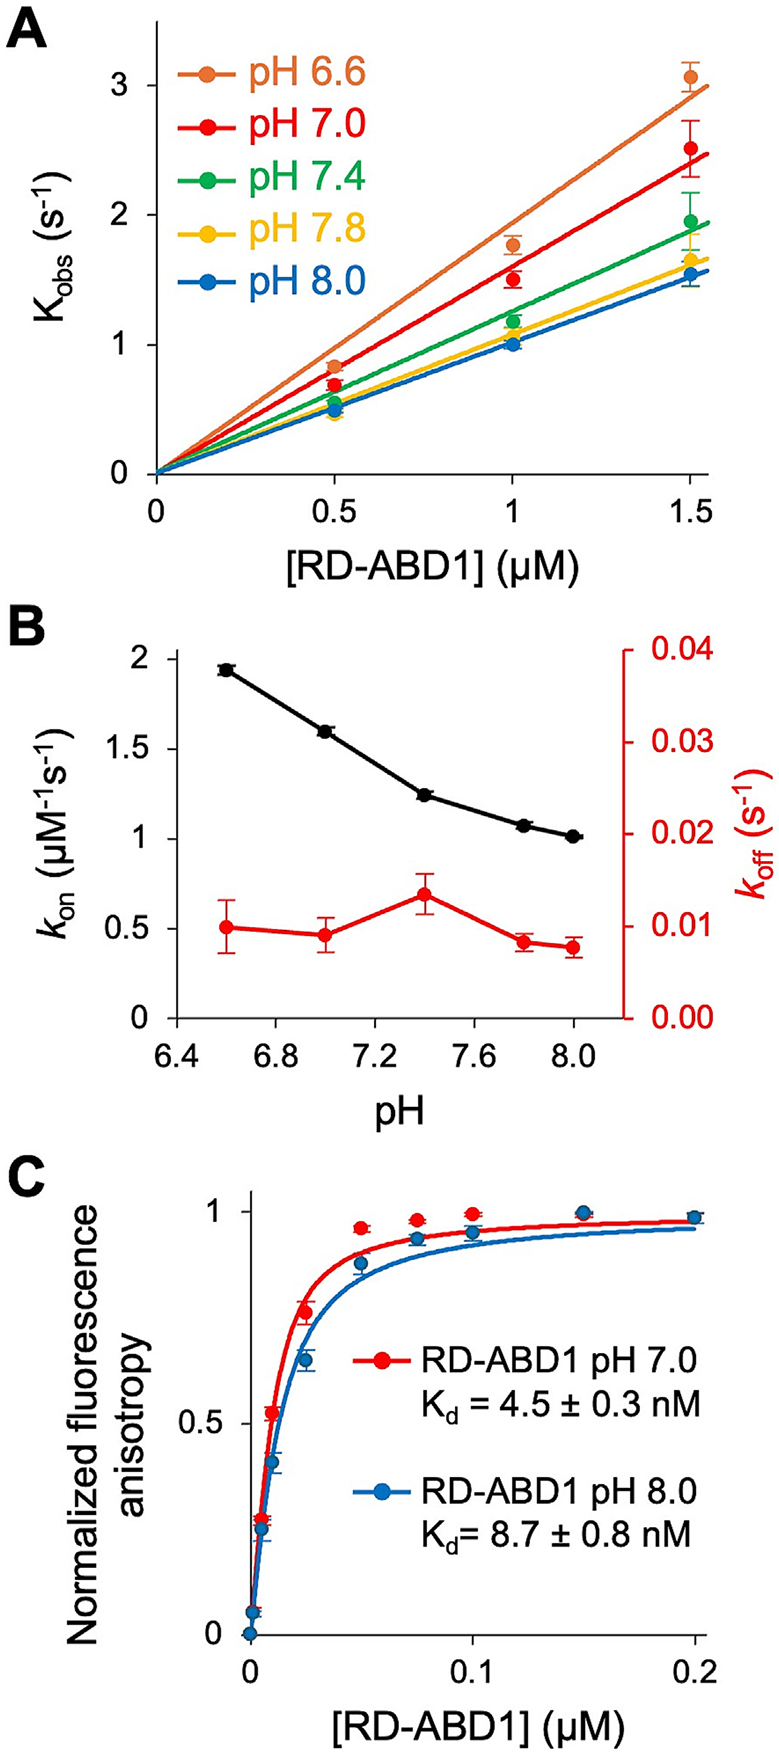
Figure 3. Inhibitory ABD1-ABD2 association is not responsible for the weaker bundling ability of PLS2 at basic pH. (A) Slopes from linear fits of Kobs values (symbols) determined from kinetic association experiments of FM-ABD2 with RD-ABD1 were used to obtain kon values for various pH conditions (Table S3); error bars represent SD of the mean (n ≥ 8). (B) kon (black) and koff (red) plotted as a function of pH. kon values derived from the slope of the linear function fit to experimentally measured kobs data shown in (A), error bars represent curve fit error. koff values derived from dissociation experiments of FM-ABD2 from RD-ABD1 with excess unlabeled ABD2, fit to a single exponential. Error bars represent SD of the mean (n ≥ 4). (C) Equilibrium binding data (symbols) of FM-ABD2 binding to RD-ABD1 at pH 7.0 (red) and 8.0 (blue) fit to a quadratic isotherm (lines). Error bars represent the SD of the mean (n = 3). Kd values are reported as the mean ± SD from three technical replicates.
Figure 3. Inhibitory ABD1-ABD2 association is not responsible for the weaker bundling ability of PLS2 at basic pH. (A) Slopes from linear fits of Kobs values (symbols) determined from kinetic association experiments of FM-ABD2 with RD-ABD1 were used to obtain kon values for various pH conditions (Table S3); error bars represent SD of the mean (n ≥ 8). (B) kon (black) and koff (red) plotted as a function of pH. kon values derived from the slope of the linear function fit to experimentally measured kobs data shown in (A), error bars represent curve fit error. koff values derived from dissociation experiments of FM-ABD2 from RD-ABD1 with excess unlabeled ABD2, fit to a single exponential. Error bars represent SD of the mean (n ≥ 4). (C) Equilibrium binding data (symbols) of FM-ABD2 binding to RD-ABD1 at pH 7.0 (red) and 8.0 (blue) fit to a quadratic isotherm (lines). Error bars represent the SD of the mean (n = 3). Kd values are reported as the mean ± SD from three technical replicates.CC BY · PubMed Central
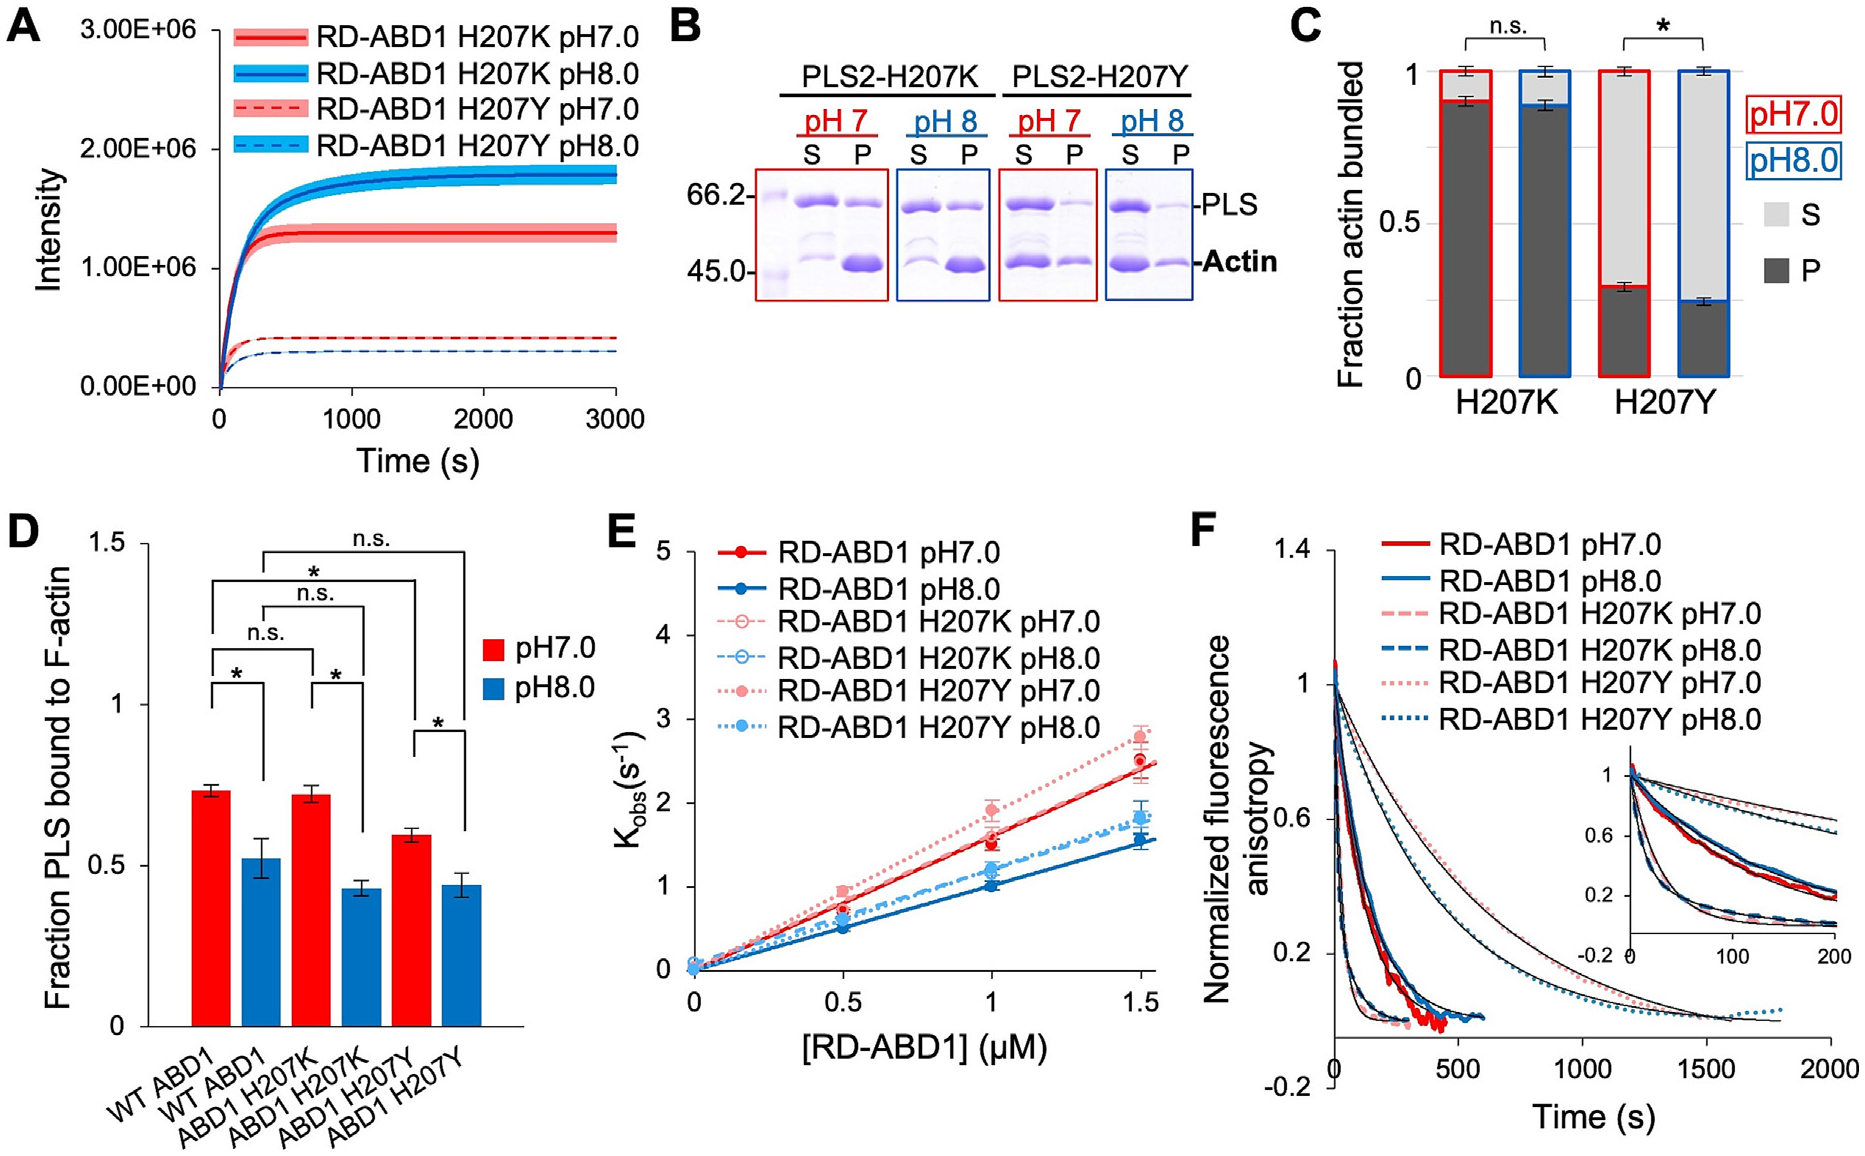
Figure 4. PLS2 H207Y, but not H207K, partially reproduces the mechanisms governing PLS2’s pH-sensitivity. (A) Light scattering traces for F-actin bundling by PLS2 mutants at pH 7.0 (red) and pH 8.0 (blue). Lines are averaged extrapolated data, colored areas are SD of the mean (n = 3). (B) Representative 10% SDS-PAGE gels of supernatant (S) and pellet (P) fractions from low-speed co-sedimentation of actin bundles formed by PLS2 mutants at pH 7.0 and 8.0. (C) Quantitation of the low-speed co-sedimentation data. Error bars represent SD of the mean (n = 3; *, P = 0.003). (D) Fraction of ABD1 constructs pelleted during high-speed co-sedimentation with 100 μM F-actin at pH 7.0 (red) and pH 8.0 (blue). Error bars are SD of the mean (n = 3). Significance determined by ANOVA analysis is shown in Table S4. (E) Slopes from linear fits of kobs values (symbols) determined from kinetic association experiments of FM-ABD2 with the indicated RD-ABD1 constructs were used to obtain kon values for pH 7.0 and 8.0 (Table S5); error bars represent SD of the mean (n ≥ 8). (F) Dissociation kinetics traces (color curves) of FM-ABD2 from the indicated RD-ABD1 were averaged (n ≥ 8) and fit to a single or double exponential (black curves) to yield koff values for each pH condition (Table S5). Inset shows first 200 s of the time-courses for each experiment.
Figure 4. PLS2 H207Y, but not H207K, partially reproduces the mechanisms governing PLS2’s pH-sensitivity. (A) Light scattering traces for F-actin bundling by PLS2 mutants at pH 7.0 (red) and pH 8.0 (blue). Lines are averaged extrapolated data, colored areas are SD of the mean (n = 3). (B) Representative 10% SDS-PAGE gels of supernatant (S) and pellet (P) fractions from low-speed co-sedimentation of actin bundles formed by PLS2 mutants at pH 7.0 and 8.0. (C) Quantitation of the low-speed co-sedimentation data. Error bars represent SD of the mean (n = 3; *, P = 0.003). (D) Fraction of ABD1 constructs pelleted during high-speed co-sedimentation with 100 μM F-actin at pH 7.0 (red) and pH 8.0 (blue). Error bars are SD of the mean (n = 3). Significance determined by ANOVA analysis is shown in Table S4. (E) Slopes from linear fits of kobs values (symbols) determined from kinetic association experiments of FM-ABD2 with the indicated RD-ABD1 constructs were used to obtain kon values for pH 7.0 and 8.0 (Table S5); error bars represent SD of the mean (n ≥ 8). (F) Dissociation kinetics traces (color curves) of FM-ABD2 from the indicated RD-ABD1 were averaged (n ≥ 8) and fit to a single or double exponential (black curves) to yield koff values for each pH condition (Table S5). Inset shows first 200 s of the time-courses for each experiment.CC BY · PubMed Central
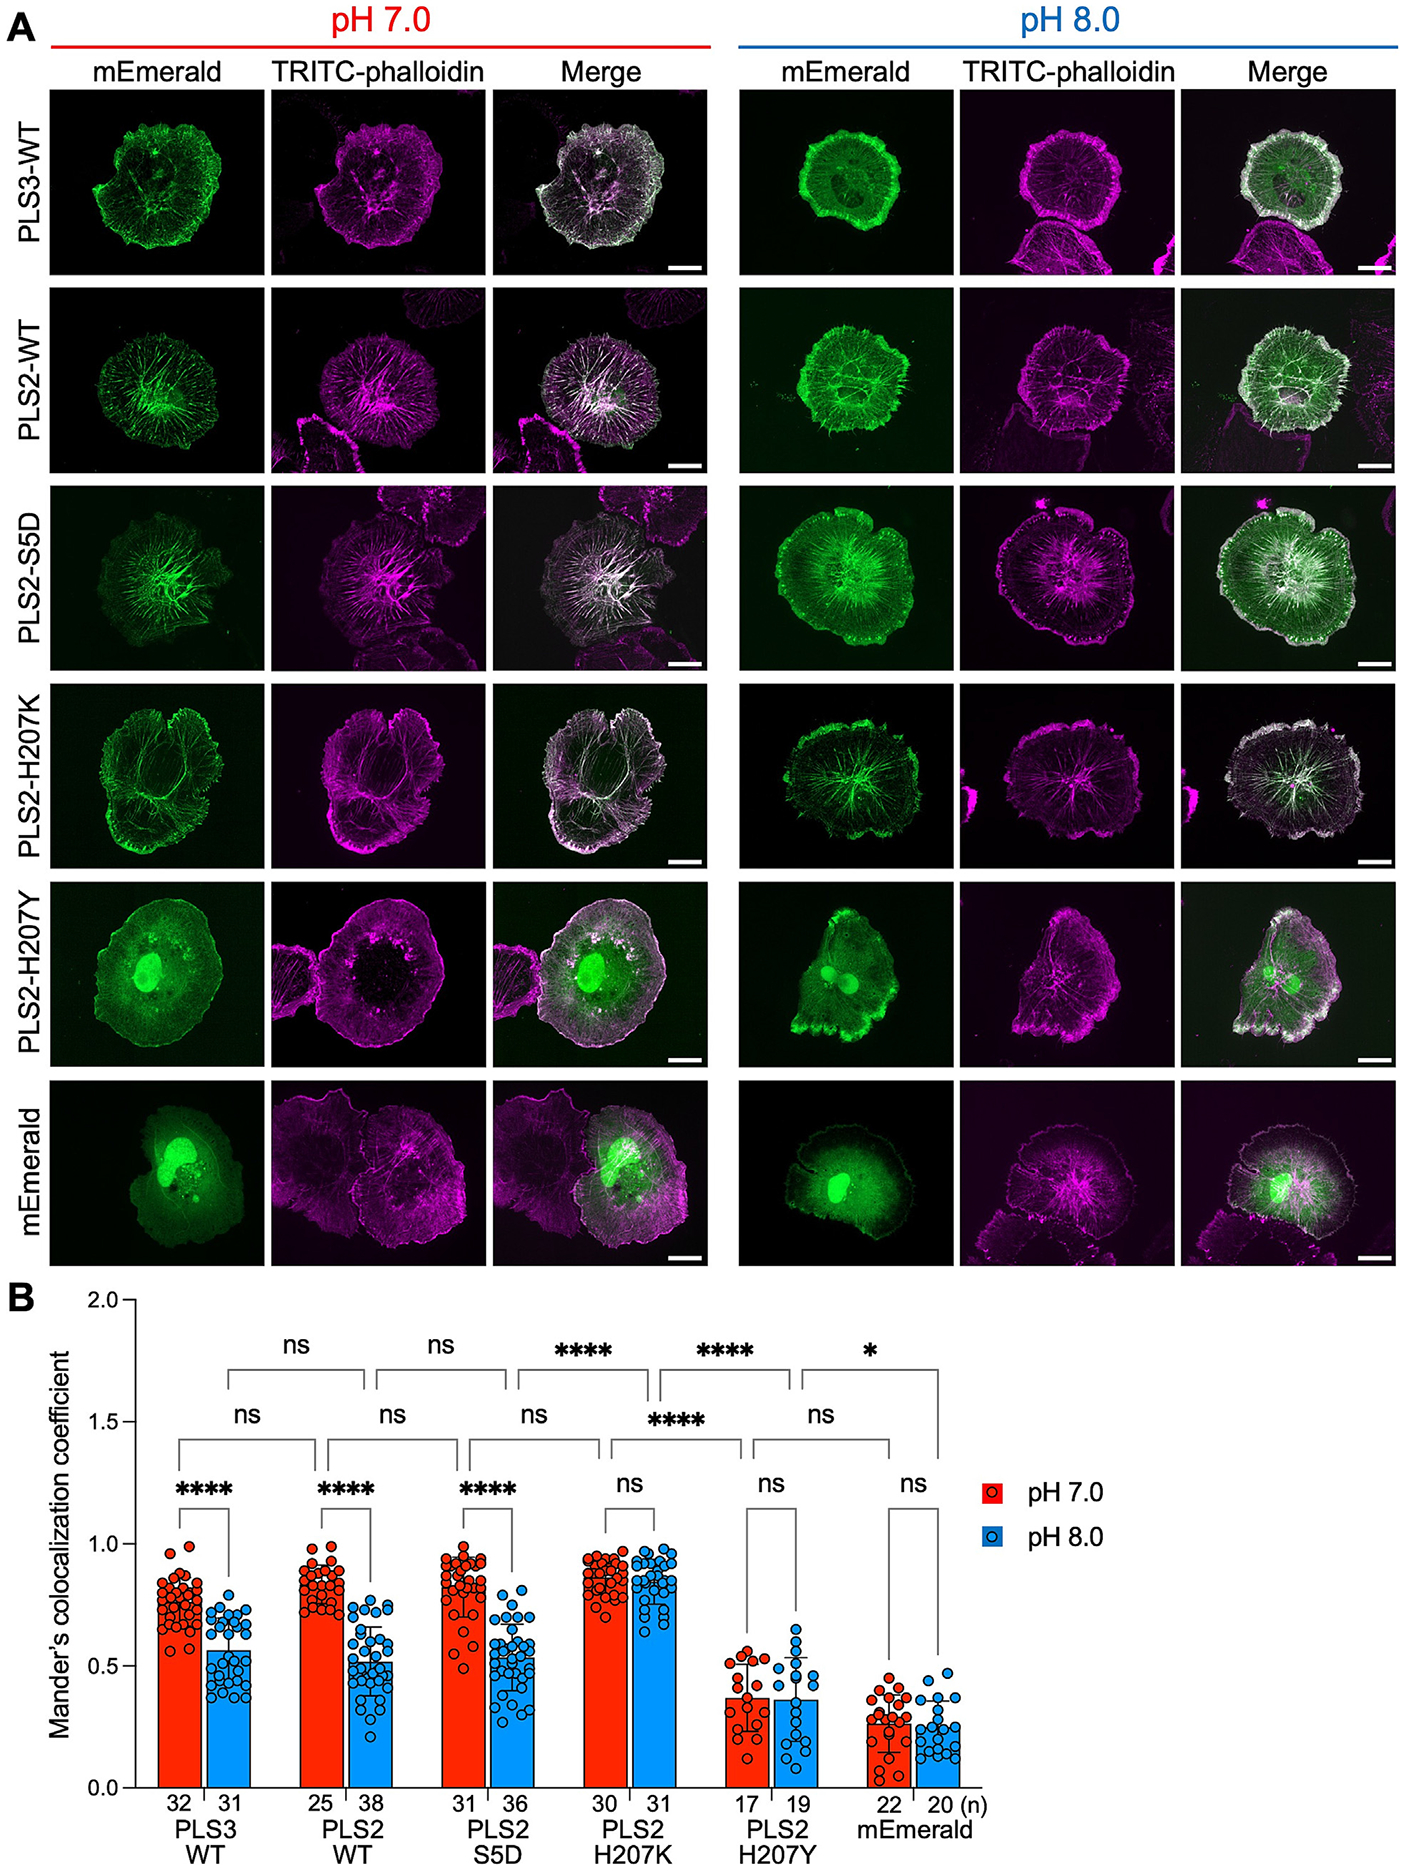
Figure 5. PLS2 and PLS3 show pH-dependent cellular localization. (A) Multiple intensity projections of representative confocal images of XTC cells transfected with mEmerald-tagged PLS constructs (green). Before imaging, cells were clamped in nigericin buffers at pH 7.0 or 8.0, fixed, and counterstained with TRITC-phalloidin for F-actin (magenta). Scale bars are 20 μm. (B) Colocalization analysis of a fraction of the mEmerald-tagged PLS constructs colocalizing with F-actin (labeled by TRITC-phalloidin) using Mander’s colocalization coefficient (MCC). Data are presented as mean ± SD; dots represent individual data points; number of analyzed cells (n) is indicated on the graph. Significance was determined by two-way ANOVA analysis followed by Tukey’s multiple comparisons: ns, non-significant; *, P < 0.0333; ****, P < 0.0001.
Figure 5. PLS2 and PLS3 show pH-dependent cellular localization. (A) Multiple intensity projections of representative confocal images of XTC cells transfected with mEmerald-tagged PLS constructs (green). Before imaging, cells were clamped in nigericin buffers at pH 7.0 or 8.0, fixed, and counterstained with TRITC-phalloidin for F-actin (magenta). Scale bars are 20 μm. (B) Colocalization analysis of a fraction of the mEmerald-tagged PLS constructs colocalizing with F-actin (labeled by TRITC-phalloidin) using Mander’s colocalization coefficient (MCC). Data are presented as mean ± SD; dots represent individual data points; number of analyzed cells (n) is indicated on the graph. Significance was determined by two-way ANOVA analysis followed by Tukey’s multiple comparisons: ns, non-significant; *, P < 0.0333; ****, P < 0.0001.CC BY · PubMed Central
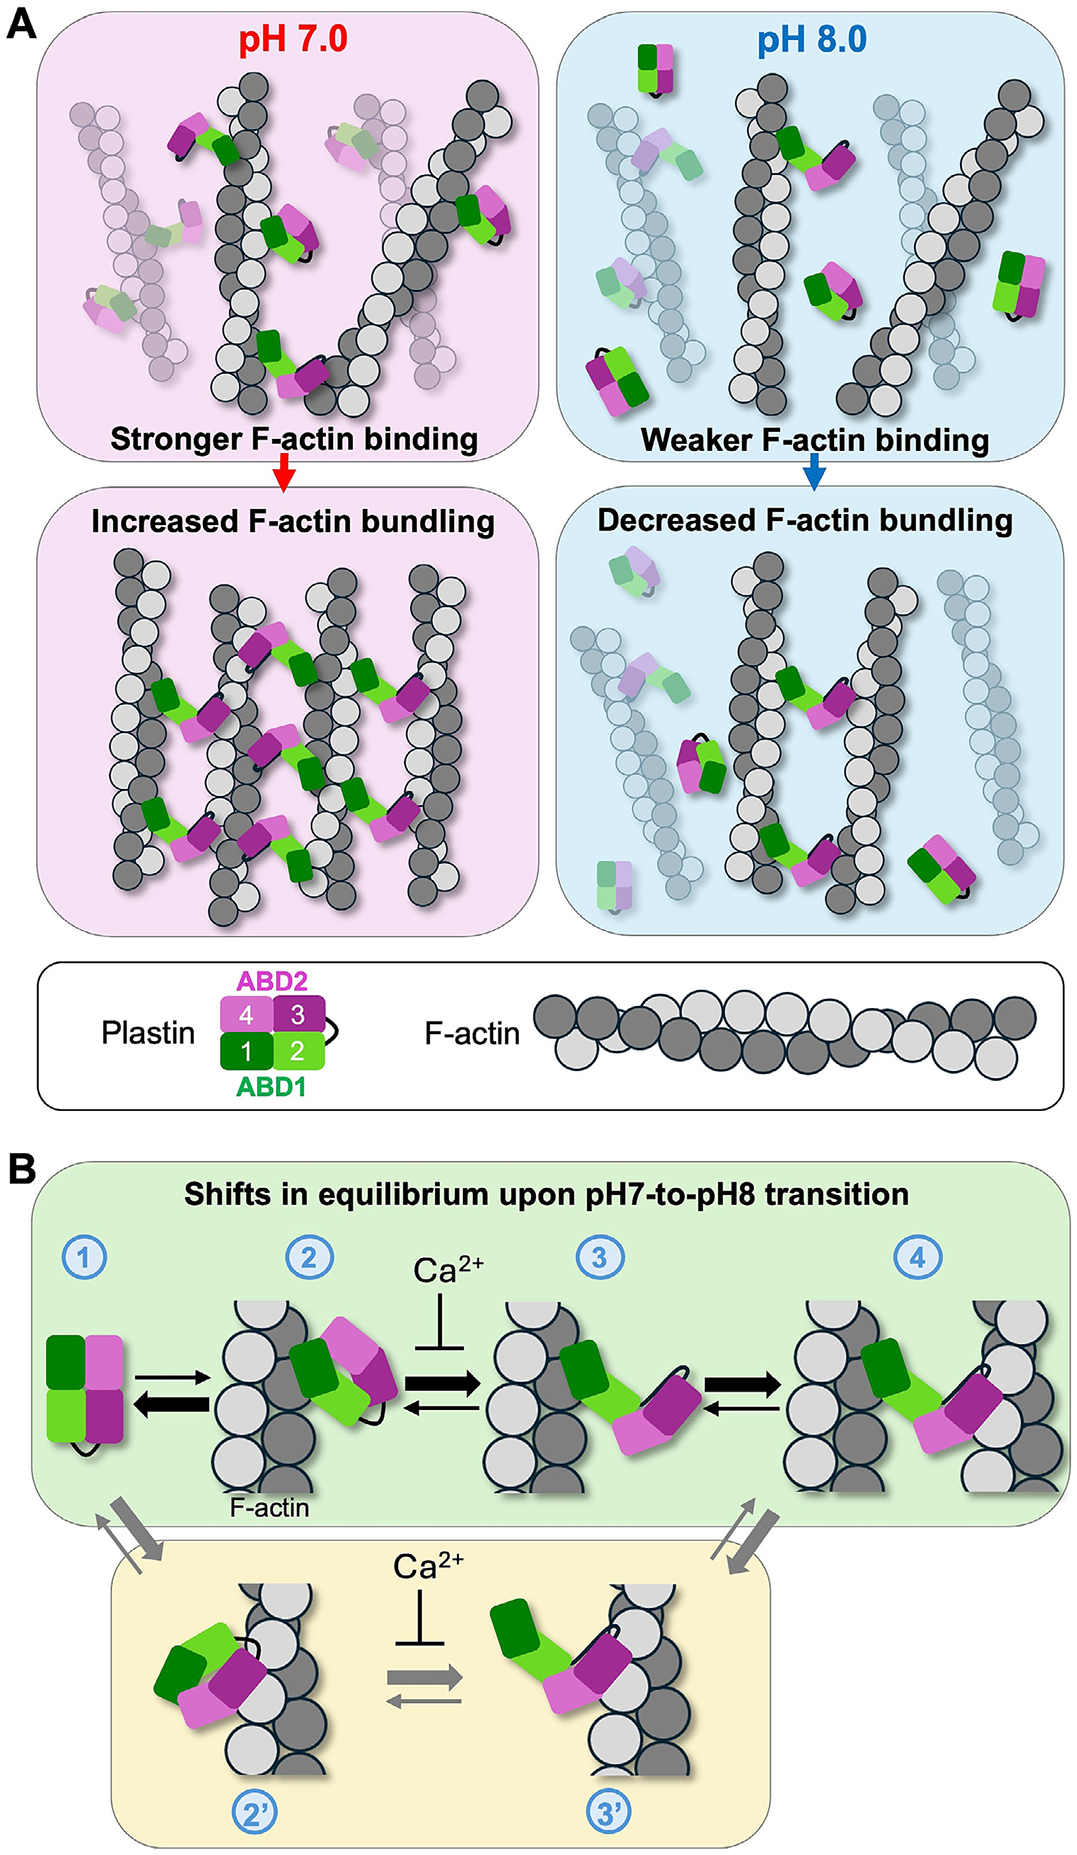
Figure 6. Hypothetical model of pH effects on F-actin bundling by plastins. (A) Plastin’s ability to bundle F-actin is regulated by pH: by respectively promoting and inhibiting the binding of ABD1 to actin (top panels), neutral pH enhances F-actin bundling by PLS, while basic pH reduces bundling (bottom panels). (B) Shifts (represented by thick arrows) in equilibrium states of plastin upon interaction with F-actin during the transition from pH 7.0 to pH 8.0. Transition from free (state 1) to actin-bound state via ABD1 (state2) is disfavored by basic pH. This binding favors the opening of the ABD core (favored by basic pH), enabling ABD2 to sample the space and bind another actin filament (state 3; favored by basic pH), resulting in bundling (state 4). In the alternative scenario (route 1–2′–3′–4), ABD2 binds first (state 2′; favored by basic pH), leading to a partial release of the ABD1-ABD2 inhibition (state 3′, favored by basic pH), followed by ABD1 binding to actin, forming bundles (state 4; disfavored by basic pH). Notice, however, that this latter scenario implies a stronger binding of PLS to actin at alkaline pH, which is not supported by our experimental data (Figure 1F).
Figure 6. Hypothetical model of pH effects on F-actin bundling by plastins. (A) Plastin’s ability to bundle F-actin is regulated by pH: by respectively promoting and inhibiting the binding of ABD1 to actin (top panels), neutral pH enhances F-actin bundling by PLS, while basic pH reduces bundling (bottom panels). (B) Shifts (represented by thick arrows) in equilibrium states of plastin upon interaction with F-actin during the transition from pH 7.0 to pH 8.0. Transition from free (state 1) to actin-bound state via ABD1 (state2) is disfavored by basic pH. This binding favors the opening of the ABD core (favored by basic pH), enabling ABD2 to sample the space and bind another actin filament (state 3; favored by basic pH), resulting in bundling (state 4). In the alternative scenario (route 1–2′–3′–4), ABD2 binds first (state 2′; favored by basic pH), leading to a partial release of the ABD1-ABD2 inhibition (state 3′, favored by basic pH), followed by ABD1 binding to actin, forming bundles (state 4; disfavored by basic pH). Notice, however, that this latter scenario implies a stronger binding of PLS to actin at alkaline pH, which is not supported by our experimental data (Figure 1F).CC BY · PubMed Central

Verification

Claims the paper makes

The claims and statistics of this paper haven’t been checked yet.

Run the check — free, no account needed. It reads the open-access text and checks the sources it cites.

A few free checks a day · papers already verified open instantly · results are public

Self-check

Percentages, sums and reported differences re-computed from the paper’s own numbers.

The self-check needs the paper’s full text.

Citations

Cites

Show all 1 references

Research works printed but not linked: 95

  1. 10.1038/nrm2820 · DOI · Paper page
  2. Spear, J. S. & White, K. A . Single-cell intracellular pH dynamics regulate the cell cycle by timing the G1 exit and G2 transition. J. Cell Sci. 136, 2021.06.04.447151 (2023). · DOI
  3. 2020, Cancer and pH dynamics: Transcriptional regulation, proteostasis, and the need for new molecular tools, Cancers (Basel, 12, 1
  4. 10.1002/jnr.23757 · DOI
  5. 10.1111/j.1748-1716.2006.01543.x · DOI
  6. 2012, The Na+ / H+ - Exchanger (NHE1) Generates pH Nanodomains at Focal Adhesions, J. Cell. Physiol, 228, 1351
  7. 10.1083/jcb.200208050 · DOI
  8. 10.1083/jcb.201302131 · DOI
  9. 10.1152/physrev.00018.2011 · DOI · Paper page
  10. 10.1038/nrc1713 · DOI · Paper page
  11. 10.1111/wrr.12526 · DOI
  12. 10.1152/ajpcell.00280.2010 · DOI
  13. 10.1083/jcb.200704169 · DOI
  14. 10.1074/jbc.M310148200 · DOI
  15. 10.1083/jcb.200804161 · DOI
  16. 10.1073/pnas.0805163105 · DOI
  17. 10.1083/jcb.201103045 · DOI
  18. 10.1074/jbc.M115.713495 · DOI
  19. 10.1042/BST0330891 · DOI
  20. Hawkins, M. , Pope, B. , Maciver, S. K. & Weeds, A. G . Human Actin Depolymerizing Factor Mediates Actin Filaments pH-Sensitive Destruction of Actin Filaments. Biochemistry 9985–9993 (1993). · DOI
  21. Chen, H. et al. In Vitro Activity Differences between Proteins of the ADF / Cofilin Family Define Two Distinct Subgroups. Biochemistry 7127–7142 (2004). · DOI
  22. 10.1021/acs.biochem.8b01001 · DOI
  23. 10.1242/jcs.01631 · DOI
  24. 10.1083/jcb.94.2.466 · DOI
  25. 10.1083/jcb.100.2.375 · DOI
  26. 10.1101/cshperspect.a022053 · DOI · Paper page
  27. 10.1016/j.jmb.2017.06.021 · DOI
  28. 10.1016/j.str.2004.04.010 · DOI
  29. 10.1038/s41594-022-00771-1 · DOI
  30. 10.1073/pnas.2110877119 · DOI
  31. 10.1152/physrev.00018.2013 · DOI
  32. Pollard, T. D. Actin and actin-binding proteins. Cold Spring Harb. Perspect. Biol. 8, (2016). · DOI
  33. 10.1016/S0021-9258(18)53842-4 · DOI
  34. 10.1155/2012/282041 · DOI · Paper page
  35. 10.1128/MCB.14.4.2457 · DOI
  36. 10.1111/cge.13626 · DOI
  37. 10.1155/2012/282041 · DOI · Paper page
  38. 10.1007/s00018-021-03843-5 · DOI
  39. 1994, Activation of the Leukocyte Plastin Gene Occurs in Most Human Cancer Cells, Cancer Res, 54, 1775
  40. 10.1002/ijc.21593 · DOI
  41. 10.1186/1476-4598-13-1 · DOI
  42. 10.1186/s12964-021-00728-9 · DOI
  43. 2019, Plastin 3 down-regulation augments the sensitivity of MDA-MB-231 cells to paclitaxel via the p38 MAPK signalling pathway. Artif. Cells, Nanomedicine, Biotechnol, 47, 684
  44. 10.3390/ijms19061551 · DOI
  45. 10.1002/jcp.29685 · DOI
  46. 10.1002/tox.23872 · DOI
  47. 10.1242/jcs.02874 · DOI
  48. 10.1038/s41413-020-0095-2 · DOI
  49. 10.1038/srep41926 · DOI
  50. 10.1016/j.cell.2010.12.001 · DOI · Paper page
  51. 10.1074/mcp.M111.016410 · DOI · Paper page
  52. 10.1038/nature18003 · DOI · Paper page
  53. 10.1074/mcp.M113.036392 · DOI · Paper page
  54. 10.1021/pr300630k · DOI · Paper page
  55. 10.4049/jimmunol.1103242 · DOI
  56. 10.1093/oxfordjournals.jbchem.a123929 · DOI
  57. 10.1021/bi00510a015 · DOI
  58. 10.1016/S0006-3495(89)82804-8 · DOI
  59. 10.1016/S0091-679X(08)60661-5 · DOI
  60. 10.1021/acs.biochem.6b01117 · DOI
  61. 10.1038/s41467-016-0009-6 · DOI · Paper page
  62. 10.7554/eLife.52760 · DOI · Paper page
  63. 10.1002/prot.10177 · DOI
  64. 10.1021/bi00578a012 · DOI
  65. 10.1016/B978-0-12-420138-5.00023-9 · DOI
  66. 10.1002/eji.201040345 · DOI
  67. 10.4049/jimmunol.1001424 · DOI
  68. Zhou, J. Y. et al. L-Plastin promotes podosome longevity and supports macrophage motility. Mol Immunol October, 79–88 (2016). · DOI
  69. 10.1002/cm.21717 · DOI
  70. Chellaiah, M. A. et al. L-Plastin deficiency produces increased trabecular bone due to attenuation of sealing ring formation and osteoclast dysfunction. Bone Res. 8, (2020). · DOI
  71. 10.4049/jimmunol.1101033 · DOI
  72. 10.1189/jlb.69.4.522 · DOI · Paper page
  73. 10.1371/journal.pone.0015746 · DOI
  74. 10.1152/ajpregu.00154.2014 · DOI
  75. 1989, Regulation of podosomes by intracellular pH in avian osteoclasts, Boll. Soc. Ital. Biol. Sper, 65, 597
  76. 10.1172/JCI114235 · DOI
  77. 2011, Dysregulated pH: a perfect storm for cancer progression, Nat. Publ. Gr, 11, 671
  78. 2009, The coordination between actin filaments and adhesion in mesenchymal migration, Cell Adhes. Migr, 3, 2
  79. 10.1371/journal.pone.0089680 · DOI · Paper page
  80. Garbett, D. et al. T-Plastin reinforces membrane protrusions to bridge matrix gaps during cell migration. Nat. Commun. 11, (2020). · DOI
  81. 10.5483/BMBRep.2024-0040 · DOI
  82. 10.1038/nsmb.1789 · DOI
  83. 10.1073/pnas.1106453108 · DOI
  84. 10.1016/j.bpj.2018.05.039 · DOI
  85. 10.1091/mbc.E19-06-0317 · DOI
  86. 10.3390/ijms23137026 · DOI
  87. 2006, Similarity of salt influences on the pH of buffers, polyelectrolytes, and proteins, J. Phys. Chem. B, 110, 8870, 10.1021/jp0600209 · DOI
  88. 10.1385/1-59259-890-0:571 · DOI
  89. 10.1038/nmeth.2019 · DOI · Paper page
  90. 10.1002/mrd.22489 · DOI
  91. Watanabe, N . Fluorescence single-molecule imaging of actin turnover and regulatory mechanisms. Methods in Enzymology vol. 505 (Elsevier Inc., 2012). · DOI
  92. Uphoff, C. C. & Drexler, H. G . Detection of Mycoplasma Contamination in Cell Cultures. Curr. Protoc. Mol. Biol. 106, (2014). · DOI · Paper page
  93. Rizzo, M. A. , Davidson, M. W. & Piston, D. W . Fluorescent protein tracking and detection: fluorescent protein structure and color variants. Cold Spring Harb. Protoc. 2009, pdb.top63 (2009). · DOI
  94. 10.1083/jcb.200908086 · DOI
  95. 10.1093/NAR/GKAB1061 · DOI · Paper page

Metadata

Authors
Runyan, L. A., Kudryashova, E., Agrawal, R., Mohamed, M., & Kudryashov, D. S.
Affiliations
The Ohio State University (US)
Corresponding author
Kudryashov, Dmitri S.
Venue
Journal of Molecular Biology
Publisher
openRxiv
Published
2025-03-28
Volume
437
Issue
19
Pages
169306-169306
ISSN
0022-2836 (ISSN-L)
OpenAlex
W4411632033
Cited by
3
References
1
Citations by year
2026: 3
FWCI
1.49
Type
journal article
Language
en
Open access
Locations
  • Journal of Molecular Biology (publishedVersion, cc-by)
  • bioRxiv (Cold Spring Harbor Laboratory) (acceptedVersion, cc-by-nd)
  • PubMed (publishedVersion)
  • PubMed Central (acceptedVersion, cc-by)
  • Europe PMC (PubMed Central) (submittedVersion, cc-by-nd)
  • PubMed Central (submittedVersion, cc-by-nd)
Funders
  • National Institutes of Health
  • National Cancer Institute (P30CA016058)
  • National Institute of General Medical Sciences (R01GM145813)
Topics
  • Life Sciences › Biochemistry, Genetics and Molecular Biology › Cell Biology › Cellular Mechanics and Interactions
  • Life Sciences › Biochemistry, Genetics and Molecular Biology › Molecular Biology › Protein Kinase Regulation and GTPase Signaling
  • Life Sciences › Biochemistry, Genetics and Molecular Biology › Molecular Biology › Protein Structure and Dynamics
Keywords
PLS3, intracellular pH, F-actin bundling, actin-binding domain, alkaline pH, actin cytoskeleton dynamics, focal adhesions, stress fibers, tumor invasion, metastasis, cell migration, cytokinesis

About these checks

Registry, retraction, Cites and statistics results are computed, not judged, with one exception: a printed reference that no index lists is read once by a model before it counts as a citation error. Claims are extracted by a model and kept only when their quote appears verbatim in the text; each cited source is then checked, with a model’s help, for whether it says what the claim relies on. Those verdicts can be wrong — read the claim’s quote and the cited source before relying on one.

Statistics and arithmetic are recomputed, not judged.

Confidence bands are shown only for fields calibrated on our annotated test set. None is calibrated yet, so no band is shown.

What counts as a claim ›How we measure confidence ›How we check this ›

Are you an author, or do you see a problem with this page? Request a review

How to cite

Cite CoChat for the checks on this page, and the paper for its own findings.

This page
CoChat. (2026). Citation check: Human plastins are novel cytoskeletal pH sensors with a reduced F-actin bundling capacity at basic pH. https://app.cochat.ai/papers/10.1101/2025.03.26.645573
The paper
Runyan, L. A., Kudryashova, E., Agrawal, R., Mohamed, M., & Kudryashov, D. S. (2025). Human plastins are novel cytoskeletal pH sensors with a reduced F-actin bundling capacity at basic pH. Journal of Molecular Biology. https://doi.org/10.1101/2025.03.26.645573