

The DOI matches its Crossref record; 1 of the 1 references it cites were found in a registry or an index.
Features and development of Coot
Abstract
Coot is a molecular-graphics application for model building and validation of biological macromolecules. The program displays electron-density maps and atomic models and allows model manipulations such as idealization, real-space refinement, manual rotation/translation, rigid-body fitting, ligand search, solvation, mutations, rotamers and Ramachandran idealization. Furthermore, tools are provided for model validation as well as interfaces to external programs for refinement, validation and graphics. The software is designed to be easy to learn for novice users, which is achieved by ensuring that tools for common tasks are `discoverable' through familiar user-interface elements (menus and toolbars) or by intuitive behaviour (mouse controls). Recent developments have focused on providing tools for expert users, with customisable key bindings, extensions and an extensive scripting interface. The software is under rapid development, but has already achieved very widespread use within the crystallographic community. The current state of the software is presented, with a description of the facilities available and of some of the underlying methods employed.
Overview
The claims and statistics of this paper haven’t been checked yet.
Run the check — free, no account needed. It reads the open-access text and checks the sources it cites.
Integrity signals
Registry
Cites
Statistics
Figures
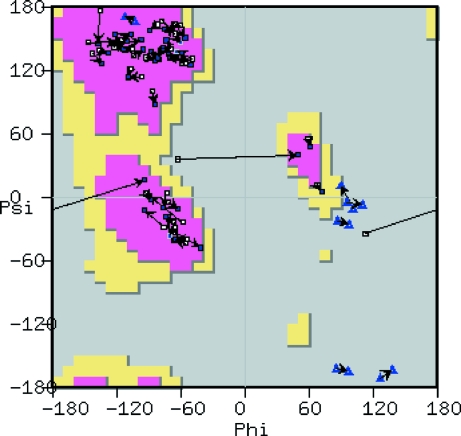
Verification
Claims the paper makes
The claims and statistics of this paper haven’t been checked yet.
Run the check — free, no account needed. It reads the open-access text and checks the sources it cites.
Claims other papers make about this one
Each is checked against this paper’s own text: does it say what the citing paper says it does?
The source backs part of the claim, not all of it — or backs it for a different population, condition or comparison.
In the citing paper
“Model geometries were assessed using the MolProbity module in Phenix, the Molprobity server68 (http://molprobity.biochem.duke.edu/), and the PDB Validation server69 (www.wwpdb.org).”
From Structural organization of the retriever–CCC endosomal recycling complex (2024) · cites this paper as [68]
Experimental — accuracy not yet measured
Self-check
Percentages, sums and reported differences re-computed from the paper’s own numbers.
The self-check needs the paper’s full text.
Citations
Cites
Coot : model-building tools for molecular graphics
Emsley, P., & Cowtan, K. (2004) · Acta Crystallographica Section D Biological Crystallography · doi:10.1107/s0907444904019158 · Cited by 30,571
Self-citation
Research works printed but not linked: 43
- Adams, 2002, Acta Cryst. D, 58, 1948, 10.1107/S0907444902016657 · DOI · Paper page
- Bernstein, 1977, J. Mol. Biol., 112, 535, 10.1016/S0022-2836(77)80200-3 · DOI
- Blanc, 2004, Acta Cryst. D, 60, 2210, 10.1107/S0907444904016427 · DOI
- Blundell, 2002, Nature Rev. Drug Discov., 1, 45, 10.1038/nrd706 · DOI
- Brünger, A. T. (1992). X-PLOR v.3.1. A System for X-ray Crystallography and NMR. New Haven: Yale University Press.
- Cowtan, 2000, Acta Cryst. D, 56, 1612, 10.1107/S0907444900013263 · DOI
- Cowtan, 2003, IUCr Comput. Commun. Newsl., 2, 4
- Cowtan, 2006, Acta Cryst. D, 62, 1002, 10.1107/S0907444906022116 · DOI
- Cowtan, 2010, Acta Cryst. D, 66, 470, 10.1107/S090744490903947X · DOI
- Dauter, 2006, Acta Cryst. D, 62, 1, 10.1107/S0907444905034050 · DOI
- Davis, 2007, Nucleic Acids Res., 35, W375, 10.1093/nar/gkm216 · DOI
- Esnouf, 1997, Acta Cryst. D, 53, 665, 10.1107/S0907444997005829 · DOI
- Greer, 1974, J. Mol. Biol., 82, 279, 10.1016/0022-2836(74)90591-9 · DOI
- Hooft, 1996, Nature (London), 381, 272, 10.1038/381272a0 · DOI
- Jones, 1986, EMBO J., 5, 819, 10.1002/j.1460-2075.1986.tb04287.x · DOI
- Jones, 1991, Acta Cryst. A, 47, 110, 10.1107/S0108767390010224 · DOI
- Kelsey, 1998, Higher-Order and Symbolic Computation, 11, 7, 10.1023/A:1010051815785 · DOI
- Kleywegt, 1996, Acta Cryst. D, 52, 842, 10.1107/S0907444995016477 · DOI
- Kleywegt, 2004, Acta Cryst. D, 60, 2240, 10.1107/S0907444904013253 · DOI
- Kleywegt, G. J. & Jones, T. A. (1994). Proceedings of the CCP4 Study Weekend. From First Map to Final Model, edited by S. Bailey, R. Hubbard & D. Waller, pp. 59-66. Warrington: Daresbury Laboratory.
- Kleywegt, 1996, Structure, 4, 1395, 10.1016/S0969-2126(96)00147-5 · DOI
- Krissinel, 2004, Acta Cryst. D, 60, 2256, 10.1107/S0907444904026460 · DOI
- Krissinel, 2004, Acta Cryst. D, 60, 2250, 10.1107/S0907444904027167 · DOI
- Langer, 2008, Nature Protoc., 3, 1171, 10.1038/nprot.2008.91 · DOI · Paper page
- Lorensen, 1987, ACM SIGGRAPH Comput. Graph., 21, 163, 10.1145/37402.37422 · DOI
- Lovell, 2003, Proteins, 50, 437, 10.1002/prot.10286 · DOI · Paper page
- Lovell, 2000, Proteins, 40, 389, 10.1002/1097-0134(20000815)40:3<389::AID-PROT50>3.0.CO;2-2 · DOI
- Merritt, 1997, Methods Enzymol., 277, 505, 10.1016/S0076-6879(97)77028-9 · DOI
- Murshudov, 1997, Acta Cryst. D, 53, 240, 10.1107/S0907444996012255 · DOI
- Oldfield, 2001, Acta Cryst. D, 57, 696, 10.1107/S0907444901003894 · DOI
- Potterton, 2004, Acta Cryst. D, 60, 2288, 10.1107/S0907444904023716 · DOI
- Robertson, 2007, Science, 315, 1549, 10.1126/science.1136231 · DOI · Paper page
- Robertson, 2008, Acta Cryst. D, 64, 738, 10.1107/S0907444908011578 · DOI
- Storoni, 2004, Acta Cryst. D, 60, 432, 10.1107/S0907444903028956 · DOI
- Terwilliger, 2006, Acta Cryst. D, 62, 915, 10.1107/S0907444906017161 · DOI
- Vagin, 2004, Acta Cryst. D, 60, 2184, 10.1107/S0907444904023510 · DOI
- Vonrhein, 2007, Methods Mol. Biol., 364, 215
- Wang, 2004, Acta Cryst. D, 60, 1244, 10.1107/S0907444904010674 · DOI
- Westbrook, J. D., Yang, H., Feng, Z. & Berman, H. M. (2005). International Tables for Crystallography, Vol. G, edited by S. R. Hall & B. McMahon, pp. 539-543. Heidelberg: Springer. · DOI
- Williams, 2005, Curr. Opin. Chem. Biol., 9, 371, 10.1016/j.cbpa.2005.06.007 · DOI
- Word, 1999, J. Mol. Biol., 285, 1711, 10.1006/jmbi.1998.2400 · DOI
- Word, 1999, J. Mol. Biol., 285, 1735, 10.1006/jmbi.1998.2401 · DOI
- Zhang, 1997, Methods Enzymol., 277, 53, 10.1016/S0076-6879(97)77006-X · DOI
Cited by
Sorted by citations
Overview of the CCP 4 suite and current developments
Winn, M. D., Ballard, C. C., Cowtan, K. D., Dodson, E. J., Emsley, P., Evans, P. R., Keegan, R. M., Krissinel, E. B., Leslie, A. G. W., McCoy, A., et al. (2011) · Acta Crystallographica Section D Biological Crystallography · doi:10.1107/s0907444910045749 · Cited by 12,353
Self-citationStructure, function and antigenicity of the SARS-CoV-2 spike glycoprotein
Walls, A. C., Park, Y.-J., Tortorici, M. A., Wall, A., McGuire, A. T., & Veesler, D. (2020) · doi:10.1101/2020.02.19.956581 · Cited by 8,586
Accurate prediction of protein structures and interactions using a 3-track network
Baek, M., DiMaio, F., Anishchenko, I., Dauparas, J., Ovchinnikov, S., Lee, G. R., Wang, J., Cong, Q., Kinch, L. N., Schaeffer, R. D., et al. (2021) · doi:10.1101/2021.06.14.448402 · Cited by 5,549
Towards automated crystallographic structure refinement with phenix.refine
Afonine, P. V., Grosse-Kunstleve, R. W., Echols, N., Headd, J. J., Moriarty, N. W., Mustyakimov, M., Terwilliger, T. C., Urzhumtsev, A., Zwart, P. H., & Adams, P. D. (2012) · Acta Crystallographica Section D Biological Crystallography · doi:10.1107/s0907444912001308 · Cited by 5,511
MolProbity: More and better reference data for improved all‐atom structure validation
Williams, C. J., Headd, J. J., Moriarty, N. W., Prisant, M. G., Videau, L. L., Deis, L. N., Verma, V., Keedy, D. A., Hintze, B. J., Chen, V. B., et al. (2018) · Protein Science · doi:10.1002/pro.3330 · Cited by 4,599
Pore-forming activity and structural autoinhibition of the gasdermin family
Ding, J., Wang, K., Liu, W., She, Y., Sun, Q., Shi, J., Sun, H., Wang, D.-C., & Shao, F. (2016) · Nature · doi:10.1038/nature18590 · Cited by 2,771
Cryo-EM structures of tau filaments from Alzheimer’s disease
Fitzpatrick, A. W. P., Falcon, B., He, S., Murzin, A. G., Murshudov, G., Garringer, H. J., Crowther, R. A., Ghetti, B., Goedert, M., & Scheres, S. H. W. (2017) · Nature · doi:10.1038/nature23002 · Cited by 2,061
An oral SARS-CoV-2 M pro inhibitor clinical candidate for the treatment of COVID-19
Owen, D. R., Allerton, C. M. N., Anderson, A. S., Aschenbrenner, L., Avery, M., Berritt, S., Boras, B., Cardin, R. D., Carlo, A., Coffman, K. J., et al. (2021) · Science · doi:10.1126/science.abl4784 · Cited by 2,033
Cross-neutralization of SARS-CoV-2 by a human monoclonal SARS-CoV antibody
Pinto, D., Park, Y.-J., Beltramello, M., Walls, A. C., Tortorici, M. A., Bianchi, S., Jaconi, S., Culap, K., Zatta, F., De Marco, A., et al. (2020) · Nature · doi:10.1038/s41586-020-2349-y · Cited by 1,885
Khalifa, A. A. Z., Ichikawa, M., Dai, D., Kubo, S., Black, C. S., Peri, K., McAlear, T. S., Veyron, S., Yang, S. K., Vargas, J., et al. (2020) · eLife · doi:10.7554/elife.52760 · Cited by 1,676
SARS-CoV-2 neutralizing antibody structures inform therapeutic strategies
Barnes, C. O., Jette, C. A., Abernathy, M. E., Dam, K.-M. A., Esswein, S. R., Gristick, H. B., Malyutin, A. G., Sharaf, N. G., Huey-Tubman, K. E., Lee, Y. E., et al. (2020) · Nature · doi:10.1038/s41586-020-2852-1 · Cited by 1,599
A neutralizing human antibody binds to the N-terminal domain of the Spike protein of SARS-CoV-2
Chi, X., Yan, R., Zhang, J., Zhang, G., Zhang, Y., Hao, M., Zhang, Z., Fan, P., Dong, Y., Yang, Y., et al. (2020) · Science · doi:10.1126/science.abc6952 · Cited by 1,385
mRNA vaccine-elicited antibodies to SARS-CoV-2 and circulating variants
Wang, Z., Schmidt, F., Weisblum, Y., Muecksch, F., Barnes, C. O., Finkin, S., Schaefer-Babajew, D., Cipolla, M., Gaebler, C., Lieberman, J. A., et al. (2021) · Nature · doi:10.1038/s41586-021-03324-6 · Cited by 1,343
Structure-based design of prefusion-stabilized SARS-CoV-2 spikes
Hsieh, C.-L., Goldsmith, J. A., Schaub, J. M., DiVenere, A. M., Kuo, H.-C., Javanmardi, K., Le, K. C., Wrapp, D., Lee, A. G., Liu, Y., et al. (2020) · Science · doi:10.1126/science.abd0826 · Cited by 1,303
Cao, Y., Su, B., Guo, X., Sun, W., Deng, Y., Bao, L., Zhu, Q., Zhang, X., Zheng, Y., Geng, C., et al. (2020) · Cell · doi:10.1016/j.cell.2020.05.025 · Cited by 1,188
Impact of cytosine methylation on DNA binding specificities of human transcription factors
Yin, Y., Morgunova, E., Jolma, A., Kaasinen, E., Sahu, B., Khund-Sayeed, S., Das, P. K., Kivioja, T., Dave, K., Zhong, F., et al. (2017) · Science · doi:10.1126/science.aaj2239 · Cited by 1,257
Structural basis of PROTAC cooperative recognition for selective protein degradation
Gadd, M. S., Testa, A., Lucas, X., Chan, K.-H., Chen, W., Lamont, D. J., Zengerle, M., & Ciulli, A. (2017) · Nature Chemical Biology · doi:10.1038/nchembio.2329 · Cited by 1,242
Structures of Cas9 endonucleases reveal RNA-mediated conformational activation
Jinek, M., Jiang, F., Taylor, D. W., Sternberg, S. H., Kaya, E., Ma, E., Anders, C., Hauer, M., Zhou, K., Lin, S., et al. (2014) · Science · doi:10.1126/science.1247997 · Cited by 1,230
Distinct conformational states of SARS-CoV-2 spike protein
Cai, Y., Zhang, J., Xiao, T., Peng, H., Sterling, S. M., Walsh, R. M., Rawson, S., Rits-Volloch, S., & Chen, B. (2020) · Science · doi:10.1126/science.abd4251 · Cited by 1,221
Large language models generate functional protein sequences across diverse families
Madani, A., Krause, B., Greene, E. R., Subramanian, S., Mohr, B. P., Holton, J. M., Olmos, J. L., Xiong, C., Sun, Z. Z., Socher, R., et al. (2023) · Nature Biotechnology · doi:10.1038/s41587-022-01618-2 · Cited by 1,078
Structure-Based Design of a Fusion Glycoprotein Vaccine for Respiratory Syncytial Virus
McLellan, J. S., Chen, M., Joyce, M. G., Sastry, M., Stewart-Jones, G. B. E., Yang, Y., Zhang, B., Chen, L., Srivatsan, S., Zheng, A., et al. (2013) · Science · doi:10.1126/science.1243283 · Cited by 1,126
Structural basis of STING binding with and phosphorylation by TBK1
Zhang, C., Shang, G., Gui, X., Zhang, X., Bai, X.-C., & Chen, Z. J. (2019) · Nature · doi:10.1038/s41586-019-1000-2 · Cited by 1,095
Gao, P., Ascano, M., Wu, Y., Barchet, W., Gaffney, B. L., Zillinger, T., Serganov, A. A., Liu, Y., Jones, R. A., Hartmann, G., et al. (2013) · Cell · doi:10.1016/j.cell.2013.04.046 · Cited by 1,101
Ultra-large library docking for discovering new chemotypes
Lyu, J., Wang, S., Balius, T. E., Singh, I., Levit, A., Moroz, Y. S., O’Meara, M. J., Che, T., Algaa, E., Tolmachova, K., et al. (2019) · Nature · doi:10.1038/s41586-019-0917-9 · Cited by 998
Allosteric inhibition of SHP2 phosphatase inhibits cancers driven by receptor tyrosine kinases
Chen, Y.-N. P., LaMarche, M. J., Chan, H. M., Fekkes, P., Garcia-Fortanet, J., Acker, M. G., Antonakos, B., Chen, C. H.-T., Chen, Z., Cooke, V. G., et al. (2016) · Nature · doi:10.1038/nature18621 · Cited by 925
SARS-CoV-2 Omicron-B.1.1.529 leads to widespread escape from neutralizing antibody responses
Dejnirattisai, W., Huo, J., Zhou, D., Zahradník, J., Supasa, P., Liu, C., Duyvesteyn, H. M. E., Ginn, H. M., Mentzer, A. J., Tuekprakhon, A., et al. (2022) · Cell · doi:10.1016/j.cell.2021.12.046 · Cited by 930
Barnes, C. O., West, A. P., Huey-Tubman, K. E., Hoffmann, M. A. G., Sharaf, N. G., Hoffman, P. R., Koranda, N., Gristick, H. B., Gaebler, C., Muecksch, F., et al. (2020) · Cell · doi:10.1016/j.cell.2020.06.025 · Cited by 795
Structure of RSV Fusion Glycoprotein Trimer Bound to a Prefusion-Specific Neutralizing Antibody
McLellan, J. S., Chen, M., Leung, S., Graepel, K. W., Du, X., Yang, Y., Zhou, T., Baxa, U., Yasuda, E., Beaumont, T., et al. (2013) · Science · doi:10.1126/science.1234914 · Cited by 883
Solca, F., Dahl, G., Zoephel, A., Bader, G., Sanderson, M., Klein, C., Kraemer, O., Himmelsbach, F., Haaksma, E., & Adolf, G. R. (2012) · The Journal of Pharmacology and Experimental Therapeutics · doi:10.1124/jpet.112.197756 · Cited by 865
The target landscape of clinical kinase drugs
Klaeger, S., Heinzlmeir, S., Wilhelm, M., Polzer, H., Vick, B., Koenig, P.-A., Reinecke, M., Ruprecht, B., Petzoldt, S., Meng, C., et al. (2017) · Science · doi:10.1126/science.aan4368 · Cited by 854
Targeted inhibition of mutant IDH2 in leukemia cells induces cellular differentiation
Wang, F., Travins, J., DeLaBarre, B., Penard-Lacronique, V., Schalm, S., Hansen, E., Straley, K., Kernytsky, A., Liu, W., Gliser, C., et al. (2013) · Science · doi:10.1126/science.1234769 · Cited by 804
Pyruvate kinase M2 activators promote tetramer formation and suppress tumorigenesis
Anastasiou, D., Yu, Y., Israelsen, W. J., Jiang, J.-K., Boxer, M. B., Hong, B. S., Tempel, W., Dimov, S., Shen, M., Jha, A., et al. (2012) · Nature Chemical Biology · doi:10.1038/nchembio.1060 · Cited by 816
Biochemical and Structural Analysis of Common Cancer-Associated KRAS Mutations
Hunter, J. C., Manandhar, A., Carrasco, M. A., Gurbani, D., Gondi, S., & Westover, K. D. (2015) · Molecular Cancer Research · doi:10.1158/1541-7786.mcr-15-0203 · Cited by 786
Pre-fusion structure of a human coronavirus spike protein
Kirchdoerfer, R. N., Cottrell, C. A., Wang, N., Pallesen, J., Yassine, H. M., Turner, H. L., Corbett, K. S., Graham, B. S., McLellan, J. S., & Ward, A. B. (2016) · Nature · doi:10.1038/nature17200 · Cited by 765
BNT162b vaccines protect rhesus macaques from SARS-CoV-2
Vogel, A. B., Kanevsky, I., Che, Y., Swanson, K. A., Muik, A., Vormehr, M., Kranz, L. M., Walzer, K. C., Hein, S., Güler, A., et al. (2021) · Nature · doi:10.1038/s41586-021-03275-y · Cited by 694
Structural basis of a shared antibody response to SARS-CoV-2
Yuan, M., Liu, H., Wu, N. C., Lee, C.-C. D., Zhu, X., Zhao, F., Huang, D., Yu, W., Hua, Y., Tien, H., et al. (2020) · Science · doi:10.1126/science.abd2321 · Cited by 589
SARS-CoV-2 Omicron variant: Antibody evasion and cryo-EM structure of spike protein–ACE2 complex
Mannar, D., Saville, J. W., Zhu, X., Srivastava, S. S., Berezuk, A. M., Tuttle, K. S., Marquez, A. C., Sekirov, I., & Subramaniam, S. (2022) · Science · doi:10.1126/science.abn7760 · Cited by 630
A novel cereblon modulator recruits GSPT1 to the CRL4CRBN ubiquitin ligase
Matyskiela, M. E., Lu, G., Ito, T., Pagarigan, B., Lu, C.-C., Miller, K., Fang, W., Wang, N.-Y., Nguyen, D., Houston, J., et al. (2016) · Nature · doi:10.1038/nature18611 · Cited by 701
An orally available non-nucleotide STING agonist with antitumor activity
Pan, B.-S., Perera, S. A., Piesvaux, J. A., Presland, J. P., Schroeder, G. K., Cumming, J. N., Trotter, B. W., Altman, M. D., Buevich, A. V., Cash, B., et al. (2020) · Science · doi:10.1126/science.aba6098 · Cited by 694
Automated model building and protein identification in cryo-EM maps
Jamali, K., Käll, L., Zhang, R., Brown, A., Kimanius, D., & Scheres, S. H. W. (2023) · doi:10.1101/2023.05.16.541002 · Cited by 686
Thomson, E. C., Rosen, L. E., Shepherd, J. G., Spreafico, R., da Silva Filipe, A., Wojcechowskyj, J. A., Davis, C., Piccoli, L., Pascall, D. J., Dillen, J., et al. (2021) · Cell · doi:10.1016/j.cell.2021.01.037 · Cited by 606
Structure of the mechanically activated ion channel Piezo1
Saotome, K., Murthy, S. E., Kefauver, J. M., Whitwam, T., Patapoutian, A., & Ward, A. B. (2018) · Nature · doi:10.1038/nature25453 · Cited by 649
A Potent and Selective Small-Molecule Degrader of STAT3 Achieves Complete Tumor Regression In Vivo
Bai, L., Zhou, H., Xu, R., Zhao, Y., Chinnaswamy, K., McEachern, D., Chen, J., Yang, C.-Y., Liu, Z., Wang, M., et al. (2019) · Cancer Cell · doi:10.1016/j.ccell.2019.10.002 · Cited by 652
Ultrapotent human antibodies protect against SARS-CoV-2 challenge via multiple mechanisms
Tortorici, M. A., Beltramello, M., Lempp, F. A., Pinto, D., Dang, H. V., Rosen, L. E., McCallum, M., Bowen, J., Minola, A., Jaconi, S., et al. (2020) · Science · doi:10.1126/science.abe3354 · Cited by 510
De novo protein design by deep network hallucination
Anishchenko, I., Chidyausiku, T. M., Ovchinnikov, S., Pellock, S. J., & Baker, D. (2020) · doi:10.1101/2020.07.22.211482 · Cited by 629
Structure and mechanogating mechanism of the Piezo1 channel
Zhao, Q., Zhou, H., Chi, S., Wang, Y., Wang, J., Geng, J., Wu, K., Liu, W., Zhang, T., Dong, M.-Q., et al. (2018) · Nature · doi:10.1038/nature25743 · Cited by 628
Design of protein-binding proteins from the target structure alone
Cao, L., Coventry, B., Goreshnik, I., Huang, B., Sheffler, W., Park, J. S., Jude, K. M., Marković, I., Kadam, R. U., Verschueren, K. H. G., et al. (2022) · Nature · doi:10.1038/s41586-022-04654-9 · Cited by 577
Non-Homeostatic Body Weight Regulation Through a Brainstem-Restricted Receptor for GDF15
Hsu, J.-Y., Crawley, S., Chen, M., Ayupova, D. A., Lindhout, D. A., Higbee, J., Kutach, A., Joo, W., Gao, Z., Fu, D., et al. (2017) · Nature · doi:10.1038/nature24042 · Cited by 616
Smart, O. S., Womack, T. O., Flensburg, C., Keller, P., Paciorek, W., Sharff, A., Vonrhein, C., & Bricogne, G. (2012) · Acta Crystallographica Section D Biological Crystallography · doi:10.1107/s0907444911056058 · Cited by 612
Disordered methionine metabolism in MTAP/CDKN2A-deleted cancers leads to dependence on PRMT5
Mavrakis, K. J., McDonald, E. R., Schlabach, M. R., Billy, E., Hoffman, G. R., deWeck, A., Ruddy, D. A., Venkatesan, K., Yu, J., McAllister, G., et al. (2016) · Science · doi:10.1126/science.aad5944 · Cited by 607
Unexpected Receptor Functional Mimicry Elucidates Activation of Coronavirus Fusion
Walls, A. C., Xiong, X., Park, Y.-J., Tortorici, M. A., Snijder, J., Quispe, J., Cameroni, E., Gopal, R., Dai, M., Lanzavecchia, A., et al. (2019) · Cell · doi:10.1016/j.cell.2018.12.028 · Cited by 582
Structural basis of SARS-CoV-2 Omicron immune evasion and receptor engagement
McCallum, M., Czudnochowski, N., Rosen, L. E., Zepeda, S. K., Bowen, J. E., Walls, A. C., Hauser, K., Joshi, A., Stewart, C., Dillen, J. R., et al. (2022) · Science · doi:10.1126/science.abn8652 · Cited by 535
Automated structure refinement of macromolecular assemblies from cryo-EM maps using Rosetta
Wang, R. Y.-R., Song, Y., Barad, B. A., Cheng, Y., Fraser, J. S., & DiMaio, F. (2016) · eLife · doi:10.7554/elife.17219 · Cited by 457
KAT2A coupled with the α-KGDH complex acts as a histone H3 succinyltransferase
Wang, Y., Guo, Y. R., Liu, K., Yin, Z., Liu, R., Xia, Y., Tan, L., Yang, P., Lee, J.-H., Li, X.-J., et al. (2017) · Nature · doi:10.1038/nature25003 · Cited by 567
A selective inhibitor of PRMT5 with in vivo and in vitro potency in MCL models
Chan-Penebre, E., Kuplast, K. G., Majer, C. R., Boriack-Sjodin, P. A., Wigle, T. J., Johnston, L. D., Rioux, N., Munchhof, M. J., Jin, L., Jacques, S. L., et al. (2015) · Nature Chemical Biology · doi:10.1038/nchembio.1810 · Cited by 569
Wrobel, A. G., Benton, D. J., Xu, P., Roustan, C., Martin, S. R., Rosenthal, P. B., Skehel, J. J., & Gamblin, S. J. (2020) · Nature Structural & Molecular Biology · doi:10.1038/s41594-020-0468-7 · Cited by 544
Pan-KRAS Inhibitor Disables Oncogenic Signalling and Tumour Growth
Kim, D., Herdeis, L., Rudolph, D., Zhao, Y., Böttcher, J., Vides, A., Ayala-Santos, C. I., Pourfarjam, Y., Cuevas-Navarro, A., Xue, J. Y., et al. (2023) · Nature · doi:10.1038/s41586-023-06123-3 · Cited by 534
BAF complex vulnerabilities in cancer demonstrated via structure-based PROTAC design
Farnaby, W., Koegl, M., Roy, M. J., Whitworth, C., Diers, E., Trainor, N., Zollman, D., Steurer, S., Karolyi-Oezguer, J., Riedmueller, C., et al. (2019) · Nature Chemical Biology · doi:10.1038/s41589-019-0294-6 · Cited by 562
Defining the human C2H2 zinc finger degrome targeted by thalidomide analogs through CRBN
Sievers, Q. L., Petzold, G., Bunker, R. D., Renneville, A., Słabicki, M., Liddicoat, B. J., Abdulrahman, W., Mikkelsen, T., Ebert, B. L., & Thomä, N. H. (2018) · Science · doi:10.1126/science.aat0572 · Cited by 537
De novo design of potent and selective mimics of IL-2 and IL-15
Silva, D.-A., Yu, S., Ulge, U. Y., Spangler, J. B., Jude, K. M., Labão-Almeida, C., Ali, L. R., Quijano-Rubio, A., Ruterbusch, M., Leung, I., et al. (2019) · Nature · doi:10.1038/s41586-018-0830-7 · Cited by 531
Chamberlain, P. P., Lopez-Girona, A., Miller, K., Carmel, G., Pagarigan, B., Chie-Leon, B., Rychak, E., Corral, L. G., Ren, Y. J., Wang, M., et al. (2014) · Nature Structural & Molecular Biology · doi:10.1038/nsmb.2874 · Cited by 531
The structural basis for cohesin–CTCF-anchored loops
Li, Y., Haarhuis, J. H. I., Sedeño Cacciatore, Á., Oldenkamp, R., van Ruiten, M. S., Willems, L., Teunissen, H., Muir, K. W., de Wit, E., Rowland, B. D., et al. (2020) · Nature · doi:10.1038/s41586-019-1910-z · Cited by 459
Structure of a RING E3 ligase and ubiquitin-loaded E2 primed for catalysis
Plechanovová, A., Jaffray, E. G., Tatham, M. H., Naismith, J. H., & Hay, R. T. (2012) · Nature · doi:10.1038/nature11376 · Cited by 521
Bioenergetic cost of making an adenosine triphosphate molecule in animal mitochondria
Watt, I. N., Montgomery, M. G., Runswick, M. J., Leslie, A. G. W., & Walker, J. E. (2010) · Proceedings of the National Academy of Sciences · doi:10.1073/pnas.1011099107 · Cited by 513
Structure of Hdac3 Bound to Co-Repressor and Inositol Tetraphosphate
Watson, P. J., Fairall, L., Santos, G. M., & Schwabe, J. W. R. (2012) · Nature · doi:10.1038/nature10728 · Cited by 505
Histone deacetylase 6 structure and molecular basis of catalysis and inhibition
Hai, Y., & Christianson, D. W. (2016) · Nature Chemical Biology · doi:10.1038/nchembio.2134 · Cited by 521
A highly potent and selective Vps34 inhibitor alters vesicle trafficking and autophagy
Ronan, B., Flamand, O., Vescovi, L., Dureuil, C., Durand, L., Fassy, F., Bachelot, M.-F., Lamberton, A., Mathieu, M., Bertrand, T., et al. (2014) · Nature Chemical Biology · doi:10.1038/nchembio.1681 · Cited by 500
Structure of the plastic-degrading Ideonella sakaiensis MHETase bound to a substrate
Palm, G. J., Reisky, L., Böttcher, D., Müller, H., Michels, E. A. P., Walczak, M. C., Berndt, L., Weiss, M. S., Bornscheuer, U. T., & Weber, G. (2019) · Nature Communications · doi:10.1038/s41467-019-09326-3 · Cited by 491
Hachimoji DNA and RNA: A genetic system with eight building blocks.
Hoshika, S., Leal, N. A., Kim, M.-J., Kim, M.-S., Karalkar, N. B., Kim, H.-J., Bates, A. M., Watkins, N. E., SantaLucia, H. A., Meyer, A. J., et al. (2019) · Science · doi:10.1126/science.aat0971 · Cited by 494
AG-221, a First-in-Class Therapy Targeting Acute Myeloid Leukemia Harboring Oncogenic IDH2 Mutations
Yen, K., Travins, J., Wang, F., David, M. D., Artin, E., Straley, K., Padyana, A., Gross, S., DeLaBarre, B., Tobin, E., et al. (2017) · Cancer Discovery · doi:10.1158/2159-8290.cd-16-1034 · Cited by 471
SARS-CoV-2 immune evasion by the B.1.427/B.1.429 variant of concern
McCallum, M., Bassi, J., De Marco, A., Chen, A., Walls, A. C., Di Iulio, J., Tortorici, M. A., Navarro, M.-J., Silacci-Fregni, C., Saliba, C., et al. (2021) · Science · doi:10.1126/science.abi7994 · Cited by 412
Molecular basis of USP7 inhibition by selective small-molecule inhibitors.
Turnbull, A. P., Ioannidis, S., Krajewski, W. W., Pinto-Fernandez, A., Heride, C., Martin, A. C. L., Tonkin, L. M., Townsend, E. C., Buker, S. M., Lancia, D. R., et al. (2017) · Nature · doi:10.1038/nature24451 · Cited by 463
Bohrmann, B., Baumann, K., Benz, J., Gerber, F., Huber, W., Knoflach, F., Messer, J., Oroszlan, K., Rauchenberger, R., Richter, W. F., et al. (2012) · Journal of Alzheimer's Disease · doi:10.3233/jad-2011-110977 · Cited by 448
Structural basis for leucine sensing by the Sestrin2-mTORC1 pathway
Saxton, R. A., Knockenhauer, K. E., Wolfson, R. L., Chantranupong, L., Pacold, M. E., Wang, T., Schwartz, T. U., & Sabatini, D. M. (2016) · Science · doi:10.1126/science.aad2087 · Cited by 457
The molecular basis of JAK/STAT inhibition by SOCS1
Liau, N. P. D., Laktyushin, A., Lucet, I. S., Murphy, J. M., Yao, S., Whitlock, E., Callaghan, K., Nicola, N. A., Kershaw, N. J., & Babon, J. J. (2018) · Nature Communications · doi:10.1038/s41467-018-04013-1 · Cited by 456
Structure-based membrane dome mechanism for Piezo mechanosensitivity
Guo, Y. R., & MacKinnon, R. (2017) · eLife · doi:10.7554/elife.33660 · Cited by 446
Hargrove, T. Y., Friggeri, L., Wawrzak, Z., Qi, A., Hoekstra, W. J., Schotzinger, R. J., York, J. D., Guengerich, F. P., & Lepesheva, G. I. (2017) · Journal of Biological Chemistry · doi:10.1074/jbc.m117.778308 · Cited by 444
SARS-CoV-2 M pro inhibitors with antiviral activity in a transgenic mouse model
Qiao, J., Li, Y.-S., Zeng, R., Liu, F.-L., Luo, R.-H., Huang, C., Wang, Y.-F., Zhang, J., Quan, B., Shen, C., et al. (2021) · Science · doi:10.1126/science.abf1611 · Cited by 465
Atomic structure of Hsp90-Cdc37-Cdk4 reveals that Hsp90 traps and stabilizes an unfolded kinase
Verba, K. A., Wang, R. Y.-R., Arakawa, A., Liu, Y., Shirouzu, M., Yokoyama, S., & Agard, D. A. (2016) · Science · doi:10.1126/science.aaf5023 · Cited by 424
The CDK inhibitor CR8 acts as a molecular glue degrader that depletes cyclin K
Słabicki, M., Kozicka, Z., Petzold, G., Li, Y.-D., Manojkumar, M., Bunker, R. D., Donovan, K. A., Sievers, Q. L., Koeppel, J., Suchyta, D., et al. (2020) · Nature · doi:10.1038/s41586-020-2374-x · Cited by 433
Near-atomic model of microtubule-tau interactions
Kellogg, E. H., Hejab, N. M. A., Poepsel, S., Downing, K. H., DiMaio, F., & Nogales, E. (2018) · Science · doi:10.1126/science.aat1780 · Cited by 416
Damo, S. M., Kehl-Fie, T. E., Sugitani, N., Holt, M. E., Rathi, S., Murphy, W. J., Zhang, Y., Betz, C., Hench, L., Fritz, G., et al. (2013) · Proceedings of the National Academy of Sciences · doi:10.1073/pnas.1220341110 · Cited by 388
Selective small-molecule inhibition of an RNA structural element
Howe, J. A., Wang, H., Fischmann, T. O., Balibar, C. J., Xiao, L., Galgoci, A. M., Malinverni, J. C., Mayhood, T., Villafania, A., Nahvi, A., et al. (2015) · Nature · doi:10.1038/nature15542 · Cited by 407
De novo design of a fluorescence-activating β-barrel
Dou, J., Vorobieva, A. A., Sheffler, W., Doyle, L. A., Park, H., Bick, M. J., Mao, B., Foight, G. W., Lee, M. Y., Gagnon, L. A., et al. (2018) · Nature · doi:10.1038/s41586-018-0509-0 · Cited by 351
Hillig, R. C., Sautier, B., Schroeder, J., Moosmayer, D., Hilpmann, A., Stegmann, C. M., Werbeck, N. D., Briem, H., Boemer, U., Weiske, J., et al. (2019) · Proceedings of the National Academy of Sciences · doi:10.1073/pnas.1812963116 · Cited by 388
A highly stable prefusion RSV F vaccine derived from structural analysis of the fusion mechanism
Krarup, A., Truan, D., Furmanova-Hollenstein, P., Bogaert, L., Bouchier, P., Bisschop, I. J. M., Widjojoatmodjo, M. N., Zahn, R., Schuitemaker, H., McLellan, J. S., et al. (2015) · Nature Communications · doi:10.1038/ncomms9143 · Cited by 383
Covalent targeting of remote cysteine residues to develop CDK12 and CDK13 inhibitors
Zhang, T., Kwiatkowski, N., Olson, C. M., Dixon-Clarke, S. E., Abraham, B. J., Greifenberg, A. K., Ficarro, S. B., Elkins, J. M., Liang, Y., Hannett, N. M., et al. (2016) · Nature Chemical Biology · doi:10.1038/nchembio.2166 · Cited by 374
Atomic-level modelling of the HIV capsid
Pornillos, O., Ganser-Pornillos, B. K., & Yeager, M. (2011) · Nature · doi:10.1038/nature09640 · Cited by 372
Structural and functional ramifications of antigenic drift in recent SARS-CoV-2 variants
Yuan, M., Huang, D., Lee, C.-C. D., Wu, N. C., Jackson, A. M., Zhu, X., Liu, H., Peng, L., van Gils, M. J., Sanders, R. W., et al. (2021) · doi:10.1101/2021.02.16.430500 · Cited by 364
Targeting a neoantigen derived from a common TP53 mutation
Hsiue, E. H.-C., Wright, K. M., Douglass, J., Hwang, M. S., Mog, B. J., Pearlman, A. H., Paul, S., DiNapoli, S. R., Konig, M. F., Wang, Q., et al. (2021) · Science · doi:10.1126/science.abc8697 · Cited by 367
Structural integration in hypoxia-inducible factors
Wu, D., Potluri, N., Lu, J., Kim, Y., & Rastinejad, F. (2015) · Nature · doi:10.1038/nature14883 · Cited by 346
AI-based structure prediction empowers integrative structural analysis of human nuclear pores
Mosalaganti, S., Obarska-Kosinska, A., Siggel, M., Taniguchi, R., Turoňová, B., Zimmerli, C. E., Buczak, K., Schmidt, F. H., Margiotta, E., Mackmull, M.-T., et al. (2022) · Science · doi:10.1126/science.abm9506 · Cited by 355
Architecture of human mTOR complex 1
Aylett, C. H. S., Sauer, E., Imseng, S., Boehringer, D., Hall, M. N., Ban, N., & Maier, T. (2016) · Science · doi:10.1126/science.aaa3870 · Cited by 344
Crystal structure of SARS-CoV-2 papain-like protease
Gao, X., Qin, B., Chen, P., Zhu, K., Hou, P., Wojdyla, J. A., Wang, M., & Cui, S. (2021) · Acta Pharmaceutica Sinica B · doi:10.1016/j.apsb.2020.08.014 · Cited by 336
Hemoglobin Variants: Biochemical Properties and Clinical Correlates
Thom, C. S., Dickson, C. F., Gell, D. A., & Weiss, M. J. (2013) · Cold Spring Harbor Perspectives in Medicine · doi:10.1101/cshperspect.a011858 · Cited by 336
Rapid Covalent-Probe Discovery by Electrophile-Fragment Screening
Resnick, E., Bradley, A., Gan, J., Douangamath, A., Krojer, T., Sethi, R., Geurink, P. P., Aimon, A., Amitai, G., Bellini, D., et al. (2019) · Journal of the American Chemical Society · doi:10.1021/jacs.9b02822 · Cited by 335
Cryo-EM structures of the TMEM16A calcium-activated chloride channel
Dang, S., Feng, S., Tien, J., Peters, C. J., Bulkley, D., Lolicato, M., Zhao, J., Zuberbühler, K., Ye, W., Qi, L., et al. (2017) · Nature · doi:10.1038/nature25024 · Cited by 333
Computational design of water-soluble α-helical barrels
Thomson, A. R., Wood, C. W., Burton, A. J., Bartlett, G. J., Sessions, R. B., Brady, R. L., & Woolfson, D. N. (2014) · Science · doi:10.1126/science.1257452 · Cited by 330
Engineering an allosteric transcription factor to respond to new ligands
Taylor, N. D., Garruss, A. S., Moretti, R., Chan, S., Arbing, M. A., Cascio, D., Rogers, J. K., Isaacs, F. J., Kosuri, S., Baker, D., et al. (2016) · Nature Methods · doi:10.1038/nmeth.3696 · Cited by 328
Molecular Basis of Tubulin Transport Within the Cilium by IFT74 and IFT81
Bhogaraju, S., Cajanek, L., Fort, C., Blisnick, T., Weber, K., Taschner, M., Mizuno, N., Lamla, S., Bastin, P., Nigg, E. A., et al. (2013) · Science · doi:10.1126/science.1240985 · Cited by 317
Metadata
- Authors
- Emsley, P., Lohkamp, B., Scott, W. G., & Cowtan, K.
- Venue
- Acta Crystallographica Section D Biological Crystallography
- Published
- 2010-03-24
- Volume
- 66
- Issue
- 4
- Pages
- 486-501
- ISSN
- 0907-4449
- PMC
- PMC2852313
- Cited by
- 29,915
- References
- 1
About these checks
Registry, retraction, Cites and statistics results are computed, not judged, with one exception: a printed reference that no index lists is read once by a model before it counts as a citation error. Claims are extracted by a model and kept only when their quote appears verbatim in the text; each cited source is then checked, with a model’s help, for whether it says what the claim relies on. Those verdicts can be wrong — read the claim’s quote and the cited source before relying on one.
Statistics and arithmetic are recomputed, not judged.
Confidence bands are shown only for fields calibrated on our annotated test set. None is calibrated yet, so no band is shown.
What counts as a claim ›How we measure confidence ›How we check this ›
Are you an author, or do you see a problem with this page? Request a review
