

The DOI matches its Crossref record; 75 of the 90 references it cites were found in a registry or an index; none of the 70 sources its claims cite is checked for support yet.
DeepIGeoS: A Deep Interactive Geodesic Framework for Medical Image Segmentation
Open accessAbstract
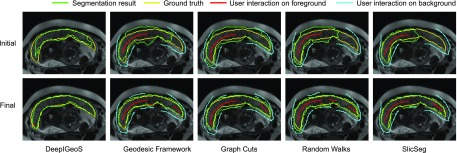
Accurate medical image segmentation is essential for diagnosis, surgical planning and many other applications. Convolutional Neural Networks (CNNs) have become the state-of-the-art automatic segmentation methods. However, fully automatic results may still need to be refined to become accurate and robust enough for clinical use. We propose a deep learning-based interactive segmentation method to improve the results obtained by an automatic CNN and to reduce user interactions during refinement for higher accuracy. We use one CNN to obtain an initial automatic segmentation, on which user interactions are added to indicate mis-segmentations. Another CNN takes as input the user interactions with the initial segmentation and gives a refined result. We propose to combine user interactions with CNNs through geodesic distance transforms, and propose a resolution-preserving network that gives a better dense prediction. In addition, we integrate user interactions as hard constraints into a back-propagatable Conditional Random Field. We validated the proposed framework in the context of 2D placenta segmentation from fetal MRI and 3D brain tumor segmentation from FLAIR images. Experimental results show our method achieves a large improvement from automatic CNNs, and obtains comparable and even higher accuracy with fewer user interventions and less time compared with traditional interactive methods.
Overview
AI snapshot
Written from the paper’s full text.
TL;DR
DeepIGeoS is a two-stage interactive segmentation framework in which a CNN proposes an initial segmentation and a second CNN refines it using user clicks/scribbles encoded as geodesic distance maps, with a trainable CRF that can enforce user interactions as hard constraints. It improved over automatic CNNs and achieved comparable or higher accuracy with fewer interactions and less user time than traditional interactive methods in 2D fetal MRI placenta and 3D brain tumor segmentation.
Key findings
- In 2D placenta segmentation, 2D P-Net + CRF-Net(f) reached Dice 85.86 ± 11.67% and ASSD 1.85 ± 1.30 pixels; after interactive refinement, 2D R-Net + CRF-Net(fu) reached Dice 89.31 ± 5.33% and ASSD 1.22 ± 0.55 pixels.
- In 3D brain tumor segmentation, 3D P-Net + CRF-Net(f) reached Dice 87.55 ± 6.72% and ASSD 2.04 ± 1.70 pixels; after refinement, 3D R-Net + CRF-Net(fu) reached Dice 89.93 ± 6.49% and ASSD 1.43 ± 1.16 pixels.
- Geodesic distance maps outperformed Euclidean distance maps for refinement, and CRF-Net(fu) further improved results; CRF-Net(f) with freeform pairwise potentials outperformed Dense CRF and CRF-Net(g) in the reported comparisons.
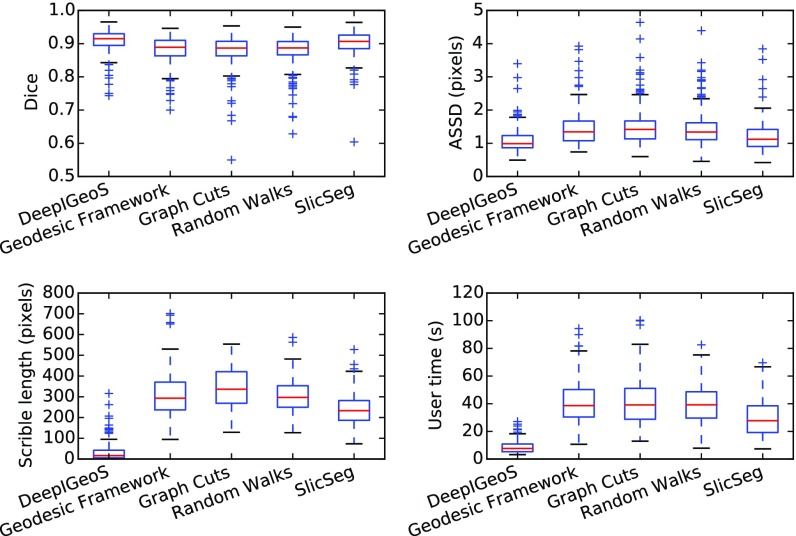
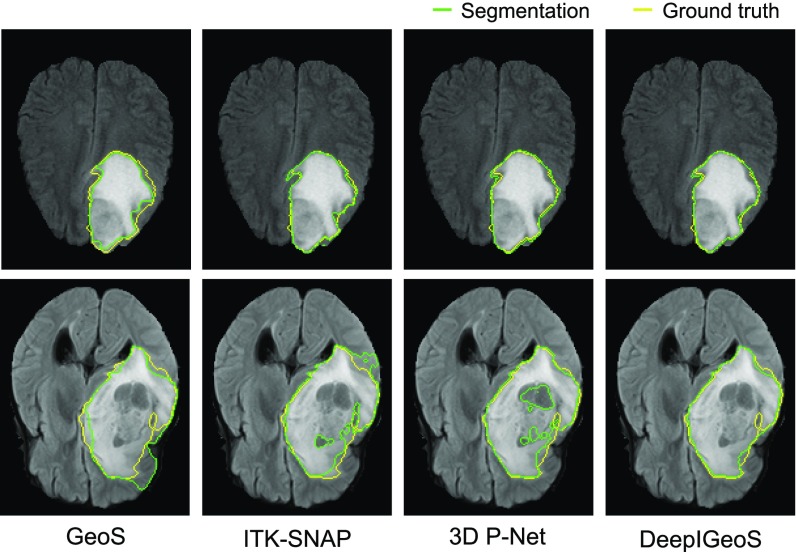
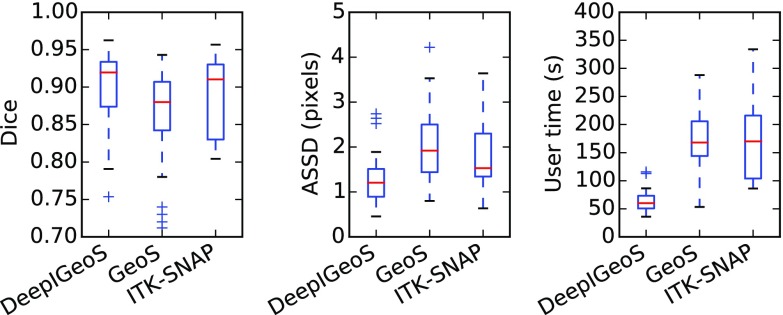
- Compared with traditional interactive methods, DeepIGeoS required far fewer user interactions and less user time; for 3D brain tumor segmentation, user time was about one third of that for GeoS and ITK-SNAP.
Methods
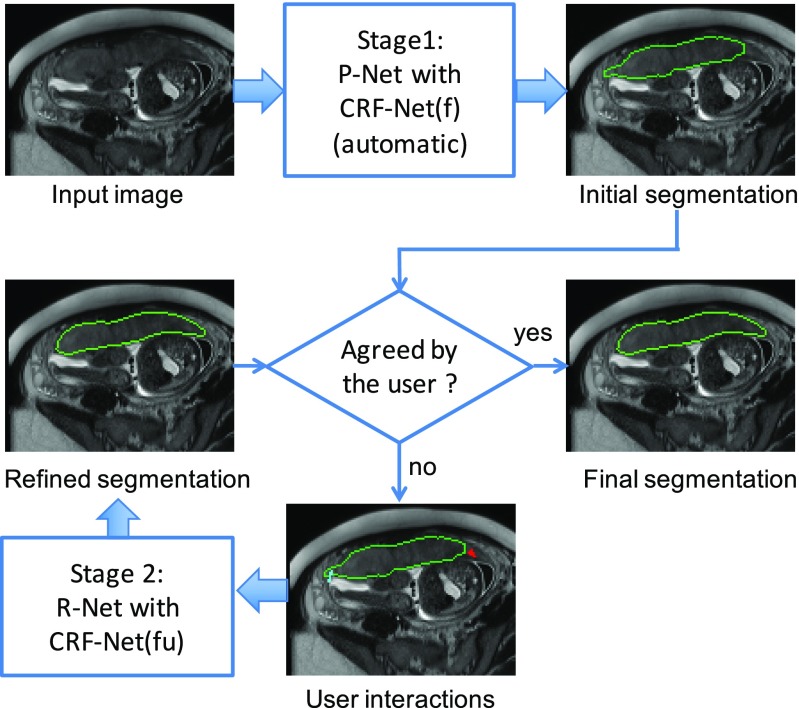
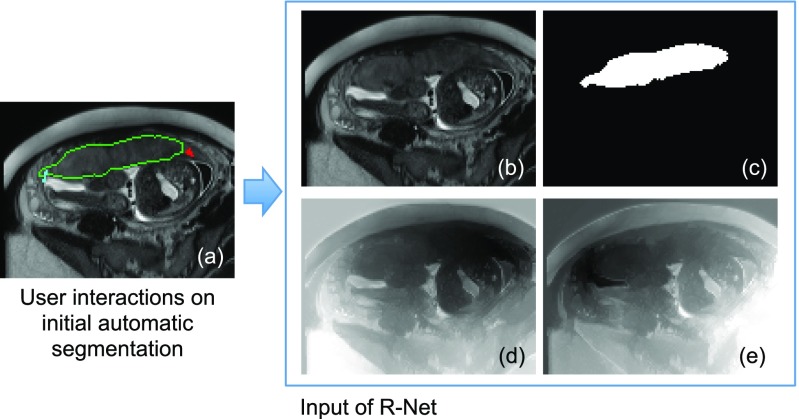
- Two-stage pipeline: P-Net produces an automatic initial segmentation; R-Net takes the original image, initial segmentation, and user interactions converted into geodesic distance maps to refine the result.
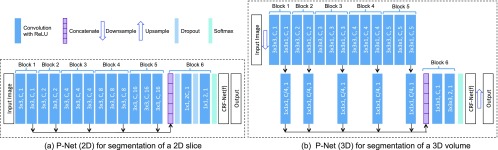
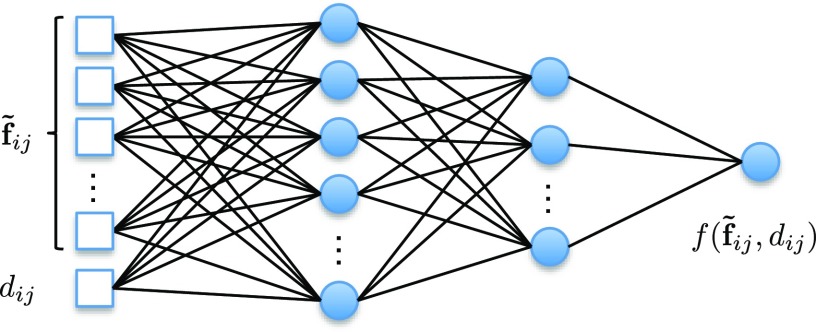
- Networks use a resolution-preserving dilated-convolution structure adapted from VGG-16, with multi-scale feature concatenation; a back-propagatable CRF-Net uses freeform pairwise potentials and, in R-Net, user scribbles as hard constraints.
- Data: 2D placenta from T2-weighted fetal MRI of 25 pregnant women, with 17 volumes/624 slices for training, 3 volumes/122 slices for validation, and 5 volumes/179 slices for testing; 3D brain tumor from the 2015 BraTS training set, using FLAIR images only, with 234 cases for training and 40 for testing. Evaluation used Dice and ASSD, with Student’s t-test for significance.
Limitations
- The paper does not include a dedicated limitations section; it states that the framework can be extended to deal with multiple organs in the future.
- Evident from the experiments: validation is limited to two binary segmentation tasks, and the 3D experiment uses only FLAIR images and segments only the whole tumor, not multi-label or multi-modality tumor subregions.
- Evident from the text: R-Net training uses simulated user interactions generated from mis-segmented regions, which may not fully match real user behavior.
Model-written summary. Check it against the paper before relying on it.
Integrity signals
Registry
Cites
Statistics
Figures
Verification
Claims the paper makes
42 Not checked yet · 34 Own result · 9 Own interpretation · 6 No basis given · 3 Own method
A result the paper reports from its own data — it cites no other source for it, so there is none to check. The quote shows it is in the paper.
In the paper
“Experimental results show our method achieves a large improvement from automatic CNNs”
§ DeepIGeoS: A Deep Interactive Geodesic Framework for Medical Image Segmentation > Abstract
plaindirect- Asserted: passes — The authors put it forward as true.
- Checkable: passes — It can be checked against evidence.
- Load-bearing: passes — The paper’s conclusions depend on it.
- Based: passes — The paper gives a reason why it holds.
A result the paper reports from its own data — it cites no other source for it, so there is none to check. The quote shows it is in the paper.
In the paper
“3D P-Net outperforms these three counterparts”
§ DeepIGeoS: A Deep Interactive Geodesic Framework for Medical Image Segmentation > Experiments > 3D Brain Tumor Segmentation from FLAIR Images
plaindirect- Asserted: passes — The authors put it forward as true.
- Checkable: passes — It can be checked against evidence.
- Load-bearing: unclear — It is unclear whether the paper’s conclusions depend on it.
- Based: passes — The paper gives a reason why it holds.
A result the paper reports from its own data — it cites no other source for it, so there is none to check. The quote shows it is in the paper.
In the paper
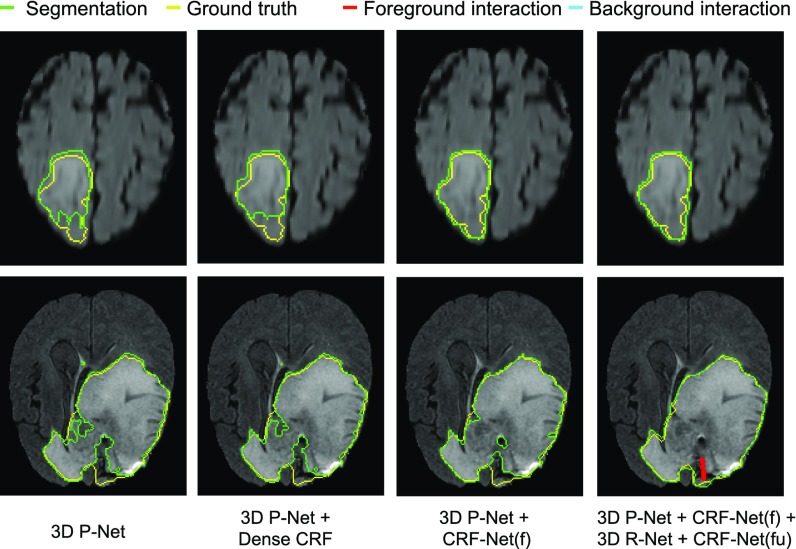
“only CRF-Net(f) obtains significantly better segmentation than 3D P-Net”
§ DeepIGeoS: A Deep Interactive Geodesic Framework for Medical Image Segmentation > Experiments > 3D Brain Tumor Segmentation from FLAIR Images
plaindirect- Asserted: passes — The authors put it forward as true.
- Checkable: passes — It can be checked against evidence.
- Load-bearing: passes — The paper’s conclusions depend on it.
- Based: passes — The paper gives a reason why it holds.
A result the paper reports from its own data — it cites no other source for it, so there is none to check. The quote shows it is in the paper.
In the paper
“CRF-Net(fu) can further improve the segmentation.”
§ DeepIGeoS: A Deep Interactive Geodesic Framework for Medical Image Segmentation > Experiments > 2D Placenta Segmentation from Fetal MRI
plaindirect- Asserted: passes — The authors put it forward as true.
- Checkable: passes — It can be checked against evidence.
- Load-bearing: passes — The paper’s conclusions depend on it.
- Based: passes — The paper gives a reason why it holds.
- Rests on an assumption: Simulated user interactions (random clicks in mis-segmented regions) are representative of real user interactions for training R-Net.
- Rests on an assumption: The manually delineated ground truth is accurate.
A result the paper reports from its own data — it cites no other source for it, so there is none to check. The quote shows it is in the paper.
In the paper
“Notice no initial scribbles are needed for DeepIGeoS.”
§ DeepIGeoS: A Deep Interactive Geodesic Framework for Medical Image Segmentation > Experiments > 2D Placenta Segmentation from Fetal MRI
plain- Asserted: passes — The authors put it forward as true.
- Checkable: passes — It can be checked against evidence.
- Load-bearing: passes — The paper’s conclusions depend on it.
- Based: passes — The paper gives a reason why it holds.
A result the paper reports from its own data — it cites no other source for it, so there is none to check. The quote shows it is in the paper.
In the paper
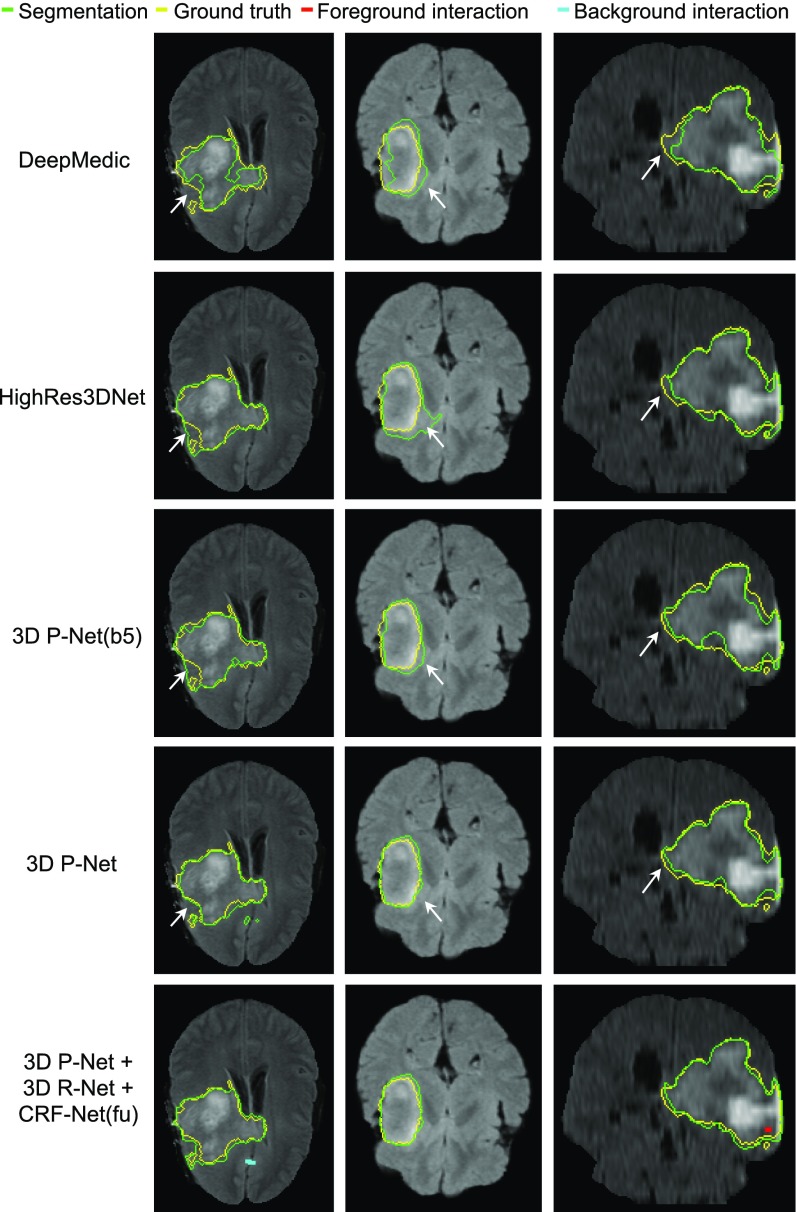
“DeepMedic achieves an average dice score of 83.87 percent.”
§ DeepIGeoS: A Deep Interactive Geodesic Framework for Medical Image Segmentation > Experiments > 3D Brain Tumor Segmentation from FLAIR Images
plain- Asserted: passes — The authors put it forward as true.
- Checkable: passes — It can be checked against evidence.
- Load-bearing: unclear — It is unclear whether the paper’s conclusions depend on it.
- Based: passes — The paper gives a reason why it holds.
A result the paper reports from its own data — it cites no other source for it, so there is none to check. The quote shows it is in the paper.
In the paper
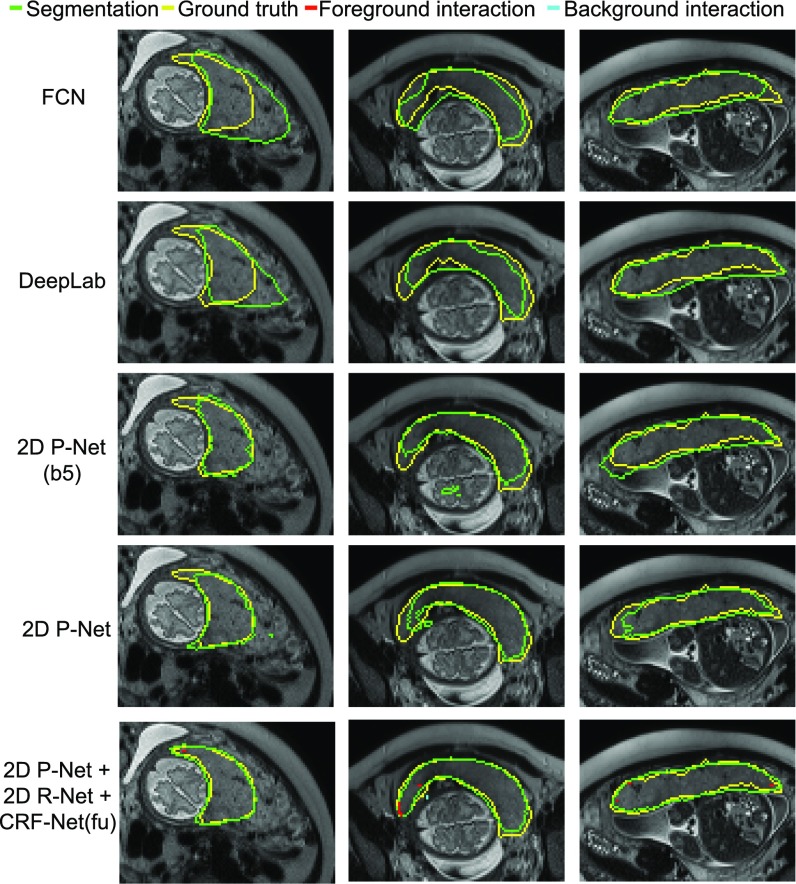
“the combination of the proposed 2D R-Net using geodesic distance and CRF-Net(fu) leads to more accurate segmentations than the other refinement methods with the same set of user interactions.”
§ DeepIGeoS: A Deep Interactive Geodesic Framework for Medical Image Segmentation > Experiments > 2D Placenta Segmentation from Fetal MRI
plaindirectSingle case- Asserted: passes — The authors put it forward as true.
- Checkable: passes — It can be checked against evidence.
- Load-bearing: passes — The paper’s conclusions depend on it.
- Based: passes — The paper gives a reason why it holds.
- Rests on an assumption: Simulated user interactions (random clicks in mis-segmented regions) are representative of real user interactions for training R-Net.
- Rests on an assumption: The manually delineated ground truth is accurate.
A result the paper reports from its own data — it cites no other source for it, so there is none to check. The quote shows it is in the paper.
In the paper
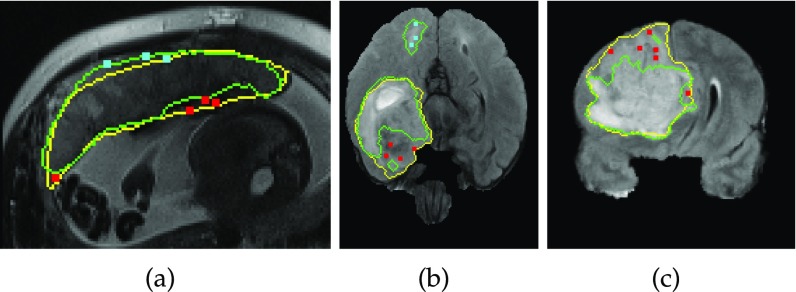
“Fig. 7 and Table 1 indicate that large mis-segmentation exists in some images”
§ DeepIGeoS: A Deep Interactive Geodesic Framework for Medical Image Segmentation > Experiments > 2D Placenta Segmentation from Fetal MRI
hedged- Asserted: passes — The authors put it forward as true.
- Checkable: passes — It can be checked against evidence.
- Load-bearing: passes — The paper’s conclusions depend on it.
- Based: passes — The paper gives a reason why it holds.
- Rests on an assumption: The manually delineated ground truth is accurate.
A result the paper reports from its own data — it cites no other source for it, so there is none to check. The quote shows it is in the paper.
In the paper
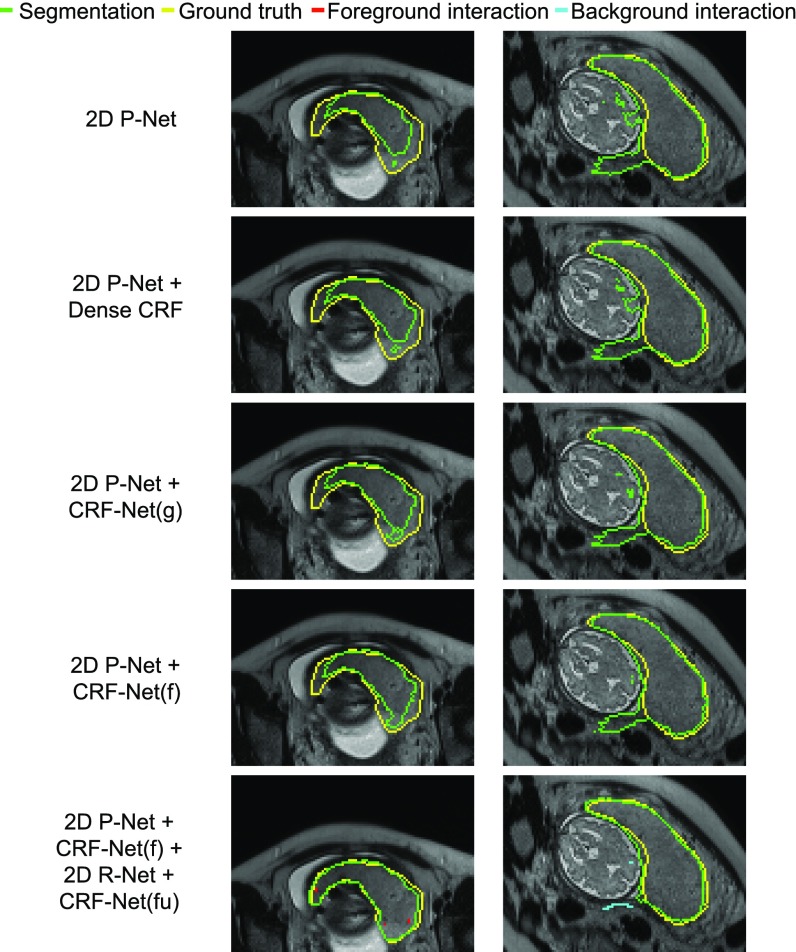
“while the last two CRFs significantly improve the segmentation”
§ DeepIGeoS: A Deep Interactive Geodesic Framework for Medical Image Segmentation > Experiments > 2D Placenta Segmentation from Fetal MRI
plaindirect- Asserted: passes — The authors put it forward as true.
- Checkable: passes — It can be checked against evidence.
- Load-bearing: passes — The paper’s conclusions depend on it.
- Based: passes — The paper gives a reason why it holds.
- Rests on an assumption: The manually delineated ground truth is accurate.
A result the paper reports from its own data — it cites no other source for it, so there is none to check. The quote shows it is in the paper.
In the paper
“2.14”
§ DeepIGeoS: A Deep Interactive Geodesic Framework for Medical Image Segmentation > Experiments > 3D Brain Tumor Segmentation from FLAIR Images
plain- Asserted: passes — The authors put it forward as true.
- Checkable: passes — It can be checked against evidence.
- Load-bearing: unclear — It is unclear whether the paper’s conclusions depend on it.
- Based: passes — The paper gives a reason why it holds.
- It may state two separate claims as one. 31
- The quote only partly states this claim. 6
- Probably not a substantial claim. 26
- Borderline: one of the tests for a substantial claim is unclear. 1
A result the paper reports from its own data — it cites no other source for it, so there is none to check. The quote shows it is in the paper.
In the paper
“obtains comparable and even higher accuracy with fewer user interventions and less time compared with traditional interactive methods.”
§ DeepIGeoS: A Deep Interactive Geodesic Framework for Medical Image Segmentation > Abstract
plaindirect- Asserted: passes — The authors put it forward as true.
- Checkable: passes — It can be checked against evidence.
- Load-bearing: passes — The paper’s conclusions depend on it.
- Based: passes — The paper gives a reason why it holds.
It may state two separate claims as one.
A result the paper reports from its own data — it cites no other source for it, so there is none to check. The quote shows it is in the paper.
In the paper
“HighRes3DNet and 3D P-Net(b5) achieve similar performance, and they are better than DeepMedic.”
§ DeepIGeoS: A Deep Interactive Geodesic Framework for Medical Image Segmentation > Experiments > 3D Brain Tumor Segmentation from FLAIR Images
plain- Asserted: passes — The authors put it forward as true.
- Checkable: passes — It can be checked against evidence.
- Load-bearing: unclear — It is unclear whether the paper’s conclusions depend on it.
- Based: passes — The paper gives a reason why it holds.
It may state two separate claims as one.
A result the paper reports from its own data — it cites no other source for it, so there is none to check. The quote shows it is in the paper.
In the paper
“DeepIGeoS requires far fewer user interactions and less user time.”
§ DeepIGeoS: A Deep Interactive Geodesic Framework for Medical Image Segmentation > Experiments > 2D Placenta Segmentation from Fetal MRI
plaindirect- Asserted: passes — The authors put it forward as true.
- Checkable: passes — It can be checked against evidence.
- Load-bearing: passes — The paper’s conclusions depend on it.
- Based: passes — The paper gives a reason why it holds.
It may state two separate claims as one.
The paper states this without a source or data behind it here, so there is nothing to check it against. The quote shows it is in the paper.
In the paper
“In addition, CRF-Net(f) is better than CRF-Net(g).”
§ DeepIGeoS: A Deep Interactive Geodesic Framework for Medical Image Segmentation > Experiments > 2D Placenta Segmentation from Fetal MRI
plaindirect- Asserted: passes — The authors put it forward as true.
- Checkable: passes — It can be checked against evidence.
- Load-bearing: unclear — It is unclear whether the paper’s conclusions depend on it.
- Based: passes — The paper gives a reason why it holds.
The quote only partly states this claim.
- Rests on an assumption: The manually delineated ground truth is accurate.
The paper states this without a source or data behind it here, so there is nothing to check it against. The quote shows it is in the paper.
In the paper
“the proposed 3D P-Net has far fewer parameters compared with HighRes3DNet.”
§ DeepIGeoS: A Deep Interactive Geodesic Framework for Medical Image Segmentation > Experiments > 3D Brain Tumor Segmentation from FLAIR Images
plain- Asserted: passes — The authors put it forward as true.
- Checkable: passes — It can be checked against evidence.
- Load-bearing: passes — The paper’s conclusions depend on it.
- Based: fails — The paper may give no reason why it holds.
Probably not a substantial claim. The paper may give no reason why it holds.
A result the paper reports from its own data — it cites no other source for it, so there is none to check. The quote shows it is in the paper.
In the paper
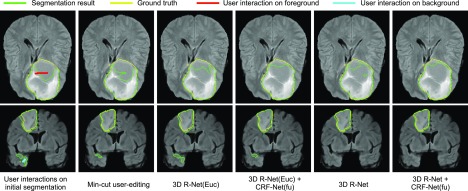
“DeepIGeoS only needs two short strokes to get an accurate segmentation, while the other methods require far more scribbles to get similar results.”
§ DeepIGeoS: A Deep Interactive Geodesic Framework for Medical Image Segmentation > Experiments > 2D Placenta Segmentation from Fetal MRI
plaindirect- Asserted: passes — The authors put it forward as true.
- Checkable: passes — It can be checked against evidence.
- Load-bearing: passes — The paper’s conclusions depend on it.
- Based: passes — The paper gives a reason why it holds.
It may state two separate claims as one.
A result the paper reports from its own data — it cites no other source for it, so there is none to check. The quote shows it is in the paper.
In the paper
“Significant improvement from 2D R-Net”
§ DeepIGeoS: A Deep Interactive Geodesic Framework for Medical Image Segmentation > Experiments > 2D Placenta Segmentation from Fetal MRI
plaindirect- Asserted: passes — The authors put it forward as true.
- Checkable: passes — It can be checked against evidence.
- Load-bearing: passes — The paper’s conclusions depend on it.
- Based: passes — The paper gives a reason why it holds.
The quote only partly states this claim.
A result the paper reports from its own data — it cites no other source for it, so there is none to check. The quote shows it is in the paper.
In the paper
“3D P-Net outperforms these three counterparts with 86.68”
§ DeepIGeoS: A Deep Interactive Geodesic Framework for Medical Image Segmentation > Experiments > 3D Brain Tumor Segmentation from FLAIR Images
plain- Asserted: passes — The authors put it forward as true.
- Checkable: passes — It can be checked against evidence.
- Load-bearing: unclear — It is unclear whether the paper’s conclusions depend on it.
- Based: passes — The paper gives a reason why it holds.
The quote only partly states this claim.
A result the paper reports from its own data — it cites no other source for it, so there is none to check. The quote shows it is in the paper.
In the paper
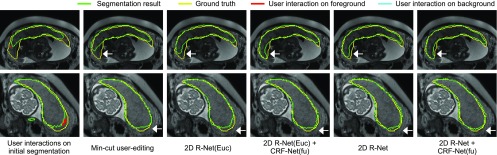
“Fig. 8 shows 2D R-Net with geodesic distance performs better than min-cut user-editing and 2D R-Net(Euc) that uses euclidean distance.”
§ DeepIGeoS: A Deep Interactive Geodesic Framework for Medical Image Segmentation > Experiments > 2D Placenta Segmentation from Fetal MRI
plaindirect- Asserted: passes — The authors put it forward as true.
- Checkable: passes — It can be checked against evidence.
- Load-bearing: passes — The paper’s conclusions depend on it.
- Based: passes — The paper gives a reason why it holds.
It may state two separate claims as one.
- Rests on an assumption: Simulated user interactions (random clicks in mis-segmented regions) are representative of real user interactions for training R-Net.
- Rests on an assumption: The manually delineated ground truth is accurate.
A result the paper reports from its own data — it cites no other source for it, so there is none to check. The quote shows it is in the paper.
In the paper
“our proposed method achieves better results than automatic CNNs.”
§ DeepIGeoS: A Deep Interactive Geodesic Framework for Medical Image Segmentation > Conclusion
plaindirect- Asserted: passes — The authors put it forward as true.
- Checkable: passes — It can be checked against evidence.
- Load-bearing: passes — The paper’s conclusions depend on it.
- Based: passes — The paper gives a reason why it holds.
It may state two separate claims as one.
A result the paper reports from its own data — it cites no other source for it, so there is none to check. The quote shows it is in the paper.
In the paper
“Significant improvement from 3D R-Net”
§ DeepIGeoS: A Deep Interactive Geodesic Framework for Medical Image Segmentation > Experiments > 3D Brain Tumor Segmentation from FLAIR Images
plaindirect- Asserted: passes — The authors put it forward as true.
- Checkable: passes — It can be checked against evidence.
- Load-bearing: passes — The paper’s conclusions depend on it.
- Based: passes — The paper gives a reason why it holds.
The quote only partly states this claim.
A result the paper reports from its own data — it cites no other source for it, so there is none to check. The quote shows it is in the paper.
In the paper
“ASSD of 1.43”
§ DeepIGeoS: A Deep Interactive Geodesic Framework for Medical Image Segmentation > Experiments > 3D Brain Tumor Segmentation from FLAIR Images
plain- Asserted: passes — The authors put it forward as true.
- Checkable: passes — It can be checked against evidence.
- Load-bearing: passes — The paper’s conclusions depend on it.
- Based: passes — The paper gives a reason why it holds.
The quote only partly states this claim.
The paper states this without a source or data behind it here, so there is nothing to check it against. The quote shows it is in the paper.
In the paper
“It requires far less user time compared with traditional interactive methods”
§ DeepIGeoS: A Deep Interactive Geodesic Framework for Medical Image Segmentation > Conclusion
plaindirect- Asserted: passes — The authors put it forward as true.
- Checkable: passes — It can be checked against evidence.
- Load-bearing: passes — The paper’s conclusions depend on it.
- Based: unclear — It is unclear why the paper says it holds.
Borderline substantial claim. It is unclear why the paper says it holds.
A result the paper reports from its own data — it cites no other source for it, so there is none to check. The quote shows it is in the paper.
In the paper
“Dice score of 89.93”
§ DeepIGeoS: A Deep Interactive Geodesic Framework for Medical Image Segmentation > Experiments > 3D Brain Tumor Segmentation from FLAIR Images
plain- Asserted: passes — The authors put it forward as true.
- Checkable: passes — It can be checked against evidence.
- Load-bearing: passes — The paper’s conclusions depend on it.
- Based: passes — The paper gives a reason why it holds.
The quote only partly states this claim.
The paper states this without a source or data behind it here, so there is nothing to check it against. The quote shows it is in the paper.
In the paper
“However, the euclidean distance does not take advantage of image context information.”
- Also stated in: § User Interaction-Based Geodesic Distance Maps · plain
“However, the euclidean distance treats each direction equally and does not take the image context into account.”
§ DeepIGeoS: A Deep Interactive Geodesic Framework for Medical Image Segmentation > Related Works > Interactive Image Segmentation
plain- Asserted: passes — The authors put it forward as true.
- Checkable: passes — It can be checked against evidence.
- Load-bearing: passes — The paper’s conclusions depend on it.
- Based: passes — The paper gives a reason why it holds.
It may state two separate claims as one.
- Also stated in: § User Interaction-Based Geodesic Distance Maps · plain
In the paper
“In [40], a deep interactive object selection method was proposed where user-provided clicks are transformed into euclidean distance maps and then concatenated with the input of FCNs.”
§ DeepIGeoS: A Deep Interactive Geodesic Framework for Medical Image Segmentation > Related Works > Interactive Image Segmentation
What the sources say
- Not checked yetcites [40] Xu N., Price B., Cohen S., Yang J., and Huang T., “ Deep interactive object selection,” in Proc. IEEE Conf. Comput. Vis. Pattern Recognit., 2016, pp. 373– 381. source
plaindirect- Asserted: passes — The authors put it forward as true.
- Checkable: passes — It can be checked against evidence.
- Load-bearing: passes — The paper’s conclusions depend on it.
- Based: passes — The paper gives a reason why it holds.
Probably not a substantial claim.
A conclusion the paper draws from its own results — it cites no other source for it, so there is none to check. The quote shows it is in the paper.
In the paper
“Third, it is efficient and can respond to user interactions in real time, which leads to very short user time.”
§ DeepIGeoS: A Deep Interactive Geodesic Framework for Medical Image Segmentation > Introduction
plaindirect- Asserted: passes — The authors put it forward as true.
- Checkable: passes — It can be checked against evidence.
- Load-bearing: passes — The paper’s conclusions depend on it.
- Based: unclear — It is unclear why the paper says it holds.
It may state two separate claims as one.
In the paper
“DeepCut [32] employs user-provided bounding boxes as annotations to train CNNs for the segmentation of fetal MRI.”
§ DeepIGeoS: A Deep Interactive Geodesic Framework for Medical Image Segmentation > Related Works > Interactive Image Segmentation
What the sources say
- Not checked yetcites [32] Rajchl M., Lee M., Oktay O., Kamnitsas K., Passerat-Palmbach J., Bai W., Rutherford M., Hajnal J., Kainz B., and Rueckert D., “ DeepCut: Object segmentation from bounding box annotations using convolutional neural networks,” IEEE Trans. Medical Imaging, vol. 36, no. 2, pp. 674– 683, Feb. 2017. 27845654 PMC7115996 source
plaindirect- Asserted: passes — The authors put it forward as true.
- Checkable: passes — It can be checked against evidence.
- Load-bearing: fails — The paper’s conclusions may not depend on it.
- Based: passes — The paper gives a reason why it holds.
Probably not a substantial claim. The paper’s conclusions may not depend on it.
In the paper
“Recently, deep learning with convolutional neural networks (CNNs) has achieved the state-of-the-art performance in many image analysis applications [10].”
§ DeepIGeoS: A Deep Interactive Geodesic Framework for Medical Image Segmentation > Introduction
What the sources say
- Not checked yetcites [10] Litjens G., Kooi T., Bejnordi B. E., Setio A. A. A., Ciompi F., Ghafoorian M., van der Laak J. A., Ginneken B. V., and Sánchez C. I., “ A survey on deep learning in medical image analysis,” Med. Image Anal., vol. 42, pp. 60– 88, 2017. 28778026 source
plain- Asserted: passes — The authors put it forward as true.
- Checkable: passes — It can be checked against evidence.
- Load-bearing: fails — The paper’s conclusions may not depend on it.
- Based: passes — The paper gives a reason why it holds.
Probably not a substantial claim. The paper’s conclusions may not depend on it.
In the paper
“SlicSeg [6] accepts user-provided scribbles in a single start slice to train an Online Random Forest for 3D segmentation, but lacks in flexibility to allow further user-editing.”
§ DeepIGeoS: A Deep Interactive Geodesic Framework for Medical Image Segmentation > Introduction
What the sources say
- Not checked yetcites [6] Wang G., Zuluaga M. A., Pratt R., Aertsen M., Doel T., Klusmann M., David A. L., Deprest J., Vercauteren T., and Ourselin S., “ Slic-Seg: A minimally interactive segmentation of the placenta from sparse and motion-corrupted fetal MRI in multiple views,” Med. Image Anal., vol. 34, pp. 137– 147, 2016. 27179367 PMC5052128 source
plain- Asserted: passes — The authors put it forward as true.
- Checkable: passes — It can be checked against evidence.
- Load-bearing: passes — The paper’s conclusions depend on it.
- Based: passes — The paper gives a reason why it holds.
It may state two separate claims as one.
In the paper
“For example, the widely used ITK-SNAP [5] takes user-provided seed pixels or blobs as a starting point and employs an active contour model for segmentation. It requires most of the user interactions to be given at the beginning and the underpinning model can hardly be refined with additional user interactions once an initial segmentation is obtained.”
§ DeepIGeoS: A Deep Interactive Geodesic Framework for Medical Image Segmentation > Introduction
What the sources say
- Not checked yetcites [5] Yushkevich P. A., Piven J., Hazlett H. C., Smith R. G., Ho S., Gee J. C., and Gerig G., “ User-guided 3D active contour segmentation of anatomical structures: Significantly improved efficiency and reliability,” NeuroImage, vol. 31, no. 3, pp. 1116– 1128, 2006. 16545965 source
plaindirect- Asserted: passes — The authors put it forward as true.
- Checkable: passes — It can be checked against evidence.
- Load-bearing: passes — The paper’s conclusions depend on it.
- Based: passes — The paper gives a reason why it holds.
It may state two separate claims as one.
None of the sources cited for this claim have been checked yet.
In the paper
“Typical CNNs [16], [17], [18] were originally designed for image classification tasks.”
§ DeepIGeoS: A Deep Interactive Geodesic Framework for Medical Image Segmentation > Related Works > Image Segmentation Based on CNNs
What the sources say
- Not checked yetcites [16] Krizhevsky A., Sutskever I., and Hinton G. E., “ ImageNet classification with deep convolutional neural networks,” in Proc. 25th Int. Conf. Neural Inf. Process. Syst., 2012, pp. 1097– 1105.
- Not checked yetcites [17] Simonyan K. and Zisserman A., “ Very deep convolutional networks for large-scale image recognition,” arXiv preprint arXiv:1409.1556. source
- Not checked yetcites [18] He K., Zhang X., Ren S., and Sun J., “ Deep residual learning for image recognition,” in Proc. IEEE Conf. Comput. Vis. Pattern Recognit., 2016, pp. 770– 778. source
plain- Asserted: passes — The authors put it forward as true.
- Checkable: passes — It can be checked against evidence.
- Load-bearing: fails — The paper’s conclusions may not depend on it.
- Based: passes — The paper gives a reason why it holds.
Probably not a substantial claim. The paper’s conclusions may not depend on it.
None of the sources cited for this claim have been checked yet.
In the paper
“Machine learning methods [6], [37], [38] have been proposed to learn from user interactions. They can achieve higher segmentation accuracy with fewer user interactions. However, they are limited by hand-crafted features that depend on the user's experience.”
§ DeepIGeoS: A Deep Interactive Geodesic Framework for Medical Image Segmentation > Related Works > Interactive Image Segmentation
What the sources say
- Not checked yetcites [6] Wang G., Zuluaga M. A., Pratt R., Aertsen M., Doel T., Klusmann M., David A. L., Deprest J., Vercauteren T., and Ourselin S., “ Slic-Seg: A minimally interactive segmentation of the placenta from sparse and motion-corrupted fetal MRI in multiple views,” Med. Image Anal., vol. 34, pp. 137– 147, 2016. 27179367 PMC5052128 source
- Not checked yetcites [37] Barinova O., Shapovalov R., Sudakov S., and Velizhev A., “ Online random forest for interactive image segmentation,” in Proc. Int. Workshop Exp. Economics Mach. Learn., 2012, pp. 1– 8.
- Not checked yetcites [38] Luengo I., Darrow M. C., Spink M. C., Sun Y., Dai W., He C. Y., Chiu W., Pridmore T., Ashton A. W., Duke E. M., Basham M., and French A. P., “ SuRVoS: Super-region volume segmentation workbench,” J. Structural Biol., vol. 198, no. 1, pp. 43– 53, 2017. PMC5405849 28246039 source
plaindirect- Asserted: passes — The authors put it forward as true.
- Checkable: passes — It can be checked against evidence.
- Load-bearing: passes — The paper’s conclusions depend on it.
- Based: passes — The paper gives a reason why it holds.
It may state two separate claims as one.
None of the sources cited for this claim have been checked yet.
In the paper
“Some early works adapted such networks for pixel labeling with patch or region-based methods [19], [20]. Such methods achieved higher accuracy than traditional methods that relied on hand-crafted features. However, they suffered from inefficiency for testing.”
§ DeepIGeoS: A Deep Interactive Geodesic Framework for Medical Image Segmentation > Related Works > Image Segmentation Based on CNNs
What the sources say
- Not checked yetcites [19] Havaei M., Davy A., Warde-Farley D., Biard A., Courville A., Bengio Y., Pal C., Jodoin P.-M., and Larochelle H., “ Brain tumor segmentation with deep neural networks,” Med. Image Anal., vol. 35, pp. 18– 31, 2016. 27310171 source
- Not checked yetcites [20] Girshick R., Donahue J., Darrell T., and Malik J., “ Rich feature hierarchies for accurate object detection and semantic segmentation,” in Proc. IEEE Conf. Comput. Vis. Pattern Recognit., 2014, pp. 580– 587. source
plaindirect- Asserted: passes — The authors put it forward as true.
- Checkable: passes — It can be checked against evidence.
- Load-bearing: fails — The paper’s conclusions may not depend on it.
- Based: passes — The paper gives a reason why it holds.
Probably not a substantial claim. The paper’s conclusions may not depend on it. It may state two separate claims as one.
None of the sources cited for this claim have been checked yet.
In the paper
“GrabCut [9] works with a user-provided bounding box to start the segmentation and requires fewer interactions compared with Graph Cuts [8], but the performance is still limited by the representativity of the underpinning GMM.”
§ DeepIGeoS: A Deep Interactive Geodesic Framework for Medical Image Segmentation > Introduction
What the sources say
- Not checked yetcites [9] Rother C., Kolmogorov V., and Blake A., “ GrabCut: Interactive foreground extraction using iterated graph cuts,” ACM Trans. Graph., vol. 23, no. 3, pp. 309– 314, 2004. source
- Not checked yetcites [8] Boykov Y. Y. and Jolly M. P., “ Interactive graph cuts for optimal boundary & region segmentation of objects in N-D images,” in Proc. 8th IEEE Int. Conf. Comput. Vis., 2001, pp. 105– 112. source
plaindirect- Asserted: passes — The authors put it forward as true.
- Checkable: passes — It can be checked against evidence.
- Load-bearing: passes — The paper’s conclusions depend on it.
- Based: passes — The paper gives a reason why it holds.
It may state two separate claims as one.
In the paper
“ScribbleSup [39] also trains CNNs for semantic segmentation supervised by scribbles.”
§ DeepIGeoS: A Deep Interactive Geodesic Framework for Medical Image Segmentation > Related Works > Interactive Image Segmentation
What the sources say
- Not checked yetcites [39] Lin D., Dai J., Jia J., He K., and Sun J., “ ScribbleSup: Scribble-supervised convolutional networks for semantic segmentation,” in Proc. IEEE Conf. Comput. Vis. Pattern Recognit., 2016, pp. 3159– 3167. source
plaindirect- Asserted: passes — The authors put it forward as true.
- Checkable: passes — It can be checked against evidence.
- Load-bearing: fails — The paper’s conclusions may not depend on it.
- Based: passes — The paper gives a reason why it holds.
Probably not a substantial claim. The paper’s conclusions may not depend on it.
In the paper
“FCNs [11] take an entire image as input and give a dense segmentation. In order to overcome the problem of loss of spatial resolution due to multi-stage max-pooling and downsampling, it uses a stack of deconvolution (a.k.a. upsampling) layers and activation functions to upsample the feature maps.”
§ DeepIGeoS: A Deep Interactive Geodesic Framework for Medical Image Segmentation > Related Works > Image Segmentation Based on CNNs
What the sources say
- Not checked yetcites [11] Long J., Shelhamer E., and Darrell T., “ Fully convolutional networks for semantic segmentation,” in Proc. IEEE Conf. Comput. Vis. Pattern Recognit., 2015, pp. 3431– 3440. 27244717
plaindirect- Asserted: passes — The authors put it forward as true.
- Checkable: passes — It can be checked against evidence.
- Load-bearing: fails — The paper’s conclusions may not depend on it.
- Based: passes — The paper gives a reason why it holds.
Probably not a substantial claim. The paper’s conclusions may not depend on it. It may state two separate claims as one.
The paper states this without a source or data behind it here, so there is nothing to check it against. The quote shows it is in the paper.
In the paper
“However, they have not yet been adapted to interactive medical image segmentation.”
§ DeepIGeoS: A Deep Interactive Geodesic Framework for Medical Image Segmentation > Introduction
plain- Asserted: passes — The authors put it forward as true.
- Checkable: passes — It can be checked against evidence.
- Load-bearing: passes — The paper’s conclusions depend on it.
- Based: fails — The paper may give no reason why it holds.
Probably not a substantial claim. The paper may give no reason why it holds.
None of the sources cited for this claim have been checked yet.
In the paper
“To overcome the drawbacks of successive max-pooling and downsampling that lead to a loss of feature map resolution, dilated convolution [22], [23] was proposed to preserve the resolution of feature maps and enlarge the receptive field to incorporate larger contextual information.”
§ DeepIGeoS: A Deep Interactive Geodesic Framework for Medical Image Segmentation > Related Works > Image Segmentation Based on CNNs
What the sources say
- Not checked yetcites [22] Chen L.-C., Papandreou G., Kokkinos I., Murphy K., and Yuille A. L., “ Semantic image segmentation with deep convolutional nets and fully connected CRFs,” arXiv preprint arXiv:1412.7062. 28463186 source
- Not checked yetcites [23] Yu F. and Koltun V., “ Multi-scale context aggregation by dilated convolutions,” arXiv preprint arXiv:1511.07122. source
plaindirect- Asserted: passes — The authors put it forward as true.
- Checkable: passes — It can be checked against evidence.
- Load-bearing: fails — The paper’s conclusions may not depend on it.
- Based: passes — The paper gives a reason why it holds.
Probably not a substantial claim. The paper’s conclusions may not depend on it. It may state two separate claims as one.
None of the sources cited for this claim have been checked yet.
In the paper
“Multi-scale features extracted from CNNs have been shown to be effective for improving segmentation accuracy [11], [22], [23].”
§ DeepIGeoS: A Deep Interactive Geodesic Framework for Medical Image Segmentation > Related Works > Image Segmentation Based on CNNs
What the sources say
- Not checked yetcites [11] Long J., Shelhamer E., and Darrell T., “ Fully convolutional networks for semantic segmentation,” in Proc. IEEE Conf. Comput. Vis. Pattern Recognit., 2015, pp. 3431– 3440. 27244717 source
- Not checked yetcites [22] Chen L.-C., Papandreou G., Kokkinos I., Murphy K., and Yuille A. L., “ Semantic image segmentation with deep convolutional nets and fully connected CRFs,” arXiv preprint arXiv:1412.7062. 28463186 source
- Not checked yetcites [23] Yu F. and Koltun V., “ Multi-scale context aggregation by dilated convolutions,” arXiv preprint arXiv:1511.07122. source
boosteddirect- Asserted: passes — The authors put it forward as true.
- Checkable: passes — It can be checked against evidence.
- Load-bearing: fails — The paper’s conclusions may not depend on it.
- Based: passes — The paper gives a reason why it holds.
Probably not a substantial claim. The paper’s conclusions may not depend on it.
None of the sources cited for this claim have been checked yet.
In the paper
“the geodesic distance transform [35], [36], [41] encodes spatial regularization and contrast-sensitivity”
§ DeepIGeoS: A Deep Interactive Geodesic Framework for Medical Image Segmentation > Related Works > Interactive Image Segmentation
What the sources say
- Not checked yetcites [35] Bai X. and Sapiro G., “ A geodesic framework for fast interactive image and video segmentation and matting,” in Proc. IEEE 11th Int. Conf. Comput. Vis., 2007, pp. 1– 8. source
- Not checked yetcites [36] Criminisi A., Sharp T., and Blake A., “ GeoS: Geodesic image segmentation,” in Proc. Eur. Conf. Comput. Vis., 2008, pp. 99– 112. source
- Not checked yetcites [41] Kontschieder P., Kohli P., Shotton J., and Criminisi A., “ GeoF geodesic forests for learning coupled predictors,” in Proc. IEEE Conf. Comput. Vis. Pattern Recognit., 2013, pp. 65– 72. source
plaindirect- Asserted: passes — The authors put it forward as true.
- Checkable: passes — It can be checked against evidence.
- Load-bearing: passes — The paper’s conclusions depend on it.
- Based: passes — The paper gives a reason why it holds.
It may state two separate claims as one.
None of the sources cited for this claim have been checked yet.
In the paper
“However, most of these methods rely on low-level features and require a relatively large amount of user interactions to deal with images with low contrast and ambiguous boundaries.”
§ DeepIGeoS: A Deep Interactive Geodesic Framework for Medical Image Segmentation > Related Works > Interactive Image Segmentation
What the sources say
- Not checked yetcites [8] Boykov Y. Y. and Jolly M. P., “ Interactive graph cuts for optimal boundary & region segmentation of objects in N-D images,” in Proc. 8th IEEE Int. Conf. Comput. Vis., 2001, pp. 105– 112. source
- Not checked yetcites [35] Bai X. and Sapiro G., “ A geodesic framework for fast interactive image and video segmentation and matting,” in Proc. IEEE 11th Int. Conf. Comput. Vis., 2007, pp. 1– 8. source
- Not checked yetcites [7] Grady L., “ Random walks for image segmentation,” IEEE Trans. Pattern Anal. Mach. Intell., vol. 28, no. 11, pp. 1768– 1783, Nov. 2006. 17063682 source
plaindirect- Asserted: passes — The authors put it forward as true.
- Checkable: passes — It can be checked against evidence.
- Load-bearing: passes — The paper’s conclusions depend on it.
- Based: passes — The paper gives a reason why it holds.
It may state two separate claims as one.
None of the sources cited for this claim have been checked yet.
In the paper
“Random Walks [7] and Graph Cuts [8] learn from scribbles and allow the user to provide additional scribbles for refinement. They use Random Walker and Gaussian Mixture Model (GMM) as the underpinning model. However, they need a large number of scribbles to get satisfactory segmentation.”
§ DeepIGeoS: A Deep Interactive Geodesic Framework for Medical Image Segmentation > Introduction
What the sources say
- Not checked yetcites [7] Grady L., “ Random walks for image segmentation,” IEEE Trans. Pattern Anal. Mach. Intell., vol. 28, no. 11, pp. 1768– 1783, Nov. 2006. 17063682 source
- Not checked yetcites [8] Boykov Y. Y. and Jolly M. P., “ Interactive graph cuts for optimal boundary & region segmentation of objects in N-D images,” in Proc. 8th IEEE Int. Conf. Comput. Vis., 2001, pp. 105– 112. source
plaindirect- Asserted: passes — The authors put it forward as true.
- Checkable: passes — It can be checked against evidence.
- Load-bearing: passes — The paper’s conclusions depend on it.
- Based: passes — The paper gives a reason why it holds.
It may state two separate claims as one.
None of the sources cited for this claim have been checked yet.
In the paper
“Graphical models such as CRFs [22], [42], [43] have been widely used to enhance segmentation accuracy by introducing spatial consistency.”
§ DeepIGeoS: A Deep Interactive Geodesic Framework for Medical Image Segmentation > Related Works > CRFs for Spatial Regularization
What the sources say
- Not checked yetcites [22] Chen L.-C., Papandreou G., Kokkinos I., Murphy K., and Yuille A. L., “ Semantic image segmentation with deep convolutional nets and fully connected CRFs,” arXiv preprint arXiv:1412.7062. 28463186 source
- Not checked yetcites [42] Boykov Y. and Kolmogorov V., “ An experimental comparison of min-cut/max-flow algorithms for energy minimization in vision,” IEEE Trans. Pattern Anal. Mach. Intell., vol. 26, no. 9, pp. 1124– 1137, Sep. 2004. 15742889 source
- Not checked yetcites [43] Yuan J., Bae E., and Tai X. C., “ A study on continuous max-flow and min-cut approaches,” in Proc. IEEE Comput. Society Conf. Comput. Vis. Pattern Recognit., 2010, pp. 2217– 2224. source
boosteddirect- Asserted: passes — The authors put it forward as true.
- Checkable: passes — It can be checked against evidence.
- Load-bearing: fails — The paper’s conclusions may not depend on it.
- Based: passes — The paper gives a reason why it holds.
Probably not a substantial claim. The paper’s conclusions may not depend on it.
In the paper
“Despite the large number of existing interactive segmentation methods [3], most of them are confronted by requiring a large amount of user interactions and long user time, or limited learning ability with their underpinning models.”
§ DeepIGeoS: A Deep Interactive Geodesic Framework for Medical Image Segmentation > Introduction
What the sources say
- Not checked yetcites [3] Zhao F. and Xie X., “ An overview of interactive medical image segmentation,” Ann. BMVA, vol. 2013, no. 7, pp. 1– 22, 2013.
plain- Asserted: passes — The authors put it forward as true.
- Checkable: passes — It can be checked against evidence.
- Load-bearing: passes — The paper’s conclusions depend on it.
- Based: passes — The paper gives a reason why it holds.
It may state two separate claims as one.
In the paper
“For instance, 3D U-Net [21] learns from sparsely annotated images and can be used for semi-automatic segmentation.”
§ DeepIGeoS: A Deep Interactive Geodesic Framework for Medical Image Segmentation > Related Works > Interactive Image Segmentation
What the sources say
- Not checked yetcites [21] Abdulkadir A., Lienkamp S. S., Brox T., and Ronneberger O., “ 3D U-Net: Learning dense volumetric segmentation from sparse annotation,” in Proc. Medical Image Comput. Comput.-Assisted Intervention, 2016, pp. 424– 432. source
plaindirect- Asserted: passes — The authors put it forward as true.
- Checkable: passes — It can be checked against evidence.
- Load-bearing: fails — The paper’s conclusions may not depend on it.
- Based: passes — The paper gives a reason why it holds.
Probably not a substantial claim. The paper’s conclusions may not depend on it. It may state two separate claims as one.
None of the sources cited for this claim have been checked yet.
In the paper
“Alternatively, mean-field approximation [45], [50], [52] is often used for efficient inference of the CRF while allowing learning parameters by back-propagation.”
§ DeepIGeoS: A Deep Interactive Geodesic Framework for Medical Image Segmentation > Method > Back-Propagatable CRF-Net with Freeform Pairwise Potentials and User Constraints
What the sources say
- Not checked yetcites [45] Krähenbühl P. and Koltun V., “ Efficient inference in fully connected CRFs with gaussian edge potentials,” in Proc. Neural Inf. Process. Syst. Conf., 2011, pp. 109– 117. source
- Not checked yetcites [50] Zheng S., Jayasumana S., Romera-Paredes B., Vineet V., Su Z., Du D., Huang C., and Torr P. H. S., “ Conditional random fields as recurrent neural networks,” in Proc. IEEE Int. Conf. Comput. Vis., 2015, pp. 1529– 1537. source
- Not checked yetcites [52] Vemulapalli R., Tuzel O., Liu M.-y., and Chellappa R., “ Gaussian conditional random field network for semantic segmentation,” in Proc. IEEE Conf. Comput. Vis. Pattern Recognit., 2016, pp. 3224– 3233. source
plaindirect- Asserted: passes — The authors put it forward as true.
- Checkable: passes — It can be checked against evidence.
- Load-bearing: fails — The paper’s conclusions may not depend on it.
- Based: passes — The paper gives a reason why it holds.
Probably not a substantial claim. The paper’s conclusions may not depend on it.
What the paper did — it cites no source for this, so there is none to check. The quote shows it is in the paper.
In the paper
“in which the same initial segmentation and the same set of user interactions were used by the five refinement methods.”
§ DeepIGeoS: A Deep Interactive Geodesic Framework for Medical Image Segmentation > Experiments > 2D Placenta Segmentation from Fetal MRI
plain- Asserted: passes — The authors put it forward as true.
- Checkable: passes — It can be checked against evidence.
- Load-bearing: passes — The paper’s conclusions depend on it.
- Based: passes — The paper gives a reason why it holds.
Probably not a substantial claim.
In the paper
“In [52], a Gaussian Mean Field (GMF) network was proposed and combined with CNNs where all the parameters are trainable.”
§ DeepIGeoS: A Deep Interactive Geodesic Framework for Medical Image Segmentation > Related Works > CRFs for Spatial Regularization
What the sources say
- Not checked yetcites [52] Vemulapalli R., Tuzel O., Liu M.-y., and Chellappa R., “ Gaussian conditional random field network for semantic segmentation,” in Proc. IEEE Conf. Comput. Vis. Pattern Recognit., 2016, pp. 3224– 3233. source
plain- Asserted: passes — The authors put it forward as true.
- Checkable: passes — It can be checked against evidence.
- Load-bearing: fails — The paper’s conclusions may not depend on it.
- Based: passes — The paper gives a reason why it holds.
Probably not a substantial claim. The paper’s conclusions may not depend on it. It may state two separate claims as one.
In the paper
“In [54], a generic CNN-CRF model was proposed to handle arbitrary potentials for labeling body parts in depth images. However, it has not yet been validated with other segmentation applications.”
§ DeepIGeoS: A Deep Interactive Geodesic Framework for Medical Image Segmentation > Related Works > CRFs for Spatial Regularization
What the sources say
- Not checked yetcites [54] Kirillov A., Zheng S., Schlesinger D., Forkel W., Zelenin A., Torr P., and Rother C., “ Efficient likelihood learning of a generic CNN-CRF model for semantic segmentation,” arXiv preprint arXiv:1511.05067. source
plain- Asserted: passes — The authors put it forward as true.
- Checkable: passes — It can be checked against evidence.
- Load-bearing: fails — The paper’s conclusions may not depend on it.
- Based: passes — The paper gives a reason why it holds.
Probably not a substantial claim. The paper’s conclusions may not depend on it. It may state two separate claims as one.
In the paper
“GeoF [41] uses the geodesic distance to encode variable dependencies in the feature space and it is combined with Random Forests for semantic segmentation. However, it is not designed to deal with user interactions.”
§ DeepIGeoS: A Deep Interactive Geodesic Framework for Medical Image Segmentation > Method > User Interaction-Based Geodesic Distance Maps
What the sources say
- Not checked yetcites [41] Kontschieder P., Kohli P., Shotton J., and Criminisi A., “ GeoF geodesic forests for learning coupled predictors,” in Proc. IEEE Conf. Comput. Vis. Pattern Recognit., 2013, pp. 65– 72. source
plain- Asserted: passes — The authors put it forward as true.
- Checkable: passes — It can be checked against evidence.
- Load-bearing: passes — The paper’s conclusions depend on it.
- Based: passes — The paper gives a reason why it holds.
It may state two separate claims as one.
None of the sources cited for this claim have been checked yet.
In the paper
“More freeform pairwise potentials for a pair of super-pixels or image patches were proposed in [27], [53], but such CRFs have a low resolution.”
§ DeepIGeoS: A Deep Interactive Geodesic Framework for Medical Image Segmentation > Related Works > CRFs for Spatial Regularization
What the sources say
- Not checked yetcites [27] Lin G., Shen C., Reid I., and van dan Hengel A., “ Efficient piecewise training of deep structured models for semantic segmentation,” in Proc. IEEE Conf. Comput. Vis. Pattern Recognit., 2016, pp. 3194– 3203. source
- Not checked yetcites [53] Liu F., Shen C., and Lin G., “ Deep convolutional neural fields for depth estimation from a single image,” in Proc. IEEE Conf. Comput. Vis. Pattern Recognit., 2014, pp. 5162– 5170. source
plaincorrelational- Asserted: passes — The authors put it forward as true.
- Checkable: passes — It can be checked against evidence.
- Load-bearing: fails — The paper’s conclusions may not depend on it.
- Based: passes — The paper gives a reason why it holds.
Probably not a substantial claim. The paper’s conclusions may not depend on it. It may state two separate claims as one.
None of the sources cited for this claim have been checked yet.
In the paper
“However, the pair-wise potentials in [50] are limited to weighted Gaussians and not all the parameters are trainable due to the Permutohedral lattice implementation [51].”
§ DeepIGeoS: A Deep Interactive Geodesic Framework for Medical Image Segmentation > Related Works > CRFs for Spatial Regularization
What the sources say
- Not checked yetcites [50] Zheng S., Jayasumana S., Romera-Paredes B., Vineet V., Su Z., Du D., Huang C., and Torr P. H. S., “ Conditional random fields as recurrent neural networks,” in Proc. IEEE Int. Conf. Comput. Vis., 2015, pp. 1529– 1537. source
- Not checked yetcites [51] Adams A., Baek J., and Davis M. A., “ Fast high-dimensional filtering using the permutohedral lattice,” Comput. Graph. Forum, vol. 29, no. 2, pp. 753– 762, 2010. source
plaindirect- Asserted: passes — The authors put it forward as true.
- Checkable: passes — It can be checked against evidence.
- Load-bearing: fails — The paper’s conclusions may not depend on it.
- Based: passes — The paper gives a reason why it holds.
Probably not a substantial claim. The paper’s conclusions may not depend on it. It may state two separate claims as one.
What the paper did — it cites no source for this, so there is none to check. The quote shows it is in the paper.
In the paper
“The ground truth was manually delineated by an experienced Radiologist.”
§ DeepIGeoS: A Deep Interactive Geodesic Framework for Medical Image Segmentation > Experiments > 2D Placenta Segmentation from Fetal MRI
plain- Asserted: passes — The authors put it forward as true.
- Checkable: passes — It can be checked against evidence.
- Load-bearing: passes — The paper’s conclusions depend on it.
- Based: passes — The paper gives a reason why it holds.
Probably not a substantial claim.
In the paper
“The 2D segmentation results can also be used for motion correction and high-resolution volume reconstruction [63].”
§ DeepIGeoS: A Deep Interactive Geodesic Framework for Medical Image Segmentation > Experiments > 2D Placenta Segmentation from Fetal MRI
What the sources say
- Not checked yetcites [63] Keraudren K., Kuklisova-Murgasova M., Kyriakopoulou V., Malamateniou C., Rutherford M. A., Kainz B., Hajnal J. V., and Rueckert D., “ Automated fetal brain segmentation from 2D MRI slices for motion correction,” NeuroImage, vol. 101, pp. 633– 643, 2014. 25058899 source
plaindirect- Asserted: passes — The authors put it forward as true.
- Checkable: passes — It can be checked against evidence.
- Load-bearing: fails — The paper’s conclusions may not depend on it.
- Based: passes — The paper gives a reason why it holds.
Probably not a substantial claim. The paper’s conclusions may not depend on it. It may state two separate claims as one.
A conclusion the paper draws from its own results — it cites no other source for it, so there is none to check. The quote shows it is in the paper.
In the paper
“It is more memory efficient and therefore can perform inference on a 3D volume in interactive time.”
§ DeepIGeoS: A Deep Interactive Geodesic Framework for Medical Image Segmentation > Experiments > 3D Brain Tumor Segmentation from FLAIR Images
plaindirect- Asserted: passes — The authors put it forward as true.
- Checkable: passes — It can be checked against evidence.
- Load-bearing: passes — The paper’s conclusions depend on it.
- Based: passes — The paper gives a reason why it holds.
It may state two separate claims as one.
In the paper
“Differently from previous works [55] that re-train the learning model each time when new user interactions are given, the proposed R-Net is only trained with user interactions once since it takes a considerable time to re-train a CNN model with a large training set.”
§ DeepIGeoS: A Deep Interactive Geodesic Framework for Medical Image Segmentation > Method
What the sources say
- Not checked yetcites [55] Wang G., Zuluaga M. A., Pratt R., Aertsen M., Doel T., Klusmann M., David A. L., Deprest J., Vercauteren T., and Ourselin S., “ Dynamically balanced online random forests for interactive scribble-based segmentation,” in Proc. Medical Image Comput. Comput.-Assisted Intervention, 2016, pp. 352– 360. source
plaindirect- Asserted: passes — The authors put it forward as true.
- Checkable: passes — It can be checked against evidence.
- Load-bearing: passes — The paper’s conclusions depend on it.
- Based: passes — The paper gives a reason why it holds.
It may state two separate claims as one.
In the paper
“Continuous max-flow [43] can also be used for the minimization, but its parameters are manually designed.”
§ DeepIGeoS: A Deep Interactive Geodesic Framework for Medical Image Segmentation > Method > Back-Propagatable CRF-Net with Freeform Pairwise Potentials and User Constraints
What the sources say
- Not checked yetcites [43] Yuan J., Bae E., and Tai X. C., “ A study on continuous max-flow and min-cut approaches,” in Proc. IEEE Comput. Society Conf. Comput. Vis. Pattern Recognit., 2010, pp. 2217– 2224. source
plain- Asserted: passes — The authors put it forward as true.
- Checkable: passes — It can be checked against evidence.
- Load-bearing: unclear — It is unclear whether the paper’s conclusions depend on it.
- Based: passes — The paper gives a reason why it holds.
It may state two separate claims as one.
What the paper did — it cites no source for this, so there is none to check. The quote shows it is in the paper.
In the paper
“Two users (an Obstetrician and a Radiologist) respectively used these interactive methods to segment every test image until the result was visually acceptable.”
§ DeepIGeoS: A Deep Interactive Geodesic Framework for Medical Image Segmentation > Experiments > Comparison Methods and Evaluation Metrics
plain- Asserted: passes — The authors put it forward as true.
- Checkable: passes — It can be checked against evidence.
- Load-bearing: passes — The paper’s conclusions depend on it.
- Based: passes — The paper gives a reason why it holds.
Probably not a substantial claim.
In the paper
“In [50], a CRF based on RNN was proposed and it can be trained by back-propagation.”
§ DeepIGeoS: A Deep Interactive Geodesic Framework for Medical Image Segmentation > Method > Back-Propagatable CRF-Net with Freeform Pairwise Potentials and User Constraints
What the sources say
- Not checked yetcites [50] Zheng S., Jayasumana S., Romera-Paredes B., Vineet V., Su Z., Du D., Huang C., and Torr P. H. S., “ Conditional random fields as recurrent neural networks,” in Proc. IEEE Int. Conf. Comput. Vis., 2015, pp. 1529– 1537. source
plain- Asserted: passes — The authors put it forward as true.
- Checkable: passes — It can be checked against evidence.
- Load-bearing: passes — The paper’s conclusions depend on it.
- Based: passes — The paper gives a reason why it holds.
Probably not a substantial claim. It may state two separate claims as one.
In the paper
“The CRF-RNN network [50] formulated dense CRFs as RNNs so that the CNNs and CRFs can be jointly trained in an end-to-end system for segmentation.”
§ DeepIGeoS: A Deep Interactive Geodesic Framework for Medical Image Segmentation > Related Works > CRFs for Spatial Regularization
What the sources say
- Not checked yetcites [50] Zheng S., Jayasumana S., Romera-Paredes B., Vineet V., Su Z., Du D., Huang C., and Torr P. H. S., “ Conditional random fields as recurrent neural networks,” in Proc. IEEE Int. Conf. Comput. Vis., 2015, pp. 1529– 1537. source
plaindirect- Asserted: passes — The authors put it forward as true.
- Checkable: passes — It can be checked against evidence.
- Load-bearing: fails — The paper’s conclusions may not depend on it.
- Based: passes — The paper gives a reason why it holds.
Probably not a substantial claim. The paper’s conclusions may not depend on it.
A conclusion the paper draws from its own results — it cites no other source for it, so there is none to check. The quote shows it is in the paper.
In the paper
“P-Net and R-Net use a resolution-preserving structure that captures high-level features from a large receptive field without loss of resolution.”
§ DeepIGeoS: A Deep Interactive Geodesic Framework for Medical Image Segmentation > Method
plaindirect- Asserted: passes — The authors put it forward as true.
- Checkable: passes — It can be checked against evidence.
- Load-bearing: passes — The paper’s conclusions depend on it.
- Based: unclear — It is unclear why the paper says it holds.
It may state two separate claims as one.
None of the sources cited for this claim have been checked yet.
In the paper
“Second, though long-distance dependency helps to improve segmentation in most RGB images [22], [45], [50]”
§ DeepIGeoS: A Deep Interactive Geodesic Framework for Medical Image Segmentation > Method > Implementation Details
What the sources say
- Not checked yetcites [22] Chen L.-C., Papandreou G., Kokkinos I., Murphy K., and Yuille A. L., “ Semantic image segmentation with deep convolutional nets and fully connected CRFs,” arXiv preprint arXiv:1412.7062. 28463186 source
- Not checked yetcites [45] Krähenbühl P. and Koltun V., “ Efficient inference in fully connected CRFs with gaussian edge potentials,” in Proc. Neural Inf. Process. Syst. Conf., 2011, pp. 109– 117. source
- Not checked yetcites [50] Zheng S., Jayasumana S., Romera-Paredes B., Vineet V., Su Z., Du D., Huang C., and Torr P. H. S., “ Conditional random fields as recurrent neural networks,” in Proc. IEEE Int. Conf. Comput. Vis., 2015, pp. 1529– 1537. source
plaindirect- Asserted: passes — The authors put it forward as true.
- Checkable: passes — It can be checked against evidence.
- Load-bearing: passes — The paper’s conclusions depend on it.
- Based: passes — The paper gives a reason why it holds.
Probably not a substantial claim.
In the paper
“It is fast due to accessing the image memory in contiguous blocks.”
§ DeepIGeoS: A Deep Interactive Geodesic Framework for Medical Image Segmentation > Method > Implementation Details
What the sources say
- Not checked yetcites [36] Criminisi A., Sharp T., and Blake A., “ GeoS: Geodesic image segmentation,” in Proc. Eur. Conf. Comput. Vis., 2008, pp. 99– 112.
plaindirect- Asserted: passes — The authors put it forward as true.
- Checkable: passes — It can be checked against evidence.
- Load-bearing: fails — The paper’s conclusions may not depend on it.
- Based: passes — The paper gives a reason why it holds.
Probably not a substantial claim. The paper’s conclusions may not depend on it.
The paper relies on this without support.
Poor image quality, large variations among patients, inhomogeneous appearances from pathology, and variability of protocols among clinicians lead to limitations of automatic segmentation.
“This is typically due to poor image quality (with noise, partial volume effect, artifacts and low contrast), large variations among patients, inhomogeneous appearances brought by pathology, and variability of protocols among clinicians leading to different definitions of a given structure boundary.”
The paper relies on this without support.
Providing manual annotations for segmentation is time-consuming and labor-intensive.
“As providing manual annotations for segmentation is time-consuming and labor-intensive, an efficient interactive segmentation tool is of great importance for practical use.”
The paper relies on this without support.
The initial automatic segmentation from P-Net is high-quality.
“the method starts with a high-quality automatic segmentation”
The paper relies on this without support.
Simulated user interactions (random clicks in mis-segmented regions) are representative of real user interactions for training R-Net.
“we automatically simulate user interactions to train R-Net with CRF-Net(fu)”
The paper relies on this without support.
The manually delineated ground truth is accurate.
“The ground truth was manually delineated by an experienced Radiologist.”
The paper relies on this without support.
Automatic brain tumor segmentation remains technically challenging because tumor size, shape, and localization vary among patients and boundaries between adjacent structures are often ambiguous.
“automatic brain tumor segmentation remains technically challenging because 1) the size, shape, and localization of brain tumors have considerable variations among patients; 2) the boundaries between adjacent structures are often ambiguous.”
The paper relies on this without support.
Segmentation of brain tumors can provide better volumetric measurements and therefore has enormous potential value for improved diagnosis, treatment planning, and follow-up of individual patients.
“Segmentation of brain tumors can provide better volumetric measurements and therefore has enormous potential value for improved diagnosis, treatment planning, and follow-up of individual patients.”
Claims other papers make about this one
Each is checked against this paper’s own text: does it say what the citing paper says it does?
The source backs part of the claim, not all of it — or backs it for a different population, condition or comparison.
In the citing paper
“Semi- or fully automatic segmentation methods can significantly reduce the time and labor required, increase consistency, and enable the analysis of large-scale datasets4.”
From Segment anything in medical images (2024) · cites this paper as [4]
Experimental — accuracy not yet measuredThe source backs part of the claim, not all of it — or backs it for a different population, condition or comparison.
In the citing paper
“while existing deep learning-based interactive segmentation methods focus mainly on limited tasks and image modalities.”
From Segment anything in medical images (2024) · cites this paper as [4]
Experimental — accuracy not yet measuredThe source backs part of the claim, not all of it — or backs it for a different population, condition or comparison.
In the citing paper
“In annotation workflows, an interactive model can reduce the amount of slice-by-slice contouring needed to create training labels [28,31].”
From Correction-aware interactive 3D tumor segmentation with sparse and revisable prompts (2026) · cites this paper as [28]
Experimental — accuracy not yet measured
Citations
Cites
Deep Residual Learning for Image Recognition
He, K., Zhang, X., Ren, S., & Sun, J. (2016) · 2016 IEEE Conference on Computer Vision and Pattern Recognition (CVPR) · doi:10.1109/cvpr.2016.90 · Cited by 235,474 · cited 2×
“Typical CNNs such as AlexNet [22], GoogleNet [23], VGG [24] and ResNet [25] were originally designed for image classification tasks.”
MethodVery Deep Convolutional Networks for Large-Scale Image Recognition
Simonyan, K., & Zisserman, A. (2014) · arXiv · doi:10.48550/arxiv.1409.1556 · Cited by 114,148 · cited 4×
“To obtain an exponential increase of the receptive field, VGG-16 uses a max-pooling and downsampling layer after each block.”
BackgroundMethodInfluentialImageNet classification with deep convolutional neural networks
Krizhevsky, A., Sutskever, I., & Hinton, G. E. (2017) · Communications of the ACM · doi:10.1145/3065386 · Cited by 112,155 · cited 1×
“Typical CNNs [16], [17], [18] were originally designed for image classification tasks.”
BackgroundU-Net: Convolutional Networks for Biomedical Image Segmentation
Ronneberger, O., Fischer, P., & Brox, T. (2015) · Lecture notes in computer science · doi:10.1007/978-3-319-24574-4_28 · Cited by 99,404 · cited 1×
“Inspired by the convolution and deconvolution framework of FCN, a U-shape network (U-Net) [28] and its 3D version [18] were proposed for biomedical image segmentation.”
MethodGoing deeper with convolutions
Szegedy, C., Liu, W., Jia, Y., Sermanet, P., Reed, S., Anguelov, D., Erhan, D., Vanhoucke, V., & Rabinovich, A. (2015) · 2015 IEEE Conference on Computer Vision and Pattern Recognition (CVPR) · doi:10.1109/cvpr.2015.7298594 · Cited by 48,562 · cited 2×
“Typical CNNs such as AlexNet [22], GoogleNet [23], VGG [24] and ResNet [25] were originally designed for image classification tasks.”
MethodFully convolutional networks for semantic segmentation
Long, J., Shelhamer, E., & Darrell, T. (2015) · 2015 IEEE Conference on Computer Vision and Pattern Recognition (CVPR) · doi:10.1109/cvpr.2015.7298965 · Cited by 38,834
Rich Feature Hierarchies for Accurate Object Detection and Semantic Segmentation
Girshick, R., Donahue, J., Darrell, T., & Malik, J. (2014) · 2014 IEEE Conference on Computer Vision and Pattern Recognition · doi:10.1109/cvpr.2014.81 · Cited by 32,684
Chen, L.-C., Papandreou, G., Kokkinos, I., Murphy, K., & Yuille, A. L. (2018) · IEEE Transactions on Pattern Analysis and Machine Intelligence · doi:10.1109/tpami.2017.2699184 · Cited by 22,392
Chen, L.-C., Papandreou, G., Kokkinos, I., Murphy, K., & Yuille, A. L. (2016) · arXiv · doi:10.48550/arxiv.1606.00915 · Cited by 22,392
TensorFlow: A system for large-scale machine learningPreprint
Abadi, M., Barham, P., Chen, J., Chen, Z., Davis, A., Dean, J., Devin, M., Ghemawat, S., Irving, G., Isard, M., et al. (2016) · arXiv (Cornell University) · doi:10.5555/3026877.3026899 · Cited by 16,548
Research works printed but not linked: 1
- payet, 2010, (RF)^2 – random forest random field, Proc Neural Inf Process Syst Conf, 1885
Cited by
Sorted by citations
Items 401–500 of 507
Standardization of Sonar Images by Conditional Random Fields for Fish Segmentation With Mask R-CNN
Chang, C.-C., Wang, Y., & Cheng, S. (2021) · International Symposium on Intelligent Signal Processing and Communication Systems (ISPACS) · doi:10.1109/ispacs51563.2021.9650982 · Cited by 1
Identifying Catheter and Line Position in Chest X-Rays Using GANs
Aryal, M., & Yahyasoltani, N. (2021) · IEEE International Conference on Machine Learning and Applications (ICMLA) · doi:10.1109/icmla52953.2021.00027 · Cited by 1
(2019) · International Journal of Recent Technology and Engineering (IJRTE) · doi:10.35940/ijrte.d1073.1284s219 · Cited by 1
Dohi, T., Trivedi, K. S., & Avritzer, A. (2020) · doi:10.1142/9789811214578_others02 · Cited by 1
Medical Image Segmentation with Limited Supervision: A Review of Deep Network ModelsPreprint
Peng, J., & Wang, Y. (2021) · arXiv (Cornell University) · doi:10.48550/arxiv.2103.00429 · Cited by 1
Zhang, B., Rahmatullah, B., Wang, S. L., et al. (2021) · SSRN Electronic Journal · doi:10.2139/ssrn.3917563 · Cited by 1
2019 Index IEEE Transactions on Pattern Analysis and Machine Intelligence Vol. 41
(2019) · IEEE Transactions on Pattern Analysis and Machine Intelligence · doi:10.1109/tpami.2019.2953823 · Cited by 1
3D Quantum-inspired Self-supervised Tensor Network for Volumetric Segmentation of Medical ImagesPreprint
Konar, D., Bhattacharyya, S., Gandhi, T. K., Panigrahi, B. K., & Jiang, R. (2023) · doi:10.36227/techrxiv.12909860.v4 · Cited by 1
Hybrid Cnn-Transformer Network for Interactive Learning of Challenging Musculoskeletal ImagesPreprint
Bi, L., Buehner, U., Fu, X., Williamson, T., Choong, P., & Kim, J. (2023) · SSRN Electronic Journal · doi:10.2139/ssrn.4535797 · Cited by 1
Hiseg: Human Assisted Instance SegmentationPreprint
Korkmaz, M., Sezgin, T. M., & Buyukyazi, T. (2024) · SSRN Electronic Journal · doi:10.2139/ssrn.4797478 · Cited by 1
A Fully Convolutional Two-Stream Fusion Network for Interactive Image SegmentationPreprint
Hu, Y., Soltoggio, A., Lock, R., et al. (2018) · arXiv (Cornell University) · doi:10.48550/arxiv.1807.02480
Azharuddin, M., Roberg, K. B., Dhara, A. K., Jain, M. V., D’Arcy, P., Hinkula, J., Slater, N. K. H., & Patra, H. K. (2019) · bioRxiv (Cold Spring Harbor Laboratory) · doi:10.1101/702316
Liao, X., Li, W., Xu, Q., et al. (2019) · arXiv (Cornell University) · doi:10.48550/arxiv.1911.10334
Self-citationA Professional Analysis on the Segmentation of Brain Cancer in MR Images Using M-FCM
George, T., RAMAKRISHNAN, T., Sankaragomathi, B., et al. (2020) · International Conference on Inventive Computation Technologies (ICICT) · doi:10.1109/icict48043.2020.9112547
Nguyen, A., Kundrat, D., Dagnino, G., et al. (2020) · arXiv (Cornell University) · doi:10.48550/arxiv.2006.09117
Li, Y., Pan, H., Jiang, L., Tong, J., & Shen, Y. (2020) · International Conference on Intelligent Robotics and Control Engineering (IRCE) · doi:10.1109/irce50905.2020.9199240
Localized Interactive Instance SegmentationPreprint
Majumder, S., & Yao, A. (2020) · arXiv (Cornell University) · doi:10.48550/arxiv.2010.09140
Interactive Radiotherapy Target Delineation with 3D-Fused Context PropagationPreprint
Chao, C.-H., Cheng, H.-T., Ho, T., Lü, L., & Sun, M. (2020) · arXiv (Cornell University) · doi:10.48550/arxiv.2012.06873
Visual saliency detection based on visual center shift
Hu, J., Xiong, J., Feng, Y., et al. (2021) · International Conference on Advanced Computational Intelligence (ICACI) · doi:10.1109/icaci52617.2021.9435891
Dual Shape Guided Segmentation Network for Organs-at-Risk in Head and Neck CT ImagesPreprint
Wang, S., Yanagihara, T., Chera, B. S., Shen, C. J., Yap, P., & Lian, J. (2021) · arXiv (Cornell University) · doi:10.48550/arxiv.2110.12192
One-shot Weakly-Supervised Segmentation in Medical ImagesPreprint
Lei, W., Su, Q., Gu, R., et al. (2021) · arXiv (Cornell University) · doi:10.48550/arxiv.2111.10773
Self-citationImproved image semantic segmentation with domain adaptation for mechanical parts
Xie, X., Huang, Y., Wan, T., et al. (2022) · Mechanical Engineering Journal · doi:10.1299/mej.21-00228
Convolutional neural network in the detection of gastrointestinal tumor and tap
Zhai, S., Du, L., Zhong, X., Sun, X., Zhang, S., & Yuan, F. (2022) · Sustainable Computing Informatics and Systems · doi:10.1016/j.suscom.2022.100692
Dhombres, F., Bonnard, J., Bailly, K., et al. (2021) · doi:10.2196/preprints.35465
3D Bounding Box Detection in Volumetric Medical Image Data: A Systematic Literature ReviewPreprint
Kern, D., & Mastmeyer, A. (2020) · doi:10.36227/techrxiv.13360259
A Dual Path Convolutional Network for Placental Vessel Segmentation in Fetoscopic SurgeryPreprint
Rao, Y., Tan, T. H., Zeng, S., et al. (2022) · SSRN Electronic Journal · doi:10.2139/ssrn.4161626
Tehranizadeh, A. A., Aziz, M. J., Majedi, H., et al. (2022) · bioRxiv (Cold Spring Harbor Laboratory) · doi:10.1101/2022.08.02.502579
U-Net Based Efficient Deep Learning Architecture for Effective Skin Lesion SegmentationPreprint
Nampalle, K. B., Ramesh, P., & Raman, B. (2022) · SSRN Electronic Journal · doi:10.2139/ssrn.4185484
Interactive segmentation using U-Net with weight map and dynamic user interactionsPreprint
Khan, N., & Pirabaharan, R. (2023) · doi:10.32920/22734368
Interactive segmentation using U-Net with weight map and dynamic user interactionsPreprint
Khan, N., & Pirabaharan, R. (2023) · doi:10.32920/22734368.v1
Advancing Abdominal Organ and PDAC Segmentation Accuracy with Task-Specific Interactive Models
Okel, S. E., Viviers, C. G. A., Ramaekers, M., Hellström, T. A. E., Tasios, N., Mavroeidis, D., Pluyter, J. R., Jacobs, I., Luyer, M. D. P., de With, P. H. N., et al. (2023) · Lecture notes in computer science · doi:10.1007/978-3-031-47076-9_6
Deep Interactive Image Semantic and Instance Segmentation
Wu, X., Yang, P., Shao, W., et al. (2023) · Lecture notes in computer science · doi:10.1007/978-3-031-46308-2_7
Zhang, F., Li, J., Huang, Y., et al. (2023) · IEEE International Ultrasonics Symposium · doi:10.1109/ius51837.2023.10306567
Boosting Medical Image Segmentation with Partial Class Supervision
Xu, M., Yang, H., Song, B., Miao, J., Hu, W., & Cheng, E. (2023) · Lecture notes in computer science · doi:10.1007/978-981-99-8565-4_36
GridIIS: Grid Based Interactive Image Segmentation
Zhu, P., Wang, D., & Zhu, S. (2023) · Lecture notes in computer science · doi:10.1007/978-981-99-8552-4_28
Detection of Vocal Cord Disease Based on Local Contour Features of Laparoscopy Images
Fan, Y., Yao, R., Liu, J., et al. (2023) · Asia-Pacific Conference on Image Processing, Electronics and Computers (IPEC) · doi:10.1109/ipec57296.2023.00017
Improving Interactive Segmentation Techniques in Medical Imaging
Pirabaharan, R. (2024) · doi:10.32920/25413817
Improving Interactive Segmentation Techniques in Medical Imaging
Pirabaharan, R. (2024) · doi:10.32920/25413817.v1
Cho, W.-W., Choi, D., Lim, H., Choi, J., Choi, S., Min, H., Lim, S., & Choo, J. (2024) · IEEE Winter Conference on Applications of Computer Vision · doi:10.1109/wacv57701.2024.00744
Zhong, T., Wang, Y., Xu, X., Wu, X., Liang, S., Ning, Z., Wang, L., Niu, Y., Li, G., & Zhang, Y. (2024) · Computerized Medical Imaging and Graphics · doi:10.1016/j.compmedimag.2024.102404
Interactive Skin Lesion Segmentation Considering Behavioral Preference in Clicking
Zhao, S., Gu, C., Yu, J. R., Akashi, T., & Zhang, C. (2024) · IEEJ Transactions on Electrical and Electronic Engineering · doi:10.1002/tee.24172
Deep leaning-based interactive segmentation of three-dimensional blood vessel images
Li, Y., Zhang, Q., Zhou, H., An, Y., Li, X., Li, X., Zhou, H., & Li, A. (2025) · Biomedical Signal Processing and Control · doi:10.1016/j.bspc.2025.107507
SBSN: Weakly Supervised Image Segmentation Based on Shape Prior
Yuan, S., Wang, K., Shao, J., et al. (2024) · IEEE International Conference on Signal, Information and Data Processing (ICSIDP) · doi:10.1109/icsidp62679.2024.10868021
Segmentation of Lung Images Using Hybridization of Fuzzy C Means and Morphological Techniques
Harshini, I. S., R, S. D. K., Shanmugalatha, A., et al. (2024) · doi:10.1109/icietdw61607.2024.10939895
RRM‐TransUNet: Deep‐Learning Driven Interactive Model for Precise Pancreas Segmentation in CT Images
Wang, Y., Liu, W., Yu, P., Huang, X., & Pan, J. (2025) · International Journal of Medical Robotics and Computer Assisted Surgery · doi:10.1002/rcs.70065
Evolutionary Self-Adjusting Masi Entropy Thresholding
Mousavirad, S. J., Oliva, D. A., Tabatabaei, S. M., et al. (2025) · Studies in computational intelligence · doi:10.1007/978-3-031-78440-8_7
Design and Evaluation of Deep Learning Models for Interactive Image Segmentation: A SurveyPreprint
Kovacs-Deak, D., Meyer, M. I., Lambrechts, A., Wirix-Speetjens, R., & Maes, F. (2025) · doi:10.22541/au.175044411.12910644/v1
Rectifying Whole Brain Segmentation Errors Using a Novel Under-Segmentation Correction Method
Sujana, D. S., & Augustine, D. P. (2025) · Communications in computer and information science · doi:10.1007/978-3-031-96473-2_30
Semantic Segmentation with Spreading Scribbles
Gabrielyan, Y., Yeghiazaryan, V., & Voiculescu, I. D. (2025) · Lecture notes in computer science · doi:10.1007/978-3-031-98694-9_6
Yu, X., Luo, W., Tian, Z., et al. (2025) · Biomedical Signal Processing and Control · doi:10.1016/j.bspc.2025.108396
Effective Human–AI Collaborative Intelligence
Jiang, Z., & Liu, X. (2025) · Cambridge University Press eBooks · doi:10.1017/9781009587877.009
IKAN: Interactive KAN with Modulation Fusion for Medical Image Segmentation
Liu, S., Wan, T., Cai, Y., Chen, S., Hu, B., Wan, Y., & Qiu, W. (2025) · Lecture notes in computer science · doi:10.1007/978-3-032-04927-8_26
Wang, G. X., Dong, X., Guo, J., et al. (2025) · Lecture notes in computer science · doi:10.1007/978-3-032-06307-6_4
Self-citationMedical Image Segmentation with Deep Learning: An Overview
Sabrou, S., Guezzaz, A., Velu, S. R., Benkirane, S., Eddabbah, M., & Azrour, M. (2025) · Springer series in reliability engineering · doi:10.1007/978-3-031-98728-1_3
Is Complete Labeling Necessary? Understanding Active Learning in Longitudinal Medical Imaging
Ma, S., Du, H., Mathur, P., Kelly, B. S., Killeen, R. P., Lawlor, A., & Dong, R. (2025) · International Joint Conference on Neural Networks (IJCNN) · doi:10.1109/ijcnn64981.2025.11229353
Fully automated IVUS image segmentation with efficient deep-learning-assisted annotation
Zhang, L., Chen, Z., Zhang, H., Zaman, F. A., Wahle, A., Wu, X., McNamara, C. A., Taylor, A. M., & Milan Sonka, A. (2025) · Computers in Biology and Medicine · doi:10.1016/j.compbiomed.2025.111312
Karunakar, S., & Praveen Kumar, P. (2025) · doi:10.1109/icoici65217.2025.11254855
Multi-Scale Graph Convolutional Networks for Robust Image Segmentation in Medical Imaging
Sharma, Y. K., Kumar, M., Kumar, R., et al. (2025) · doi:10.1109/cises66934.2025.11264896
Label tree semantic losses for rich multi-class medical image segmentation
Wang, J., MacCormac, O. J., Rochford, W., Kujawa, A., Shapey, J., & Vercauteren, T. K. (2026) · Frontiers in Artificial Intelligence · doi:10.3389/frai.2026.1841639
Self-citationLiu, T., Wang, Y., Torigian, D. A., et al. (2025) · Medical Physics · doi:10.1002/mp.70210
FedFAS: Federated Few-shot Abdominal Organs Segmentation across Heterogeneous Clients
Zhang, Y., Wu, J., Zhao, M., et al. (2025) · doi:10.1109/ijcnn64981.2025.11229148
Human in the loop: Integration of experts in MR data processing
Carneiro, G. (2025) · Advances in magnetic resonance technology and applications · doi:10.1016/b978-0-443-14109-6.00018-3
Improving Medical Image Segmentation Using Gaze Guidance from Non-Professionals
Fang, Y., Ma, W., Yu, X., Liu, Q., Wang, Y., Peng, Y. K., Zhou, D., & Ju, Z. (2025) · International Conference on Advanced Robotics and Mechatronics (ICARM) · doi:10.1109/icarm65671.2025.11293518
A survey: AI Techniques for Medical Image Analysis
Mohammed, S. J., Ahmed, R. I., & Mohsin, R. M. (2025) · Basrah Researches Sciences · doi:10.56714/bjrs.51.2.17
Bruzadin, A., Colnago, M., Ribas, L. C., et al. (2026) · Computers in Biology and Medicine · doi:10.1016/j.compbiomed.2025.111431
Sawant, J. S., Moukheiber, L., Nair, A., Mahajan, A., Byun, J., Pichaimani, I., Yoon, S. T., Martin, C. T., & Mitchell, C. S. (2026) · Frontiers in Bioengineering and Biotechnology · doi:10.3389/fbioe.2025.1733689
Segmenting Brain Regions in Low Field Pediatric Brain MR Images Using (Symmetric) NnU-Net ResEnc
Morshuis, J. N., Hein, M., & Baumgartner, C. F. (2026) · Lecture notes in computer science · doi:10.1007/978-3-032-14417-1_4
Rethinking Incision Segmentation with Geometry-Structure Aligned Polygon Prompt
Ding, K., Qiao, P., Sun, Z., et al. (2025) · IEEE International Conference on Bioinformatics and Biomedicine (BIBM) · doi:10.1109/bibm66473.2025.11356084
SEDUnet: One-Shot interactive CNV segmentation in OCT via signed euclidean distance prior
Tang, R., Cao, D., Li, X.-C., et al. (2026) · Optics and lasers in engineering · doi:10.1016/j.optlaseng.2026.110043
Using machine learning for quality control in additive manufacturing
Polanský, A., Zetková, I., Gruber, I., et al. (2026) · Procedia Structural Integrity · doi:10.1016/j.prostr.2026.01.066
Deep Insight Network for Medical Hyperspectral Imaging Segmentation
Xu, W., Liu, S., Wei, X., & Wan, H. (2025) · International Conference on Artificial Intelligence, Human-Computer Interaction and Robotics (AIHCIR) · doi:10.1109/aihcir67580.2025.11405343
Weakly and semi-supervised segmentation of uterus using coarse annotations in MRI
Lou, P., Huang, W., Ying, J., Yang, H., & Fu, L. (2026) · Medical Engineering & Physics · doi:10.1088/1873-4030/ae5964
Segmentation by deep learning with geometric constraints and active contours
Makaroff, N. (2024) · theses.fr (ABES) · doi:10.70675/861dcf2ez2d8az413fz8c00zb51af12facad
Ensembling CNN, Transformer, and Mamba with Stacking for Brain Tumor Segmentation
Dang, T. D. Q., Nguyen, H. H., & Tiulpin, A. (2026) · Lecture notes in computer science · doi:10.1007/978-3-032-16365-3_18
Flouri, D., Adamides, G., Darby, J. R. T., et al. (2026) · Physiological Reports · doi:10.14814/phy2.70869
Self-citationSun, H., Li, J., Liu, Y., Meng, F., An, Z., Cui, Y., Lv, B., Chai, G., Jia, L., Shi, Z., et al. (2026) · BMC Medical Imaging · doi:10.1186/s12880-026-02400-5
Cavum Septum Pellucidum Instance Segmentation By Brain Point Detection
Banik, S., Jahan, I., Islam, M. S., et al. (2025) · doi:10.1109/spicscon69221.2025.11504143
Promptable image segmentation: a survey of guided input techniques
Nejabat, H., D’Asaro, F., Pecora, A. E., Monopoli, T., & Bottino, A. (2026) · Foundations and Trends® in Computer Graphics and Vision · doi:10.1108/ftcgv-03-2026-001
The landscape of artificial intelligence in carbon ion radiotherapy: A scoping review
Fontana, G., Seetha, S. T., Lillo, S., et al. (2026) · Tumori Journal · doi:10.1177/03008916261438952
Chen, L., Wu, Z., Zhao, F., Wang, Y. P., Lin, W., Wang, L., & Li, G. (2026) · Computerized Medical Imaging and Graphics · doi:10.1016/j.compmedimag.2026.102779
Exploring MedSAM for Mammograms: Enhanced Segmentation and Classification with Machine Learning
Amin, A., Acharya, U. D., Prakashini, K., & Siddalingaswamy, P. C. (2026) · Lecture notes in networks and systems · doi:10.1007/978-981-95-0497-8_7
Pan, Y., Guo, Y., Chen, D., et al. (2026) · Biomedical Signal Processing and Control · doi:10.1016/j.bspc.2026.110653
Interactive Pressure Ulcer Segmentation: A Point-Prompted DeepLabV3+ Approach
Nazzal, W., Thurnhofer‐Hemsi, K., Veredas, F. J., & López‐Rubio, E. (2026) · Lecture notes in computer science · doi:10.1007/978-3-032-27317-8_1
High-resolution Fusion Mamba and deep-feature memory for medical image segmentation
Zhang, Z., Xiang, B., Xie, C., et al. (2026) · Pattern Recognition · doi:10.1016/j.patcog.2026.114147
Zaheer, Q., Atta, Z., Ehsan, H., et al. (2026) · Journal of Infrastructure Systems · doi:10.1061/jitse4.iseng-2912
Automated lumbar muscles segmentation with segment anything model for adult degenerative scoliosis
Xian, S., Yuan, L., Zhang, M., et al. (2026) · European Spine Journal · doi:10.1007/s00586-026-10103-2
Self-citationAnnotation-efficient medical image segmentation via cross-latent graphs and vector-quantized memory
Xu, Y., Zhou, M., Xu, X., et al. (2026) · Medical Image Analysis · doi:10.1016/j.media.2026.104145
Roles and applications of artificial intelligence in fetal and placental MRI: a literature review
Ding, D., Zhu, F., Tang, X., & Ding, Z. (2026) · BMC Pregnancy and Childbirth · doi:10.1186/s12884-026-09494-3
HAT-4D: Lifting Monocular Video for 4D Multi-object Interactions via Human-Agent Collaboration
Li, J., Wu, Y., Zhang, Z., Shi, X., Wang, H., Zhao, Y., Linxiang, S., Yu, C. S., Zhang, M., Ding, Y., et al. (2026) · Lecture notes in computer science · doi:10.1007/978-3-032-37432-5_10
Correction-aware interactive 3D tumor segmentation with sparse and revisable prompts
Li, H., & Li, H. (2026) · The Visual Computer · doi:10.1007/s00371-026-04560-5
“In medical imaging, several promptable systems move beyond single-prompt segmentation and use iterative refinement to correct an initial model prediction [28, 31].”
Zhang, Y., Cheng, H., Zhang, J., Shi, G., Liu, X. Y., Shi, L. Y., Chen, J., & Wu, Y. T. (2026) · Biomedical Signal Processing and Control · doi:10.1016/j.bspc.2026.110939 · Cited by 1
Ge, B., Yue, C., Xia, C., et al. (2026) · Multimedia Systems · doi:10.1007/s00530-026-02457-w
Bai, Y., Luo, Y., Chen, Z., Lin, Y., Zhuo, M., Ma, J., Lin, X., Xie, Q., Pan, Z., & Fang, Y. (2026) · Journal of Imaging Informatics in Medicine · doi:10.1007/s10278-026-02136-2
Faster Geodesic Distance Transform on GPU
Esteban, B., & Carlinet, E. (2026) · Lecture notes in computer science · doi:10.1007/978-3-032-31927-2_25
Learning Query-assisted Multiple Prototypes for Few-shot Medical Image Segmentation
Jiang, J., Li, M., Wang, S., et al. (2026) · ACM Transactions on Intelligent Systems and Technology · doi:10.1145/3838185
Bharati, S., Ahmad, M. O., & Swamy, M. N. S. (2026) · Biomedical Signal Processing and Control · doi:10.1016/j.bspc.2026.111054
Li, B.-Y., Fan, T., Chen, J., & Zhang, Y. (2026) · Radiological Physics and Technology · doi:10.1007/s12194-026-01092-4
Metadata
- Authors
- Wang, G., Zuluaga, M. A., Li, W., Pratt, R., Patel, P. A., Aertsen, M., Doel, T., David, A. L., Deprest, J., Ourselin, S., & Vercauteren, T.
- Affiliations
- Wellcome / EPSRC Centre for Interventional and Surgical Sciences (GB)
- University College London (GB)
- KU Leuven (BE)
- Corresponding author
- Wang, Guotai
- ORCID
- Venue
- IEEE Transactions on Pattern Analysis and Machine Intelligence
- Published
- 2019-07-01
- Volume
- 41
- Issue
- 7
- Pages
- 1559-1572
- ISSN
- 0162-8828 (ISSN-L)
- 2160-9292
- 1939-3539
- PMC
- PMC6594450
- OpenAlex
- W2732931556
- Semantic Scholar
- d66c118307ca332e24b1d53bcf152563e3c48b6b
- Cited by
- 502
- References
- 90
- Citations by year
- 2026: 47 · 2025: 74 · 2024: 64 · 2023: 75 · 2022: 76 · 2021: 82 · 2020: 42 · 2019: 31
- FWCI
- 20.76
- Type
- journal article
- Language
- en
- Open access
- hybrid
- doi.org
- Locations
- IEEE Transactions on Pattern Analysis and Machine Intelligence (publishedVersion, cc-by)
- Europe PMC (PubMed Central) (publishedVersion, cc-by)
- PubMed Central (publishedVersion, cc-by)
- PubMed (publishedVersion)
- arXiv (Cornell University) (submittedVersion)
- Lirias (submittedVersion, other-oa)
- UCL Discovery (University College London) (submittedVersion)
- Research Portal (King's College London) (submittedVersion, cc-by)
- arXiv (Cornell University)
- Funders
- Wellcome Trust (WT101957)
- Engineering and Physical Sciences Research Council (NS/A000027/1, EP/H046410/1, EP/J020990/1, EP/K005278)
- Wellcome/EPSRC (203145Z/16/Z)
- National Institute for Health Research (NIHR BRC UCLH/UCL)
- Royal Society (RG160569)
- Topics
- Physical Sciences › Computer Science › Computer Vision and Pattern Recognition › Medical Image Segmentation Techniques
- Physical Sciences › Computer Science › Computer Vision and Pattern Recognition › Advanced Neural Network Applications
- Physical Sciences › Computer Science › Computer Vision and Pattern Recognition › Brain Tumor Detection and Classification
- Keywords
- interactive segmentation, medical image segmentation, user interaction, conditional random fields, placenta segmentation, fetal MRI, brain tumor segmentation, FLAIR MRI, dense prediction, segmentation refinement
- MeSH terms
- Brain Neoplasms, Female, Humans, Image Interpretation, Computer-Assisted, Magnetic Resonance Imaging, Placenta, Pregnancy, Neural Networks, Computer, Imaging, Three-Dimensional
About these checks
Registry, retraction, Cites and statistics results are computed, not judged, with one exception: a printed reference that no index lists is read once by a model before it counts as a citation error. Claims are extracted by a model and kept only when their quote appears verbatim in the text; each cited source is then checked, with a model’s help, for whether it says what the claim relies on. Those verdicts can be wrong — read the claim’s quote and the cited source before relying on one.
A language model drew the claims from the paper on 2026-10-08, under version 3 of the claim definition (model deepseek-v4.1-flash, prompt extract-v3).
A second model labelled each claim on 2026-10-08 (model jev-1.13-20260917, definition revision gold-guideline-v0.2).
Statistics and arithmetic are recomputed, not judged.
Confidence bands are shown only for fields calibrated on our annotated test set. None is calibrated yet, so no band is shown.
What counts as a claim ›How we measure confidence ›How we check this ›
Are you an author, or do you see a problem with this page? Request a review
