

The DOI matches its Crossref record; 57 of the 57 references it cites were found in a registry or an index; none of the 49 sources its claims cite is checked for support yet.
Psychosocial outcomes in young adults with childhood traumatic brain injury: A 20‐year follow‐up study
Open accessAbstract
We assessed the proportion of childhood TBI survivors who experienced favourable or less favourable psychosocial outcomes (defined as less favourable when 20% or more of the sample report difficulties or unmet needs) compared to controls and to explore factors associated with these outcomes at 20 years post‐TBI. Participants included 54 young adults (age 22–34 years) who sustained mild ( n = 14), moderate ( n = 27), or severe ( n = 13) TBI during childhood, and age and sex‐matched 13 typically developing controls. Outcomes assessed: employment, quality of life, relationships, mental health, offending behaviours, and substance use outcomes. Study‐designed and validated questionnaires (e.g., World Health Organization Quality of Life Bref) were used. Analyses involved descriptive statistics and generalised linear models. A high proportion of TBI participants reported favourable outcomes for offending behaviours (90.7%–94.3%). However, a substantial proportion (24%–87%) of participants reported less favourable outcomes in education, employment, overall QoL, general health, relationships, anxiety, tobacco use, and alcohol use. The TBI group reported significantly lower Overall QoL compared to controls, and the mild TBI group was at a greater risk of reporting less favourable outcomes. Other significant predictors of outcomes were younger age at injury and lower SES at the time of injury. These findings highlight that some psychosocial domains (e.g., relationships) are more affected than others (e.g., offending behaviours) in young adults with childhood TBI. Further research is needed to identify factors influencing psychosocial outcomes and to develop targeted interventions for young adults with childhood TBI.
Overview
CoChat Summary
TL;DR
In a 20-year follow-up of 54 young adults with childhood TBI and 13 typically developing controls, many reported favourable outcomes in offending behaviour and work satisfaction, but substantial proportions reported less favourable outcomes in education, employment, QoL, relationships, mental health, and substance use. TBI was significantly associated with poorer overall QoL, and younger age at injury and lower SES at injury predicted some outcomes.
Key findings
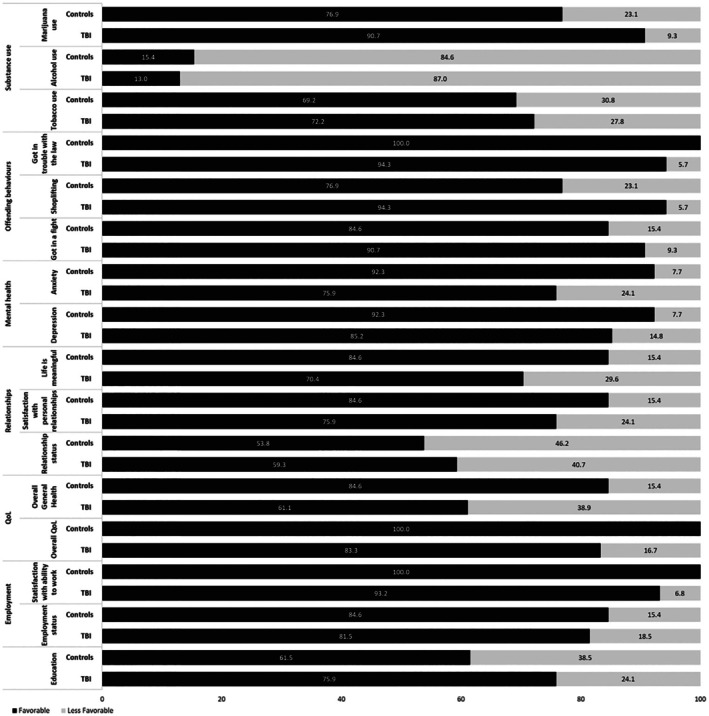
- Of 16 outcomes, 50% were classified as predominantly less favourable in the TBI group (≥20% reporting difficulties/unmet needs); highest less-favourable rates were alcohol use (87.0%), relationship status (40.7%), and general health (38.9%), while highest favourable rates were non-marijuana use (90.7%), no offending behaviours (90.7%–94.3%), and satisfaction with work (93.2%).
- TBI vs controls: only overall QoL differed significantly, with 16.7% of TBI vs 0% of controls reporting poor QoL [χ² = 4.207, df = 1, N = 67, p = .040].
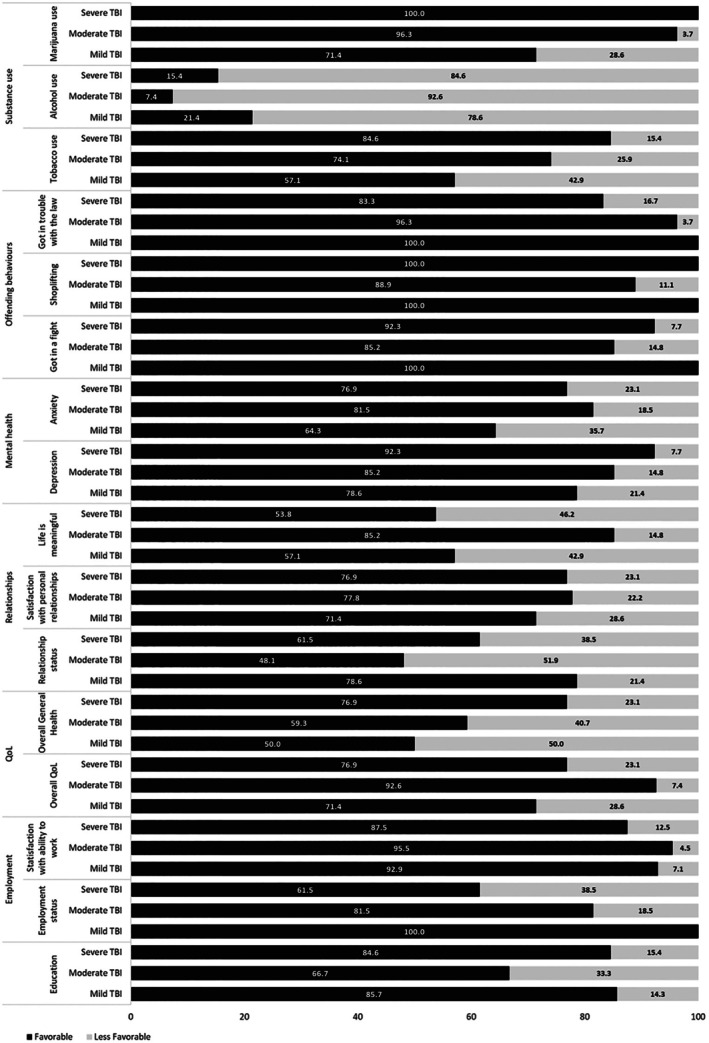
- By severity, the mild TBI group had the most predominantly less favourable domains (10/16, 62.5%), followed by severe (8/16, 50%) and moderate (6/16, 37.5%); significant differences were limited to marijuana use (mild 28.6% vs moderate 3.7% vs severe 0%, p = .018) and unemployment (mild 0% vs severe 38.5%, p = .014).
- Predictors: lower SES at injury was associated with higher likelihood of employment (adjusted β = −.90, p = .040); more frequent alcohol use was associated with younger age at injury (adjusted β = −.53, p = .003) and lower SES at injury (adjusted β = .78, p = .044); relationship status was associated with younger age at injury unadjusted (β = −.21, p = .035), but attenuated after controlling for therapies (p = .079).
Methods
- Prospective longitudinal 20-year follow-up of a childhood TBI cohort recruited at injury from consecutive neurosurgical admissions at an Australian Children’s Hospital between June 1993 and June 1997; current sample included 54 TBI participants (mild n = 14, moderate n = 27, severe n = 13; age M = 27.7, SD = 3.3) and 13 age/sex-matched typically developing controls.
- Outcomes covered 16 dichotomised psychosocial domains across education, employment, QoL, relationships, mental health, offending behaviours, and substance use, using study-designed items and validated measures (e.g., WHOQoL-BREF, DASS); less favourable outcomes were defined as ≥20% reporting difficulties/unmet needs, a threshold borrowed from obesity research.
- Analyses used descriptive statistics, χ² tests, ANOVA/Kruskal–Wallis/Mann–Whitney tests, and generalised linear models (binary logistic) for predictors in the TBI group; adjusted models controlled for age at injury and self-reported therapies where severity groups differed.
Limitations
- Stated: high attrition (only 31% of the original TBI sample participated), underrepresentation of males and high-SES participants, small sample size, no control for maternal factors, use of single/multiple items for most outcomes, self-report with possible limited insight, and use of a ≥20% threshold from obesity literature rather than a TBI-specific cutoff.
- Stated/evident: no formal registration or power calculations; the control group was small (n = 13); non-participants differed from participants (more likely male, higher SES, lower IQ), limiting generalisability.
- Evident: the 20-year outcome assessment is cross-sectional for the reported outcomes, so causal direction cannot be established; multiple outcomes and predictors raise the possibility of chance findings, though some adjusted models are reported.
Model-written summary. Check it against the paper before relying on it.
Integrity signals
Registry
Cites
Statistics
Figures
Verification
Claims the paper makes
0 Valid · 0 Not valid · 27 Not checked · 68 Own results and interpretations
A result the paper reports from its own data — it cites no other source for it, so there is none to check. The quote shows it is in the paper.
In the paper
“Across TBI severity groups, 61% (self‐report) and 66% (other report) of participants received at least one therapy by 15 years post‐injury.”
§ Psychosocial outcomes in young adults with childhood traumatic brain injury: A 20‐year follow‐up study > RESULTS > Sample characteristics
plain- Asserted: passes — The authors put it forward as true.
- Checkable: passes — It can be checked against evidence.
- Load-bearing: unclear — It is unclear whether the paper’s conclusions depend on it.
- Based: passes — The paper gives a reason why it holds.
A result the paper reports from its own data — it cites no other source for it, so there is none to check. The quote shows it is in the paper.
In the paper
“Employment also differed significantly, with unemployment rates being significantly lower in the mild group (0%) compared to the severe group (38.5%) [χ 2 = 6.608 (df = 2, N = 54), p = .014].”
§ Psychosocial outcomes in young adults with childhood traumatic brain injury: A 20‐year follow‐up study > RESULTS > Aim 2: Favourable versus less favourable psychosocial outcomes across the TBI severity groups
plainstates an associationn = 54 ·- Asserted: passes — The authors put it forward as true.
- Checkable: passes — It can be checked against evidence.
- Load-bearing: passes — The paper’s conclusions depend on it.
- Based: passes — The paper gives a reason why it holds.
A result the paper reports from its own data — it cites no other source for it, so there is none to check. The quote shows it is in the paper.
In the paper
“Figure 1 shows that of the 16 outcomes assessed, 50% were classified as ‘predominantly less favourable outcomes’ (i.e., ≥20% of participants reported difficulties or unmet needs) in the TBI group.”
§ Psychosocial outcomes in young adults with childhood traumatic brain injury: A 20‐year follow‐up study > RESULTS > Aim 1: Favourable versus less favourable psychosocial outcomes in the TBI versus TDC groups
plain- Asserted: passes — The authors put it forward as true.
- Checkable: passes — It can be checked against evidence.
- Load-bearing: passes — The paper’s conclusions depend on it.
- Based: passes — The paper gives a reason why it holds.
- Rests on an assumption not shown here.
A result the paper reports from its own data — it cites no other source for it, so there is none to check. The quote shows it is in the paper.
In the paper
“Statistically significant differences emerged only for employment status and marijuana use.”
§ Psychosocial outcomes in young adults with childhood traumatic brain injury: A 20‐year follow‐up study > RESULTS > Aim 2: Favourable versus less favourable psychosocial outcomes across the TBI severity groups
plainn = 54 ·- Asserted: passes — The authors put it forward as true.
- Checkable: passes — It can be checked against evidence.
- Load-bearing: passes — The paper’s conclusions depend on it.
- Based: passes — The paper gives a reason why it holds.
A result the paper reports from its own data — it cites no other source for it, so there is none to check. The quote shows it is in the paper.
In the paper
“Across TBI severity groups, 12 of 16 outcome domains (75%) were classified as predominantly less favourable, including marijuana, alcohol and tobacco use, anxiety, depression, life meaning, satisfaction with personal relationships, relationship status, general health, overall QoL, employment, and education.”
§ Psychosocial outcomes in young adults with childhood traumatic brain injury: A 20‐year follow‐up study > RESULTS > Aim 2: Favourable versus less favourable psychosocial outcomes across the TBI severity groups
plain- Asserted: passes — The authors put it forward as true.
- Checkable: passes — It can be checked against evidence.
- Load-bearing: passes — The paper’s conclusions depend on it.
- Based: passes — The paper gives a reason why it holds.
47 more claims
Create a free account to see all 95 claims and to verify the 36 references still open.
- It may state two separate claims as one. 35
- Probably not a substantial claim. 11
Self-check
Percentages, sums and reported differences re-computed from the paper’s own numbers.
Each contradiction between two passages listed here was confirmed by an independent check.
Rated major: it would touch a result — a value a result rests on, reported and recomputed p-values on opposite sides of the significance level, two passages that conflict with no sign which is right, or a cited work retracted before this paper was published.
In the paper
§ Psychosocial outcomes in young adults with childhood traumatic brain injury: A 20‐year follow‐up study > METHODS > Measures
“scores within the ‘normal’ range were classified as favourable, whereas scores in the mild to extremely severe ranges were labelled less favourable.”
§ Psychosocial outcomes in young adults with childhood traumatic brain injury: A 20‐year follow‐up study > METHODS > Measures
“depression/anxiety (normal/mild vs. moderate to extremely severe)”
Rated major: it would touch a result — a value a result rests on, reported and recomputed p-values on opposite sides of the significance level, two passages that conflict with no sign which is right, or a cited work retracted before this paper was published.
In the paper
§ Psychosocial outcomes in young adults with childhood traumatic brain injury: A 20‐year follow‐up study > RESULTS > Aim 3: Factors associated with psychosocial outcomes in young adults with childhood TBI
“Being in a romantic relationship was significantly associated with younger age at injury (β = −.21, Wald χ 2 = 4.42, p = .035)”
§ Psychosocial outcomes in young adults with childhood traumatic brain injury: A 20‐year follow‐up study > RESULTS > Aim 3: Factors associated with psychosocial outcomes in young adults with childhood TBI
“| Age at injury | .19 | .13 | −.1, .5 | .143 | .08 | .09 | −.1, .3 | .387 | .21 | .10 | .0, .4 | .035 |”
Rated major: it would touch a result — a value a result rests on, reported and recomputed p-values on opposite sides of the significance level, two passages that conflict with no sign which is right, or a cited work retracted before this paper was published.
In the paper
§ Psychosocial outcomes in young adults with childhood traumatic brain injury: A 20‐year follow‐up study > DISCUSSION > Favourable psychosocial outcome areas and associated factors
“Four outcomes (25%) were classified as predominantly favourable, with 85%–100% of TBI participants showing positive outcomes: all three offending behaviour outcomes and satisfaction with ability to work.”
§ Psychosocial outcomes in young adults with childhood traumatic brain injury: A 20‐year follow‐up study > RESULTS > Aim 1: Favourable versus less favourable psychosocial outcomes in the TBI versus TDC groups
“The TBI group showed ‘predominantly favourable outcomes’ (≥80% reported positive outcomes) in the remaining domains, with the highest rates of positive outcomes observed for non‐use of marijuana (90.7%), absence of offending behaviours (90.7%–94.3%), and satisfaction with work (93.2%).”
Rated major: it would touch a result — a value a result rests on, reported and recomputed p-values on opposite sides of the significance level, two passages that conflict with no sign which is right, or a cited work retracted before this paper was published.
In the paper
§ Psychosocial outcomes in young adults with childhood traumatic brain injury: A 20‐year follow‐up study > DISCUSSION
“Across the 16 outcome domains assessed, 24%–87% of the TBI group showed vulnerabilities in 75% of areas—substantially higher than the 37.5% impacted in the typically developing control (TDC) group.”
§ Psychosocial outcomes in young adults with childhood traumatic brain injury: A 20‐year follow‐up study > RESULTS > Aim 1: Favourable versus less favourable psychosocial outcomes in the TBI versus TDC groups
“Figure 1 shows that of the 16 outcomes assessed, 50% were classified as ‘predominantly less favourable outcomes’ (i.e., ≥20% of participants reported difficulties or unmet needs) in the TBI group.”
Rated minor: it would not touch a result — a value no result rests on, a p-value that stays on the same side of the significance level, or a conflict that is clerical, resolved elsewhere in the paper, or outside its own findings.
In the paper
§ Psychosocial outcomes in young adults with childhood traumatic brain injury: A 20‐year follow‐up study > Abstract
“However, a substantial proportion (24%–87%) of participants reported less favourable outcomes in education, employment, overall QoL, general health, relationships, anxiety, tobacco use, and alcohol use.”
§ Psychosocial outcomes in young adults with childhood traumatic brain injury: A 20‐year follow‐up study > RESULTS > Aim 1: Favourable versus less favourable psychosocial outcomes in the TBI versus TDC groups
“more participants in the TBI group (16.7%) reporting poorer QoL compared to the control group (0%)”
3 more findings
Create a free account to see every finding of this check.
Citations
Cites
Skevington, S. M., Lotfy, M., & O'Connell, K. A. (2004) · Quality of Life Research · doi:10.1023/b:qure.0000018486.91360.00 · Cited by 4,686
Psychological Well-Being in Adult Life
Ryff, C. D. (1995) · Current Directions in Psychological Science · doi:10.1111/1467-8721.ep10772395 · Cited by 1,927
Psychometric properties of the Depression Anxiety Stress Scales (DASS) in clinical samples
Brown, T. A., Chorpita, B. F., Korotitsch, W., & Barlow, D. H. (1997) · Behaviour Research and Therapy · doi:10.1016/s0005-7967(96)00068-x · Cited by 1,860
Osman, A., Wong, J. L., Bagge, C. L., Freedenthal, S., Gutierrez, P. M., & Lozano, G. (2012) · Journal of Clinical Psychology · doi:10.1002/jclp.21908 · Cited by 1,064
SOCIAL: An integrative framework for the development of social skills.
Beauchamp, M. H., & Anderson, V. (2010) · Psychological Bulletin · doi:10.1037/a0017768 · Cited by 635
Self-citationDo children really recover better? Neurobehavioural plasticity after early brain insult
Anderson, V., Spencer-Smith, M., & Wood, A. (2011) · Brain · doi:10.1093/brain/awr103 · Cited by 584
Self-citationSariaslan, A., Sharp, D. J., D’Onofrio, B. M., Larsson, H., & Fazel, S. (2016) · PLOS Medicine · doi:10.1371/journal.pmed.1002103 · Cited by 262
Catroppa, C., Anderson, V. A., Morse, S. A., Haritou, F., & Rosenfeld, J. V. (2008) · Journal of Pediatric Psychology · doi:10.1093/jpepsy/jsn006 · Cited by 260
Self-citationAnderson, V., Godfrey, C., Rosenfeld, J. V., & Catroppa, C. (2012) · PEDIATRICS · doi:10.1542/peds.2011-0311 · Cited by 224 · cited 1×
“While functional outcomes (e.g., adaptive functioning) typically predict outcomes after childhood TBI (Anderson et al., 2012; Catroppa et al., 2008; Ryan et al., 2015), they did not do so in this young adult group, highlighting the need for further research on these relationships in adulthood.”
Self-citationHead injuries in children: a prospective five year follow-up.
Klonoff, H., Low, M. D., & Clark, C. F. (1977) · Journal of Neurology Neurosurgery & Psychiatry · doi:10.1136/jnnp.40.12.1211 · Cited by 206
Fazel, S., Lichtenstein, P., Grann, M., & Långström, N. (2011) · PLoS Medicine · doi:10.1371/journal.pmed.1001150 · Cited by 181
Rosema, S., Crowe, L., & Anderson, V. (2012) · Journal of Neurotrauma · doi:10.1089/neu.2011.2144 · Cited by 173
Self-citationAnderson, V., Brown, S., Newitt, H., & Hoile, H. (2009) · Journal of Head Trauma Rehabilitation · doi:10.1097/htr.0b013e3181ada830 · Cited by 172
Self-citationEmery, C. A., Barlow, K. M., Brooks, B. L., Max, J. E., Villavicencio-Requis, A., Gnanakumar, V., Robertson, H. L., Schneider, K., & Yeates, K. O. (2016) · The Canadian Journal of Psychiatry · doi:10.1177/0706743716643741 · Cited by 162
Quality of Life in Children and Adolescents Post-TBI: A Systematic Review and Meta-Analysis
Battista, A. M. D., Soo, C. A., Catroppa, C., & Anderson, V. A. (2012) · Journal of Neurotrauma · doi:10.1089/neu.2011.2157 · Cited by 143
Self-citationDiagnosis and Management of Mild Traumatic Brain Injury in Children: A Systematic Review
Lumba-Brown, A., Yeates, K. O., Sarmiento, K., Breiding, M. J., Haegerich, T. M., Gioia, G. A., Turner, M., Benzel, E. C., Suskauer, S. J., Giza, C. C., et al. (2018) · JAMA Pediatrics · doi:10.1001/jamapediatrics.2018.2847 · Cited by 127
Crowe, L. M., Catroppa, C., Babl, F. E., & Anderson, V. (2012) · PEDIATRICS · doi:10.1542/peds.2011-0438 · Cited by 119
Self-citationRecovery of memory function following traumatic brain injury in pre-school children
Vicki A. Anderson, C. C. (2000) · Brain Injury · doi:10.1080/026990500413704 · Cited by 111
The Prevalence of Traumatic Brain Injury Among Young Offenders in Custody: A Systematic Review
Hughes, N., Williams, W. H., Chitsabesan, P., Walesby, R., Mounce, L. T. A., & Clasby, B. (2015) · Journal of Head Trauma Rehabilitation · doi:10.1097/htr.0000000000000124 · Cited by 108
Social Competence at 6 Months Following Childhood Traumatic Brain Injury
Anderson, V. A., Beauchamp, M. H., Yeates, K. O., Crossley, L. H., Hearps, S. J. C., & Catroppa, C. (2013) · Journal of the International Neuropsychological Society · doi:10.1017/s1355617712001543 · Cited by 103
Self-citationSubstance Use and Related Harms Among Adolescents With and Without Traumatic Brain Injury
Ilie, G., Mann, R. E., Hamilton, H. A., Adlaf, E. M., Boak, A., Asbridge, M., Rehm, J. T., & Cusimano, M. D. (2014) · Journal of Head Trauma Rehabilitation · doi:10.1097/htr.0000000000000101 · Cited by 85
Noller, P., Seth‐Smith, M., Bouma, R., & Schweitzer, R. (1992) · Journal of Adolescence · doi:10.1016/0140-1971(92)90041-3 · Cited by 82
Educational skills: Long-term outcome and predictors following paediatric traumatic brain injury
Catroppa, C., Anderson, V. A., Muscara, F., Morse, S. A., Haritou, F., Rosenfeld, J. V., & Heinrich, L. M. (2009) · Neuropsychological Rehabilitation · doi:10.1080/09602010902732868 · Cited by 65
Self-citationCATROPPA, C., & ANDERSON, V. (2005) · Journal of the International Neuropsychological Society · doi:10.1017/s1355617705050101 · Cited by 64
Self-citationKennedy, E., Heron, J., & Munafò, M. (2017) · European Child & Adolescent Psychiatry · doi:10.1007/s00787-017-0975-1 · Cited by 64
Depression and depressive symptoms in pediatric traumatic brain injury: a scoping review
Laliberté Durish, C., Pereverseff, R. S., & Yeates, K. O. (2018) · Journal of Head Trauma Rehabilitation · doi:10.1097/htr.0000000000000343 · Cited by 63
Durber, C. M., Yeates, K. O., Taylor, H. G., Walz, N. C., Stancin, T., & Wade, S. L. (2017) · Neuropsychology · doi:10.1037/neu0000351 · Cited by 53
Fishbein, D. H., Dariotis, J. K., Ferguson, P. L., & Pickelsimer, E. E. (2014) · International Journal of Offender Therapy and Comparative Criminology · doi:10.1177/0306624x14554778 · Cited by 52
Jonsson, C. A., Horneman, G., & Emanuelson, I. (2004) · Brain Injury · doi:10.1080/02699050410001671900 · Cited by 51
What Contributes to Quality of Life in Adult Survivors of Childhood Traumatic Brain Injury?
Anderson, V., Brown, S., & Newitt, H. (2010) · Journal of Neurotrauma · doi:10.1089/neu.2009.1169 · Cited by 46
Self-citationPediatric traumatic brain injury and antisocial behavior: are they linked? A systematic review
Bellesi, G., Barker, E. D., Brown, L., & Valmaggia, L. (2019) · Brain Injury · doi:10.1080/02699052.2019.1641621 · Cited by 43
Ilie, G., Trenholm, M., Boak, A., Mann, R. E., Adlaf, E. M., Asbridge, M., Hamilton, H. A., Rehm, J. T., Rutledge, R. D. H., & Cusiman, M. D. (2020) · PLoS ONE · doi:10.1371/journal.pone.0229489 · Cited by 36
Ryan, N. P., Hughes, N., Godfrey, C., Rosema, S., Catroppa, C., & Anderson, V. A. (2015) · Journal of Head Trauma Rehabilitation · doi:10.1097/htr.0000000000000123 · Cited by 33
Self-citationGreenham, M., Botchway-Commey, E. N., Knight, S., Bonyhady, B., Tavender, E. J., Scheinberg, A. M., Anderson, V. A., & Muscara, F. (2020) · Disability and Rehabilitation · doi:10.1080/09638288.2020.1849425 · Cited by 32
Self-citationVerbal Ability and Language Outcome Following Traumatic Brain Injury in Early Childhood
Crowe, L. M., Anderson, V. A., Barton, S., Babl, F. E., & Catroppa, C. (2013) · Journal of Head Trauma Rehabilitation · doi:10.1097/htr.0b013e31829babfd · Cited by 31
Self-citationLopez, D. A., Christensen, Z. P., Foxe, J. J., Ziemer, L. R., Nicklas, P. R., & Freedman, E. G. (2022) · NeuroImage · doi:10.1016/j.neuroimage.2022.119626 · Cited by 30
McKinlay, A., Grace, R. C., McLellan, T., Roger, D., Clarbour, J., & MacFarlane, M. R. (2013) · Journal of Head Trauma Rehabilitation · doi:10.1097/htr.0000000000000000 · Cited by 29
Ryan, N. P., Noone, K., Godfrey, C., Botchway, E. N., Catroppa, C., & Anderson, V. (2019) · Annals of Physical and Rehabilitation Medicine · doi:10.1016/j.rehab.2019.06.014 · Cited by 29
Self-citationRyan, N. P., Reyes, J., Crossley, L., Beauchamp, M. H., Catroppa, C., & Anderson, V. A. (2019) · Journal of Neurotrauma · doi:10.1089/neu.2018.6308 · Cited by 26
Self-citationTuerk, C., Gagner, C., Dégeilh, F., Bellerose, J., Lalonde, G., Landry-Roy, C., Séguin, M., Beaumont, L. D., Gravel, J., Bernier, A., et al. (2020) · Brain Research · doi:10.1016/j.brainres.2020.147061 · Cited by 25
Lobstein, T., & Jewell, J. M. (2021) · Obesity Reviews · doi:10.1111/obr.13363 · Cited by 24
Albicini, M., & McKinlay, A. (2015) · InTech eBooks · doi:10.5772/60426 · Cited by 23
Psychosocial functioning at 4-years after pediatric mild traumatic brain injury
Jones, K. M., Ameratunga, S., Starkey, N. J., Theadom, A., Barker-Collo, S., Ikeda, T., & Feigin, V. L. (2021) · Brain Injury · doi:10.1080/02699052.2021.1878553 · Cited by 21
Botchway, E. N., Godfrey, C., Anderson, V., Nicholas, C. L., & Catroppa, C. (2019) · Journal of Neurotrauma · doi:10.1089/neu.2018.5743 · Cited by 19
Self-citationBlaha, R. Z., Arnett, A. B., Kirkwood, M. W., Taylor, H. G., Stancin, T., Brown, T. M., & Wade, S. L. (2014) · Journal of Head Trauma Rehabilitation · doi:10.1097/htr.0000000000000059 · Cited by 18
von Steinbüchel, N., Zeldovich, M., Greving, S., Olabarrieta‐Landa, L., Krenz, U., Timmermann, D., Koerte, I. K., Bonfert, M., Berweck, S., Kieslich, M., et al. (2023) · Journal of Clinical Medicine · doi:10.3390/jcm12154898 · Cited by 18
Rosema, S., Muscara, F., Anderson, V., Godfrey, C., Eren, S., & Catroppa, C. (2014) · Social Care and Neurodisability · doi:10.1108/scn-06-2013-0022 · Cited by 16
Self-citationImpact of childhood traumatic brain injury on educational outcomes and adult standard of living
Netto, R. K. D., & McKinlay, A. (2019) · Disability and Rehabilitation · doi:10.1080/09638288.2019.1637948 · Cited by 16
Visnick, M. J., Pell, J. P., Mackay, D. F., Clark, D., King, A., & Fleming, M. (2023) · PLOS Medicine · doi:10.1371/journal.pmed.1004204 · Cited by 16
Objective sleep outcomes 20 years after traumatic brain injury in childhood
Botchway-Commey, E. N., Godfrey, C., Nicholas, C. L., Hearps, S. J. C., Anderson, V. A., & Catroppa, C. (2019) · Disability and Rehabilitation · doi:10.1080/09638288.2019.1578422 · Cited by 13
Self-citationAliaga, Á., Bracho, M.-J., Romero, M., Saldías, M. J., Jofré, X., & Salas, C. (2023) · Neuropsychological Rehabilitation · doi:10.1080/09602011.2023.2224031 · Cited by 12
Khan, N., Ryan, N. P., Crossley, L., Hearps, S., Catroppa, C., & Anderson, V. (2023) · Journal of Neurotrauma · doi:10.1089/neu.2022.0420 · Cited by 12
Self-citationDeterminants of Quality of Life after Pediatric Traumatic Brain Injury
Tekerek, N. Ü., Dursun, O., Karalök, Z. S., Köker, A., Duman, Ö., & Haspolat, Ş. (2022) · Journal of Pediatric Intensive Care · doi:10.1055/s-0042-1758475 · Cited by 9
Carr, H., Hall, J., Eisenbarth, H., & Brandt, V. C. (2023) · European Child & Adolescent Psychiatry · doi:10.1007/s00787-023-02175-y · Cited by 6
Mood and anxiety symptoms following pediatric mild traumatic brain injury: a scoping review.
Sabir, S., & Malhi, R. (2023) · PubMed Central · Cited by 6
Atay, C., Ryan, S. J., & Lewis, F. M. (2015) · Journal of Head Trauma Rehabilitation · doi:10.1097/htr.0000000000000182 · Cited by 4
Carr, H., Brandt, V. C., Golm, D., & Hall, J. (2023) · Development and Psychopathology · doi:10.1017/s0954579423001062 · Cited by 3
Research works printed but not linked: 2
- Daniel A. E., 1983, Power, privilege, and prestige: Occupations in Australia
- Greenhalgh E. M., 2024, Tobacco in Australia: Facts and issues
Cited by
Still being checked.
Metadata
- Authors
- Botchway‐Commey, E., Ryan, N. P., Crowe, L., Godfrey, C., Macleod, H., Hearps, S., Anderson, V. A., & Catroppa, C.
- Affiliations
- Murdoch Children's Research Institute Melbourne Victoria Australia
- Royal Children's Hospital (AU)
- Murdoch Children's Research Institute (AU)
- ORCID
- Venue
- Journal of Neuropsychology
- Publisher
- Wiley
- Published
- 2026-04-15
- Volume
- 20
- Issue
- 2
- Pages
- 445-467
- ISSN
- 1748-6645 (ISSN-L)
- 1748-6653
- PMC
- PMC13250358
- OpenAlex
- W7154490355
- Semantic Scholar
- 023d8d9e88e3ebe7f1a5ce40f1f50324e2416a89
- Cited by
- 0
- References
- 57
- FWCI
- 0.00
- Type
- journal article
- Language
- en
- Open access
- hybrid
- doi.org
- Licence
- cc-by
- creativecommons.org/licenses/by/4.0/ (vor)
- doi.wiley.com/10.1002/tdm_license_1.1 (tdm)
- Locations
- Journal of Neuropsychology (publishedVersion, cc-by)
- PubMed Central (publishedVersion, cc-by)
- PubMed (publishedVersion)
- Deakin Research Online (Deakin University) (cc-by)
- Topics
- Health Sciences › Medicine › Clinical Neurology › Traumatic Brain Injury Research
- Health Sciences › Medicine › Clinical Neurology › Traumatic Brain Injury and Neurovascular Disturbances
- Physical Sciences › Engineering › Biomedical Engineering › Automotive and Human Injury Biomechanics
- Keywords
- pediatric traumatic brain injury, psychosocial outcomes, young adults, quality of life, employment, relationships, mental health, offending, substance use, tobacco use, alcohol consumption, socioeconomic status, age at injury, long-term follow-up, mild traumatic brain injury
- MeSH terms
- Brain Injuries, Traumatic, Psychosocial Functioning, Adult, Employment, Female, Follow-Up Studies, Humans, Male, Quality of Life, Surveys and Questionnaires, Substance-Related Disorders, Young Adult
About these checks
Registry, retraction, Cites and statistics results are computed, not judged, with one exception: a printed reference that no index lists is read once by a model before it counts as a citation error. Claims are extracted by a model and kept only when their quote appears verbatim in the text; each cited source is then checked, with a model’s help, for whether it says what the claim relies on. Those verdicts can be wrong — read the claim’s quote and the cited source before relying on one.
A language model drew the claims from the paper on 2026-11-14, under version 3 of the claim definition (model deepseek-v4.1-flash, prompt extract-v3).
A second model labelled each claim on 2026-11-14 (model jev-1.13-20260917, definition revision gold-guideline-v0.2).
Statistics and arithmetic are recomputed, not judged.
Confidence bands are shown only for fields calibrated on our annotated test set. None is calibrated yet, so no band is shown.
What counts as a claim ›How we measure confidence ›How we check this ›
Are you an author, or do you see a problem with this page? Request a review
Data sources
Bibliographic data: Semantic Scholar, OpenAlex, Crossref.
Contains information from the Semantic Scholar Academic Graph Datasets, made available under the ODC Attribution License (ODC-BY 1.0).
Semantic Scholar’s data is described in: Kinney, R., et al. (2023). The Semantic Scholar Open Data Platform. arXiv:2301.10140.
