

The DOI matches its Crossref record; 39 of the 39 references it cites were found in a registry or an index.
Measurement of absorption and reduced scattering coefficients in Asian human epidermis, dermis, and subcutaneous fat tissues in the 400- to 1100-nm wavelength range for optical penetration depth and energy deposition analysis
Open accessAbstract
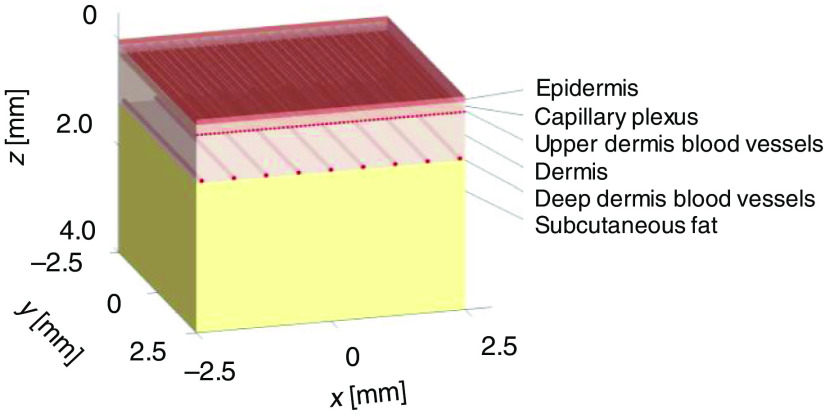
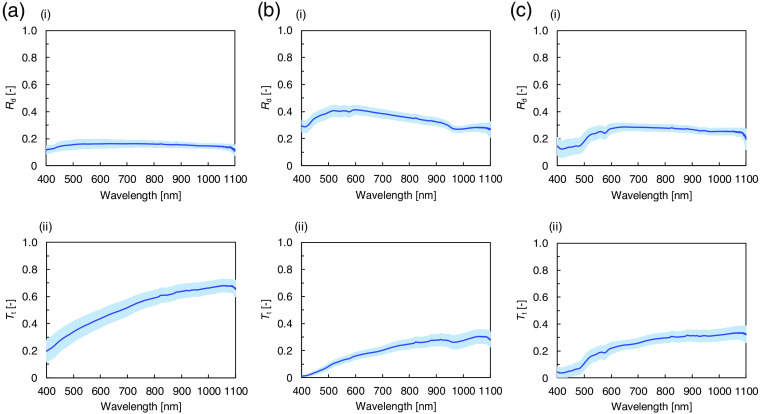
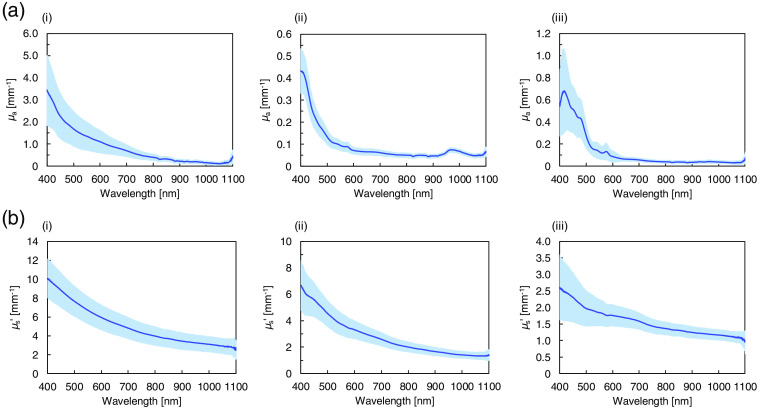
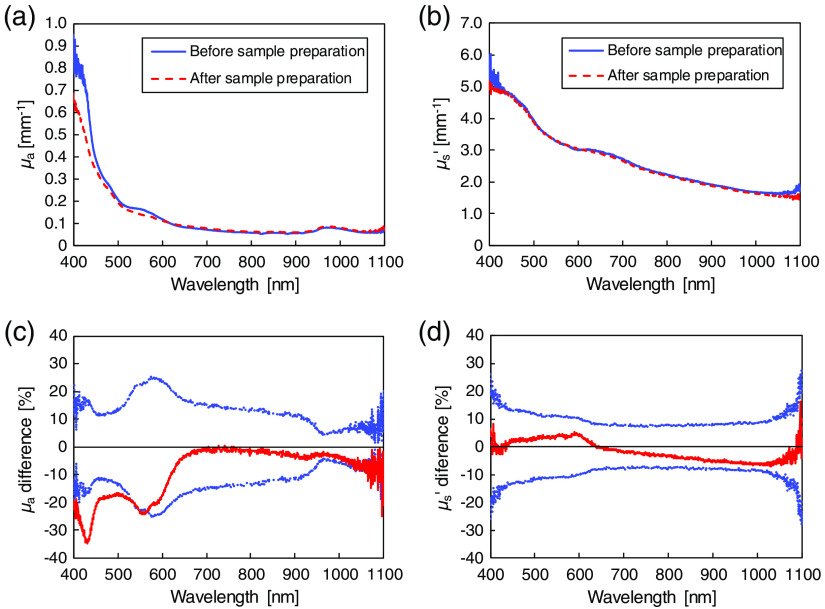
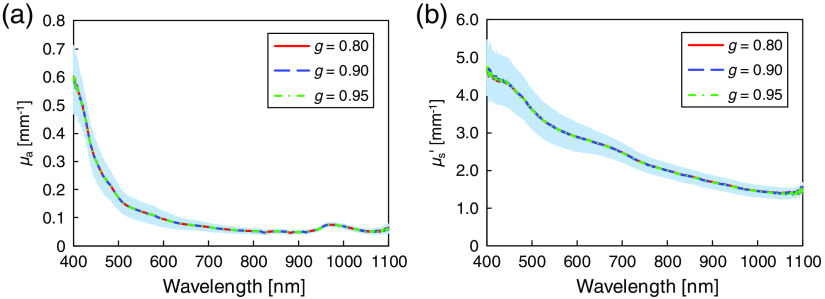
Significance: In laser therapy and diagnosis of skin diseases, the irradiated light distribution, which is determined by the absorption coefficient μa and reduced scattering coefficient μs′ of the epidermis, dermis, and subcutaneous fat, affects the treatment outcome and diagnosis accuracy. Although values for μa and μs′ have been reported, detailed analysis for Asian skin tissues is still lacking. Aim: We present μa and μs′ measurements of Asian skin tissues in the 400- to 1100-nm wavelength range for evaluating optical penetration depth and energy deposition. Approach: The measurements with Asian human skin samples are performed employing a double integrating sphere spectrometric system and an inverse Monte Carlo technique. Using the measured parameters, the optical penetration depth and energy deposition are quantitatively analyzed. Results: The μa of the epidermis layer varies among different ethnic groups, while the μa of the other layers and the μs′ of all of the layers exhibit almost no differences. The analysis reveals that the optical penetration depth and the energy deposition affect the photodynamic therapy treatment depth and the heat production in skin tissue, respectively. Conclusions: The experimentally measured values of μa and μs′ for Asian skin tissues are presented, and the light behavior in Asian skin tissues is analyzed using a layered tissue model.
Overview
The claims and statistics of this paper haven’t been checked yet.
Run the check — free, no account needed. It reads the open-access text and checks the sources it cites.
Integrity signals
Registry
Cites
Statistics
Figures
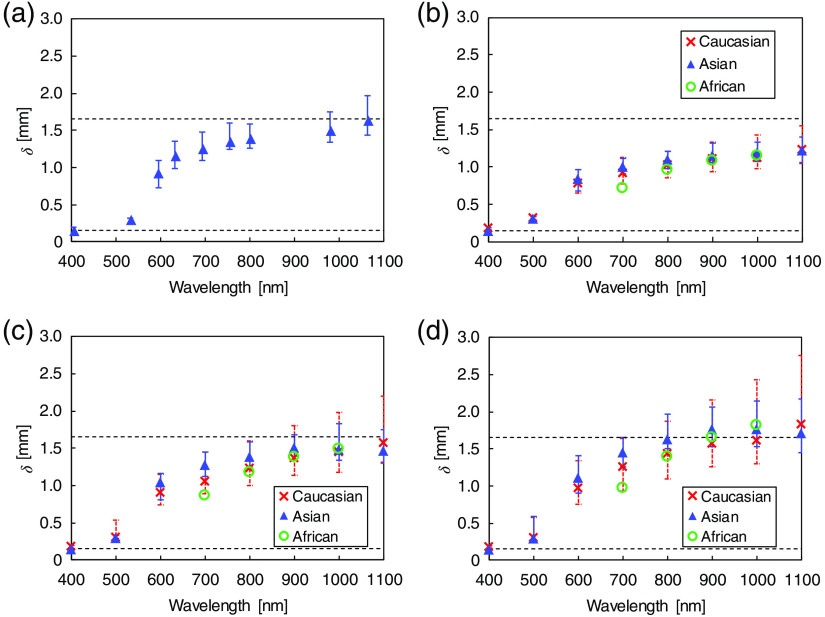
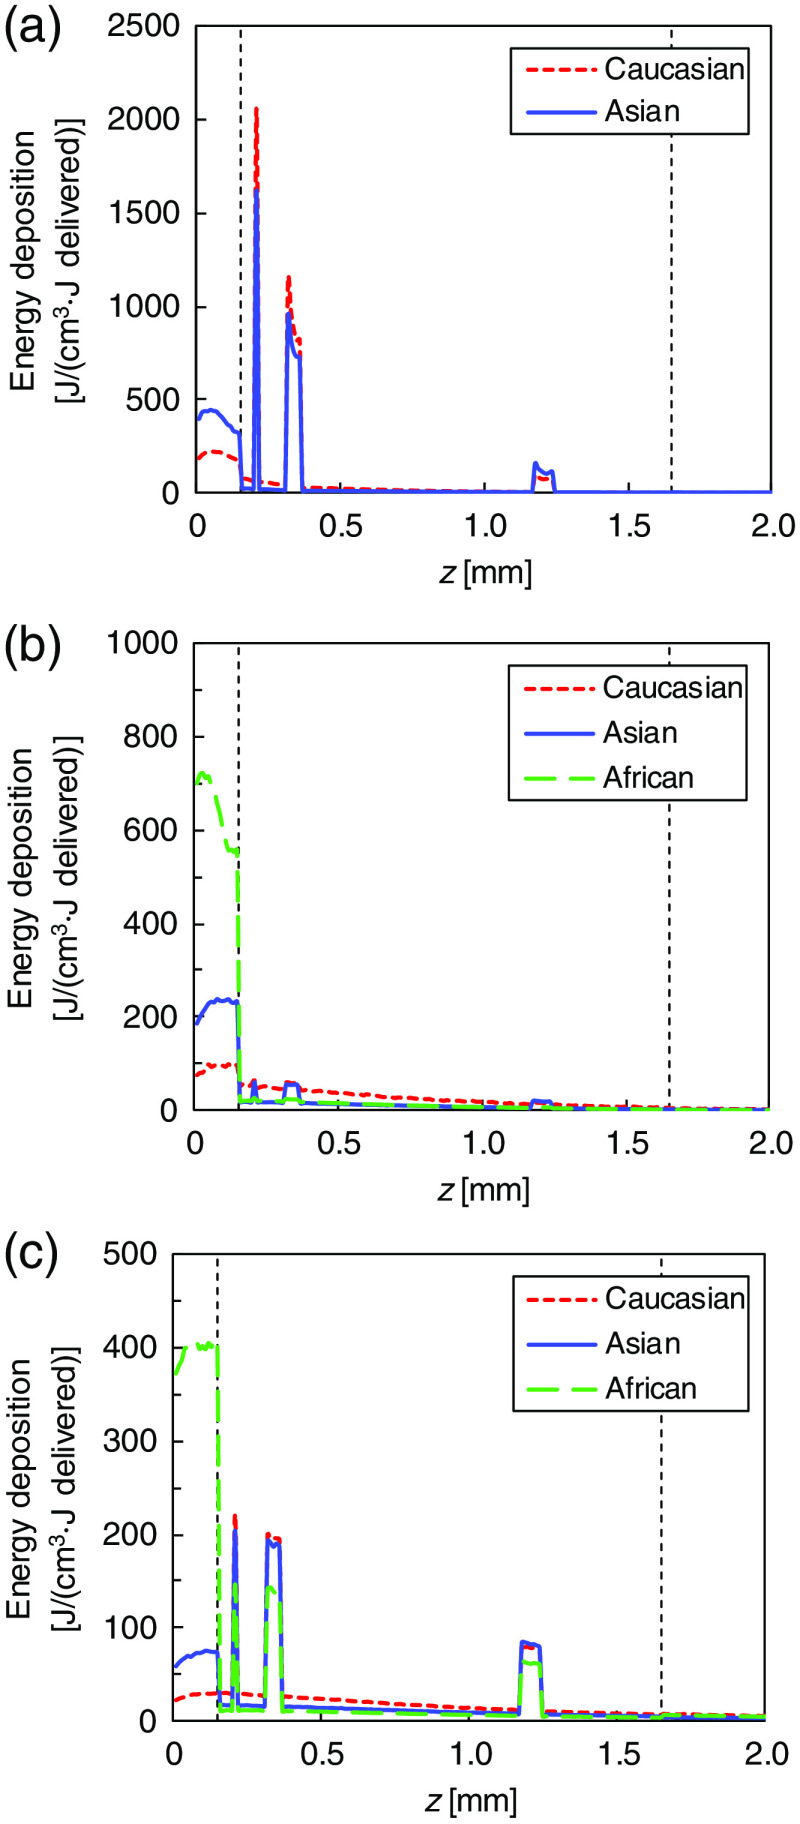
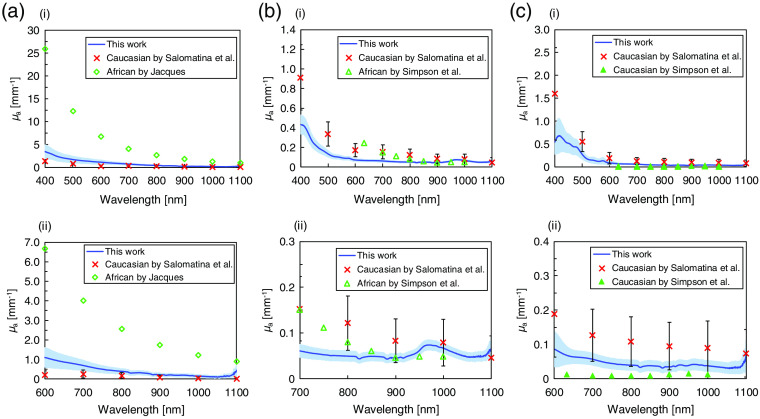
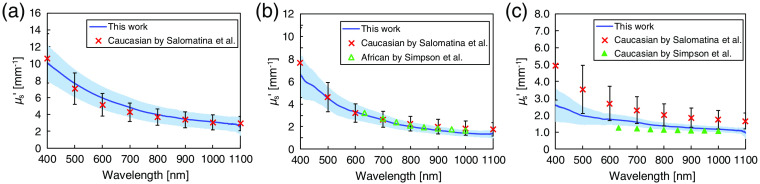
Verification
Claims the paper makes
The claims and statistics of this paper haven’t been checked yet.
Run the check — free, no account needed. It reads the open-access text and checks the sources it cites.
Claims other papers make about this one
Each is checked against this paper’s own text: does it say what the citing paper says it does?
In the citing paper
“Scattering and absorption in the skin tend to decrease with increasing wavelength.27–29”
From Effect of skin color on optical properties and the implications for medical optical technologies: a review (2024) · cites this paper as [29]
In the citing paper
“At 405 - 532 nm, the light penetrates to a maximum depth of ∼0.3 mm reaching the upper part of dermis [53].”
From Relevance and utility of the in-vivo and ex-vivo optical properties of the skin reported in the literature: a review [Invited] (2023) · cites this paper as [53]
In the citing paper
“At the wavelength spectrum of 405 nm - 1064 nm, absorption ranged from 3.32 mm-1 - 0.13 mm-1 and reduced scattering ranged from 9.95 mm-1 - 2.85 mm-1 in the epidermis (standard deviations for both coefficients tended to reduce with increasing wavelength).”
From Relevance and utility of the in-vivo and ex-vivo optical properties of the skin reported in the literature: a review [Invited] (2023) · cites this paper as [53]
In the citing paper
“Peak absorption and scattering coefficients for all skin layers was at 405 nm steadily reducing with increasing wavelength with the greatest absorption and scattering coefficients being in the epidermis.”
From Relevance and utility of the in-vivo and ex-vivo optical properties of the skin reported in the literature: a review [Invited] (2023) · cites this paper as [53]
In the citing paper
“Beyond 980 nm, light has the potential to penetrate the subcutaneous tissue travelling a distance of ∼1.65 mm.”
From Relevance and utility of the in-vivo and ex-vivo optical properties of the skin reported in the literature: a review [Invited] (2023) · cites this paper as [53]
Self-check
Percentages, sums and reported differences re-computed from the paper’s own numbers.
The self-check needs the paper’s full text.
Citations
Cites
Optical properties of biological tissues: A review
Jacques, S. L. (2013) · Physics in Medicine and Biology · doi:10.1088/0031-9155/58/11/r37 · Cited by 4,008
Selective Photothermolysis: Precise Microsurgery by Selective Absorption of Pulsed Radiation
Anderson, R. R., & Parrish, J. A. (1983) · Science · doi:10.1126/science.6836297 · Cited by 3,477
MCML—Monte Carlo modeling of light transport in multi-layered tissues
Wang, L. V., Jacques, S. L., & Zheng, L. (1995) · Computer Methods and Programs in Biomedicine · doi:10.1016/0169-2607(95)01640-f · Cited by 3,330
Anderson, R. R., & Parrish, J. A. (1981) · Journal of Investigative Dermatology · doi:10.1111/1523-1747.ep12479191 · Cited by 2,456
Tissue Optics: Light Scattering Methods and Instruments for Medical Diagnosis
Tuchin, V. V. (2015) · SPIE eBooks · doi:10.1117/3.1003040 · Cited by 1,384
Cancer cell–selective in vivo near infrared photoimmunotherapy targeting specific membrane molecules
Mitsunaga, M., Ogawa, M., Kosaka, N., Rosenblum, L. T., Choyke, P. L., & Kobayashi, H. (2011) · Nature Medicine · doi:10.1038/nm.2554 · Cited by 1,064
Ash, C., Dubec, M., Donne, K., & Bashford, T. (2017) · Lasers in Medical Science · doi:10.1007/s10103-017-2317-4 · Cited by 1,040
OPTICAL PROPERTIES OF SKIN, SUBCUTANEOUS, AND MUSCLE TISSUES: A REVIEW
Bashkatov, A. N., Genina, E. A., & Tuchin, V. V. (2011) · Journal of Innovative Optical Health Sciences · doi:10.1142/s1793545811001319 · Cited by 765
Yaroslavsky, A. N., Schulze, P. C., Yaroslavsky, I. V., Schober, R., Ulrich, F., & Schwarzmaier, H.-J. (2002) · Physics in Medicine and Biology · doi:10.1088/0031-9155/47/12/305 · Cited by 656
Simpson, C. R., Kohl, M., Essenpreis, M., & Cope, M. (1998) · Physics in Medicine and Biology · doi:10.1088/0031-9155/43/9/003 · Cited by 651
Salomatina, E. V., Jiang, B., Novak, J., & Yaroslavsky, A. N. (2006) · Journal of Biomedical Optics · doi:10.1117/1.2398928 · Cited by 599
Optical absorption of hemoglobin
Prahl, S. A. (1999) · Medical Entomology and Zoology · Cited by 579
Flock, S. T., Patterson, M. S., Wilson, B. C., & Wyman, D. R. (1989) · IEEE Transactions on Biomedical Engineering · doi:10.1109/tbme.1989.1173624 · Cited by 490
Alexandrakis, G., Rannou, F. R., & Chatziioannou, A. F. (2005) · Physics in Medicine and Biology · doi:10.1088/0031-9155/50/17/021 · Cited by 466
A literature review and novel theoretical approach on the optical properties of whole blood
Bosschaart, N., Edelman, G. J., Aalders, M. C. G., van Leeuwen, T. G. J. M., & Faber, D. J. (2013) · Lasers in Medical Science · doi:10.1007/s10103-013-1446-7 · Cited by 463
Mallidi, S., Anbil, S. R., Bulin, A., Obaid, G., Ichikawa, M., & Hasan, T. G. (2016) · Theranostics · doi:10.7150/thno.16183 · Cited by 453
Meglinski, I. V., & Matcher, S. J. (2002) · Physiological Measurement · doi:10.1088/0967-3334/23/4/312 · Cited by 408
Ethnic variation in melanin content and composition in photoexposed and photoprotected human skin
Alaluf, S., Atkins, D., Barrett, K., Blount, M., Carter, N., & Heath, A. (2002) · Pigment Cell Research · doi:10.1034/j.1600-0749.2002.1o071.x · Cited by 262
Effects of compression on soft tissue optical properties
Chan, E. K., Sorg, B., Protsenko, D., O'Neil, M., Motamedi, M., & Welch, A. J. (1996) · IEEE Journal of Selected Topics in Quantum Electronics · doi:10.1109/2944.577320 · Cited by 256
Zhu, T. C., Finlay, J. C., & Hahn, S. M. (2004) · Journal of Photochemistry and Photobiology B Biology · doi:10.1016/j.jphotobiol.2004.09.013 · Cited by 218
Computer simulation of the skin reflectance spectra
Meglinski, I. V., & Matcher, S. J. (2002) · Computer Methods and Programs in Biomedicine · doi:10.1016/s0169-2607(02)00099-8 · Cited by 179
Biomechanical Modeling of Refractive Corneal Surgery
Alastrué, V., Calvo, B., Peña, E., & Doblaré, M. (2005) · Journal of Biomechanical Engineering · doi:10.1115/1.2132368 · Cited by 152
Alexis, A. F. (2013) · British Journal of Dermatology · doi:10.1111/bjd.12526 · Cited by 143
In vivo determination of skin near-infrared optical properties using diffuse optical spectroscopy
Tseng, S.-H., Grant, A., & Durkin, A. J. (2008) · Journal of Biomedical Optics · doi:10.1117/1.2829772 · Cited by 139
Jacques, S. L. (2014) · Photoacoustics · doi:10.1016/j.pacs.2014.09.001 · Cited by 129
Mustafa, F. H., & Jaafar, M. S. (2012) · Indian Journal of Physics · doi:10.1007/s12648-012-0213-0 · Cited by 90
Subcutaneous adipose tissue response to a non-invasive hyperthermic treatment using a 1,060 nm laser
Decorato, J. W., Chen, B., & Sierra, R. A. (2017) · Lasers in Surgery and Medicine · doi:10.1002/lsm.22625 · Cited by 71
The effect of preparation technique on the optical parameters of biological tissue
Roggan, A., Schädel, D., Netz, U. J., Ritz, J.-P., Germer, C.-T., & Müller, G. (1999) · Applied Physics B · doi:10.1007/s003400050833 · Cited by 63
Ohshiro, T., Ohshiro, T., Sasaki, K., & Kishi, K. (2016) · LASER THERAPY · doi:10.5978/islsm.16-or-07 · Cited by 61
Honda, N., Ishii, K., Kajimoto, Y., Kuroiwa, T., & Awazu, K. (2018) · Journal of Biomedical Optics · doi:10.1117/1.jbo.23.7.075006 · Cited by 57
Self-citationJonasson, H., Fredriksson, I., Bergstrand, S., Östgren, C. J., Larsson, M., & Strömberg, T. (2018) · Journal of Biomedical Optics · doi:10.1117/1.jbo.23.12.121608 · Cited by 52
Tsui, S.-Y., Wang, C.-Y., Huang, T.-H., & Sung, K. (2018) · Biomedical Optics Express · doi:10.1364/boe.9.001531 · Cited by 48
Alegre‐Sanchez, A., Jimenez-Gomez, N., Moreno‐Arrones, Ó. M., Fonda‐Pascual, P., Pérez‐García, B., Jaén‐Olasolo, P., & Boixeda, P. (2018) · Lasers in Medical Science · doi:10.1007/s10103-018-2459-z · Cited by 42
Sevilha-Santos, L., Júnior, A. C. M. D. S., Medeiros-Silva, V., Bergmann, J. O., da Silva, E. F., Segato, L. F., Arabi, A. Y. M., de Paula, N. A., Sampaio, R. N. R., de Lima, B. D., et al. (2018) · Clinical Microbiology and Infection · doi:10.1016/j.cmi.2018.04.025 · Cited by 32
Лиу, Б., Farrell, T. J., & Patterson, M. S. (2012) · Journal of Biomedical Optics · doi:10.1117/1.jbo.17.8.088001 · Cited by 25
Nasouri, B., Murphy, T. E., & Berberoğlu, H. (2014) · Journal of Biomedical Optics · doi:10.1117/1.jbo.19.7.075003 · Cited by 20
Paquit, V., Mériaudeau, F., Price, J. R., & Tobin, K. W. (2008) · Annual International Conference of the IEEE Engineering in Medicine and Biology Society (EMBC) · doi:10.1109/iembs.2008.4649186 · Cited by 17
In silico Evaluation of Thermal Skin Damage Caused by Picosecond Laser Irradiation
Shimojo, Y., Nishimura, T., Hazama, H., Nobuhiro, I. T. O., & Awazu, K. (2019) · Optics in the Life Sciences · doi:10.1364/boda.2019.ds1a.7 · Cited by 6
Self-citationVerdel, N., Tanevski, J., Džeroski, S., & Majaron, B. (2019) · Novel Biophotonics Techniques and Applications · doi:10.1117/12.2526997 · Cited by 5
Cited by
Sorted by citations
Wang, L., Cao, Z., Zhang, M., Lin, S., & Liu, J. (2021) · Advanced Materials · doi:10.1002/adma.202106669 · Cited by 140
Setchfield, K., Gorman, A., Simpson, A. H. R. W., Somekh, M. G., & Wright, A. J. (2024) · Journal of Biomedical Optics · doi:10.1117/1.jbo.29.1.010901 · Cited by 72
Investigating the origin of photoplethysmography using a multiwavelength Monte Carlo model
Chatterjee, S., Budidha, K., & Kyriacou, P. A. (2020) · Physiological Measurement · doi:10.1088/1361-6579/aba008 · Cited by 67
Setchfield, K., Gorman, A., Simpson, A. H. R. W., Somekh, M. G., & Wright, A. J. (2023) · Biomedical Optics Express · doi:10.1364/boe.493588 · Cited by 49
Chen, T., Liu, L., Ma, X., Zhang, Y., Liu, H., Zheng, R., Ren, J., Zhou, H., Ren, Y., Gao, R., et al. (2021) · IEEE Transactions on Biomedical Engineering · doi:10.1109/tbme.2021.3113764 · Cited by 46
Metadata
- Authors
- Shimojo, Y., Nishimura, T., Hazama, H., Ozawa, T., & Awazu, K.
- Affiliations
- The University of Osaka (JP)
- Osaka City University (JP)
- Corresponding author
- Shimojo, Yu
- Nishimura, Takahiro
- Venue
- Journal of Biomedical Optics
- Publisher
- SPIE-Intl Soc Optical Eng
- Published
- 2020-04-30
- Volume
- 25
- Issue
- 04
- Pages
- 1-14
- ISSN
- 1083-3668 (ISSN-L)
- 1560-2281
- PMC
- PMC7191311
- OpenAlex
- W3023157917
- Cited by
- 132
- References
- 39
- Citations by year
- 2026: 20 · 2025: 29 · 2024: 26 · 2023: 21 · 2022: 19 · 2021: 13 · 2020: 4
- FWCI
- 6.94
- Type
- journal article
- Language
- en
- Open access
- gold
- doi.org
- Licence
- Locations
- Journal of Biomedical Optics (publishedVersion, cc-by)
- PubMed Central (publishedVersion, cc-by)
- PubMed (publishedVersion)
- Funders
- JSPS KAKENHI (19K22966, 19K12822)
- Japan Society for the Promotion of Science (19K22966, 19K12822)
- Topics
- Health Sciences › Medicine › Radiology, Nuclear Medicine and Imaging › Optical Imaging and Spectroscopy Techniques
- Life Sciences › Biochemistry, Genetics and Molecular Biology › Cancer Research › Photodynamic Therapy Research Studies
- Life Sciences › Biochemistry, Genetics and Molecular Biology › Biophysics › Spectroscopy Techniques in Biomedical and Chemical Research
- Keywords
- absorption coefficient, reduced scattering coefficient, Asian skin, human epidermis, dermis, subcutaneous adipose tissue, optical penetration depth, energy deposition, photodynamic therapy, laser therapy, skin diseases, inverse Monte Carlo, layered tissue model, wavelength dependence
- MeSH terms
- Epidermis, Humans, Monte Carlo Method, Scattering, Radiation, Dermis, Subcutaneous Fat
About these checks
Registry, retraction, Cites and statistics results are computed, not judged, with one exception: a printed reference that no index lists is read once by a model before it counts as a citation error. Claims are extracted by a model and kept only when their quote appears verbatim in the text; each cited source is then checked, with a model’s help, for whether it says what the claim relies on. Those verdicts can be wrong — read the claim’s quote and the cited source before relying on one.
Statistics and arithmetic are recomputed, not judged.
Confidence bands are shown only for fields calibrated on our annotated test set. None is calibrated yet, so no band is shown.
What counts as a claim ›How we measure confidence ›How we check this ›
Are you an author, or do you see a problem with this page? Request a review
