

The DOI matches its Crossref record; 100 of the 100 references it cites were found in a registry or an index.
Genomics and epidemiology of the P.1 SARS-CoV-2 lineage in Manaus, Brazil
Open accessPublished version of a preprint
Abstract
Unmitigated spread in Brazil: Despite an extensive network of primary care availability, Brazil has suffered profoundly during the severe acute respiratory syndrome coronavirus 2 (SARS-CoV-2) pandemic. Using daily data from state health offices, Castro et al. analyzed the pattern of spread of COVID-19 cases and deaths in the country from February to October 2020. Clusters of deaths before cases became apparent indicated unmitigated spread. SARS-CoV-2 circulated undetected in Brazil for more than a month as it spread north from Sã o Paulo. In Manaus, transmission reached unprecedented levels after a momentary respite in mid-2020. Faria et al. tracked the evolution of a new, more aggressive lineage called P.1, which has 17 mutations, including three (K417T, E484K, and N501Y) in the spike protein. After a period of accelerated evolution, this variant emerged in Brazil during November 2020. Coupled with the emergence of P.1, disease spread was accelerated by stark local inequalities and political upheaval, which compromised a prompt federal response. Science , abh1558 and abh2644, this issue p. 821 and p. 815
Overview
The claims and statistics of this paper haven’t been checked yet.
Run the check — free, no account needed. It reads the open-access text and checks the sources it cites.
Integrity signals
Registry
Cites
Statistics
Figures
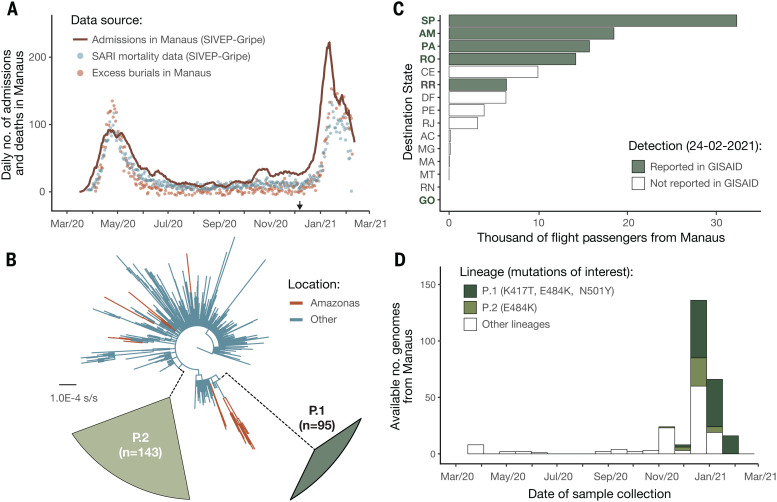
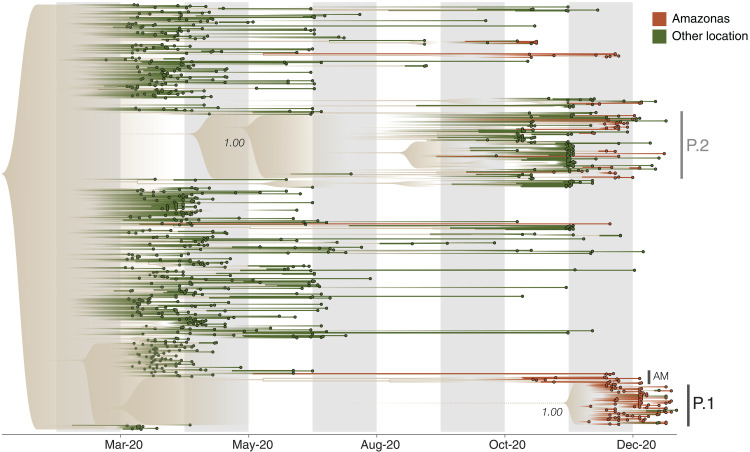
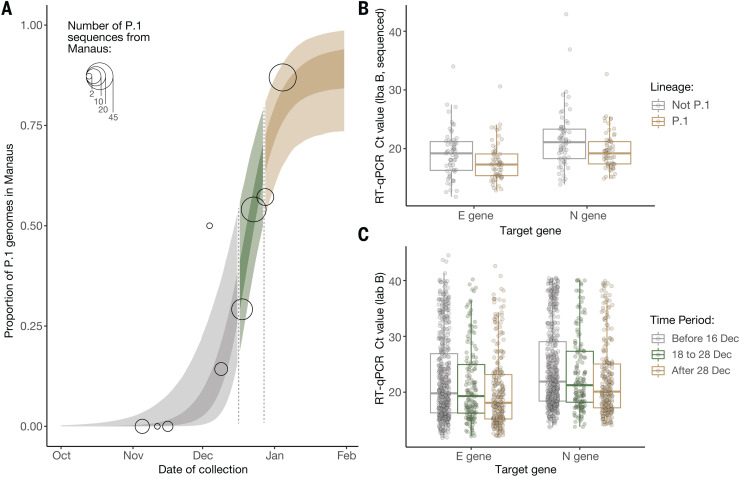
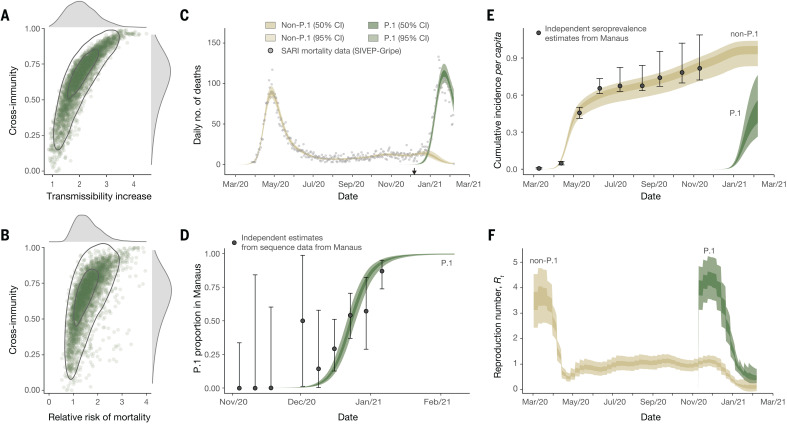
Verification
Claims the paper makes
The claims and statistics of this paper haven’t been checked yet.
Run the check — free, no account needed. It reads the open-access text and checks the sources it cites.
Claims other papers make about this one
Each is checked against this paper’s own text: does it say what the citing paper says it does?
In the citing paper
“The past several months have witnessed the emergence of four SArS-cov-2 variants of concern (Alpha, beta, Gamma and Delta)”
From The biological and clinical significance of emerging SARS-CoV-2 variants (2021) · cites this paper as [19]
In the citing paper
“The Gamma variant contains the RBD mutations N501Y, E484K and K417T (ref. 19 ).”
From The biological and clinical significance of emerging SARS-CoV-2 variants (2021) · cites this paper as [19]
In the citing paper
“As the Gamma variant was associated with a surge of infections in a region of Brazil estimated to have achieved a high infection rate, it is suspected of being able to infect and cause illness in persons previously infected with other variants 19,29,30 .”
From The biological and clinical significance of emerging SARS-CoV-2 variants (2021) · cites this paper as [19]
In the citing paper
“It was estimated to result in virus levels 3-4 times higher than earlier variants and to be responsible for an estimated 1.1-fold to 1.8-fold higher mortality 19 .”
From The biological and clinical significance of emerging SARS-CoV-2 variants (2021) · cites this paper as [19]
Self-check
Percentages, sums and reported differences re-computed from the paper’s own numbers.
The self-check needs the paper’s full text.
Citations
Cites
The Sequence Alignment/Map format and SAMtools
Li, H., Handsaker, B., Wysoker, A., Fennell, T., Ruan, J., Homer, N., Marth, G., Abecasis, G., Durbin, R., & 1000 Genome Project Data Processing Subgroup (2009) · Bioinformatics · doi:10.1093/bioinformatics/btp352 · Cited by 62,041
MAFFT Multiple Sequence Alignment Software Version 7: Improvements in Performance and Usability
Katoh, K., & Standley, D. M. (2013) · Molecular Biology and Evolution · doi:10.1093/molbev/mst010 · Cited by 46,209
IQ-TREE 2: New Models and Efficient Methods for Phylogenetic Inference in the Genomic Era
Minh, B. Q., Schmidt, H. A., Chernomor, O., Schrempf, D., Woodhams, M. D., von Haeseler, A., & Lanfear, R. (2020) · Molecular Biology and Evolution · doi:10.1093/molbev/msaa015 · Cited by 16,873
Posterior summarization in Bayesian phylogenetics using tracer 1.7
Rambaut, A., Drummond, A. J., Xie, D., Baele, G., & Suchard, M. A. (2018) · Systematic Biology · doi:10.1093/sysbio/syy032 · Cited by 11,159
Self-citationEvolution of Protein Molecules
JUKES, T. H., & CANTOR, C. R. (1969) · Mammalian Protein Metabolism · doi:10.1016/b978-1-4832-3211-9.50009-7 · Cited by 11,032
Dating of the human–ape splitting by a molecular clock of mitochondrial DNA.
Hasegawa, M., Kishino, H., & Yano, T.-A. (1985) · Journal of Molecular Evolution · doi:10.1007/bf02101694 · Cited by 8,687
Structure of the SARS-CoV-2 spike receptor-binding domain bound to the ACE2 receptor
Lan, J., Ge, J., Yu, J., Shan, S., Zhou, H., Fan, S., Zhang, Q., Shi, X., Wang, Q., Zhang, L., et al. (2020) · Nature · doi:10.1038/s41586-020-2180-5 · Cited by 5,983
Bayesian phylogenetic and phylodynamic data integration using BEAST 1.10
Suchard, M. A., Lemey, P., Baele, G., Ayres, D. L., Drummond, A. J., & Rambaut, A. (2018) · Virus Evolution · doi:10.1093/ve/vey016 · Cited by 3,749
Self-citationEstimating the effects of non-pharmaceutical interventions on COVID-19 in Europe
Flaxman, S. R., Mishra, S., Gandy, A., Unwin, H. J. T., Mellan, T. A., Coupland, H., Whittaker, C., Zhu, H., Berah, T., Eaton, J. W., et al. (2020) · Nature · doi:10.1038/s41586-020-2405-7 · Cited by 3,398
Self-citationGISAID: Global initiative on sharing all influenza data – from vision to reality
Shu, Y., & McCauley, J. (2017) · Eurosurveillance · doi:10.2807/1560-7917.es.2017.22.13.30494 · Cited by 3,039
Cited by
Sorted by citations
SARS-CoV-2 variants, spike mutations and immune escape
Harvey, W. T., Carabelli, A. M., Jackson, B., Gupta, R. K., Thomson, E. C., Harrison, E. M., Ludden, C., Reeve, R., Rambaut, A., COVID-19 Genomics UK (COG-UK) Consortium, et al. (2021) · Nature Reviews Microbiology · doi:10.1038/s41579-021-00573-0 · Cited by 3,528
Self-citationFeatures, Evaluation and Treatment Coronavirus (COVID-19)
Cascella, M., Rajnik, M., Cuomo, A., Dulebohn, S. C., & Napoli, R. D. (2020) · StatPearls · Cited by 3,351
Mechanisms of SARS-CoV-2 entry into cells
Jackson, C. B., Farzan, M., Chen, B., & Choe, H. (2022) · Nature Reviews Molecular Cell Biology · doi:10.1038/s41580-021-00418-x · Cited by 3,022
Rapid epidemic expansion of the SARS-CoV-2 Omicron variant in southern Africa
Viana, R. P. E. S., Moyo, S. M., Amoako, D. G., Tegally, H., Scheepers, C., Althaus, C. L., Anyaneji, U. J., Bester, P. A., Boni, M. F., Chand, M., et al. (2022) · Nature · doi:10.1038/s41586-022-04411-y · Cited by 1,678
Self-citationAirborne transmission of respiratory viruses
Wang, C. C., Prather, K. A., Sznitman, J., Jimenez, J. L., Lakdawala, S. S., Tüfekçi, Z., & Marr, L. C. (2021) · Science · doi:10.1126/science.abd9149 · Cited by 1,631
SARS-CoV-2 B.1.617.2 Delta variant replication and immune evasion
Mlcochova, P., Kemp, S. A., Dhar, M. S., Papa, G., Meng, B., Ferreira, I. A. T. M., Datir, R., Collier, D. A., Albecka, A., Singh, S., et al. (2021) · Nature · doi:10.1038/s41586-021-03944-y · Cited by 1,337
Self-citationSARS-CoV-2 variant biology: immune escape, transmission and fitness
Carabelli, A. M., Peacock, T. P., Thorne, L., Harvey, W. T., Hughes, J., de Silva, T. I., Peacock, S. J., Barclay, W., de Silva, T. I., Towers, G. J., et al. (2023) · Nature Reviews Microbiology · doi:10.1038/s41579-022-00841-7 · Cited by 1,386
Striking antibody evasion manifested by the Omicron variant of SARS-CoV-2
Liu, L., Iketani, S., Guo, Y., Chan, J. F.-W., Wang, M., Liu, L., Luo, Y., Chu, H., Huang, Y., Nair, M. S., et al. (2022) · Nature · doi:10.1038/s41586-021-04388-0 · Cited by 1,290
Markov, P. V., Ghafari, M., Beer, M., Lythgoe, K., Simmonds, P., Stilianakis, N. I., & Katzourakis, A. (2023) · Nature Reviews Microbiology · doi:10.1038/s41579-023-00878-2 · Cited by 1,179
Tregoning, J. S., Flight, K. E., Higham, S. L., Wang, Z., & Pierce, B. F. (2021) · Nature reviews. Immunology · doi:10.1038/s41577-021-00592-1 · Cited by 1,146
The biological and clinical significance of emerging SARS-CoV-2 variants
Tao, K., Tzou, P. L., Nouhin, J., Gupta, R. K., de Oliveira, T., Kosakovsky Pond, S. L., Fera, D., & Shafer, R. W. (2021) · Nature Reviews Genetics · doi:10.1038/s41576-021-00408-x · Cited by 1,009
Rapid spread of the SARS-CoV-2 Delta variant in some French regions, June 2021
Alizon, S., Haïm‐Boukobza, S., Foulongne, V., Verdurme, L., Trombert‐Paolantoni, S., Lecorché, E., Roquebert, B., & Sofonea, M. T. (2021) · Eurosurveillance · doi:10.2807/1560-7917.es.2021.26.28.2100573 · Cited by 870
Fiolet, T., Kherabi, Y., MacDonald, C.-J., Ghosn, J., & Peiffer-Smadja, N. (2022) · Clinical Microbiology and Infection · doi:10.1016/j.cmi.2021.10.005 · Cited by 911
Tarke, A., Sidney, J., Methot, N., Yu, E. D., Zhang, Y., Dan, J. M., Goodwin, B., Rubiro, P., Sutherland, A., Wang, E., et al. (2021) · Cell Reports Medicine · doi:10.1016/j.xcrm.2021.100355 · Cited by 706
Escape of SARS-CoV-2 501Y.V2 from neutralization by convalescent plasma
Network for Genomic Surveillance in South Africa, Cele, S., COMMIT-KZN Team, Gazy, I., Jackson, L., Hwa, S.-H., Tegally, H., Lustig, G., Giandhari, J., Pillay, S., et al. (2021) · Nature · doi:10.1038/s41586-021-03471-w · Cited by 651
Li, B., Deng, A., Li, K., Hu, Y., Li, Z., Shi, Y., Xiong, Q., Liu, Z., Guo, Q., Zou, L., et al. (2022) · Nature Communications · doi:10.1038/s41467-022-28089-y · Cited by 566
Self-citationTransmission, infectivity, and neutralization of a spike L452R SARS-CoV-2 variant
Deng, X., Garcia-Knight, M. A., Khalid, M. M., Servellita, V., Wang, C., Morris, M. K., Sotomayor-González, A., Glasner, D. R., Reyes, K. R., Gliwa, A. S., et al. (2021) · Cell · doi:10.1016/j.cell.2021.04.025 · Cited by 651
Starr, T. N., Greaney, A. J., Dingens, A. S., & Bloom, J. D. (2021) · Cell Reports Medicine · doi:10.1016/j.xcrm.2021.100255 · Cited by 470
SARS-CoV-2 RBD antibodies that maximize breadth and resistance to escape
Starr, T. N., Czudnochowski, N., Liu, Z., Zatta, F., Park, Y., Addetia, A., Pinto, D., Beltramello, M., Hernandez, P., Greaney, A. J., et al. (2021) · Nature · doi:10.1038/s41586-021-03807-6 · Cited by 503
The emergence and epidemic characteristics of the highly mutated SARS‐CoV‐2 Omicron variant
Tian, D., Sun, Y., Xu, H., & Ye, Q. (2022) · Journal of Medical Virology · doi:10.1002/jmv.27643 · Cited by 474
COVID-19 in Amazonas, Brazil, was driven by the persistence of endemic lineages and P.1 emergence
Naveca, F. G., do Nascimento, V. A., de Souza, V. C., Corado, A. D. L. G., Nascimento, F., Silva, G., Costa, Á., Duarte, D., Pessoa, K., Mejía, M., et al. (2021) · Nature Medicine · doi:10.1038/s41591-021-01378-7 · Cited by 496
Self-citationMapping mutations to the SARS-CoV-2 RBD that escape binding by different classes of antibodies
Greaney, A. J., Starr, T. N., Barnes, C. O., Weisblum, Y., Schmidt, F., Caskey, M., Gaebler, C., Cho, A., Agudelo, M., Finkin, S., et al. (2021) · Nature Communications · doi:10.1038/s41467-021-24435-8 · Cited by 433
After the pandemic: perspectives on the future trajectory of COVID-19
Telenti, A., Arvin, A. M., Corey, L., Corti, D., Diamond, M., García‐Sastre, A., Garry, R. F., Holmes, E. C., Pang, P. S., & Virgin, H. W. (2021) · Nature · doi:10.1038/s41586-021-03792-w · Cited by 450
Long-term complications of COVID-19
Desai, A. D., Lavelle, M. P., Boursiquot, B. C., & Wan, E. Y. (2021) · American Journal of Physiology-Cell Physiology · doi:10.1152/ajpcell.00375.2021 · Cited by 458
Gangavarapu, K., Latif, A. A., Mullen, J. L., Alkuzweny, M., Hufbauer, E., Tsueng, G., Haag, E., Zeller, M., Aceves, C. M., Zaiets, K., et al. (2023) · Nature Methods · doi:10.1038/s41592-023-01769-3 · Cited by 409
Self-citationEmerging Variants of SARS-CoV-2 And Novel Therapeutics Against Coronavirus (COVID-19)
Aleem, A., Samad, A., & Slenker, A. K. (2021) · Europe PMC (PubMed Central) · Cited by 398
Ong, S. W. X., Chiew, C. J., Ang, L. W., Mak, T. M., Cui, L., Toh, M. P. H., Lim, Y. D., Lee, P. H., Lee, T. H., Chia, P. Y., et al. (2021) · Clinical Infectious Diseases · doi:10.1093/cid/ciab721 · Cited by 430
SARS-CoV-2 Variants and Vaccines
Krause, P. R., Fleming, T. R., Longini, I. M., Peto, R., Briand, S. C., Heymann, D. L., Beral, V., Snape, M. D., Rees, H., Ropero, A. M., et al. (2021) · New England Journal of Medicine · doi:10.1056/nejmsr2105280 · Cited by 352
Low-dose mRNA-1273 COVID-19 vaccine generates durable memory enhanced by cross-reactive T cells
(2021) · doi:10.1126/science.abj9853 · Cited by 327
“…to immune memory of persons infected with SARS-CoV-2 is of value, as studies have indicated natural immunity is 93% to 100% protective against symptomatic reinfection for 7–8 months (16–19), though natural immunity protection against certain variants of concern (VOCs) is likely to be lower (20).”
Ranzani, O., Hitchings, M. D. T., Dorión, M., D’Agostini, T. L., de Paula, R. C., de Paula, O. F. P., Villela, E. F. D. M., Torres, M. S. S., de Oliveira, S. B., Schulz, W. L., et al. (2021) · BMJ · doi:10.1136/bmj.n2015 · Cited by 349
Novel SARS-CoV-2 variants: the pandemics within the pandemic
Boehm, E., Kronig, I., Neher, R. A., Eckerle, I., Vetter, P., & Kaiser, L. (2021) · Clinical Microbiology and Infection · doi:10.1016/j.cmi.2021.05.022 · Cited by 346
Spatiotemporal pattern of COVID-19 spread in Brazil
Castro, M. C., Kim, S., Barberia, L., Ribeiro, A. F., Gurzenda, S., Ribeiro, K. B., Abbott, E., Blossom, J. C., Rache, B., & Singer, B. H. (2021) · Science · doi:10.1126/science.abh1558 · Cited by 345
SARS-CoV-2 breakthrough infections in vaccinated individuals: measurement, causes and impact
Lipsitch, M., Krammer, F., Regev‐Yochay, G., Lustig, Y., & Balicer, R. D. (2021) · Nature reviews. Immunology · doi:10.1038/s41577-021-00662-4 · Cited by 345
The origins and potential future of SARS-CoV-2 variants of concern in the evolving COVID-19 pandemic
Otto, S. P., Day, T., Arino, J., Colijn, C., Dushoff, J. G., Li, M., Mechai, S., Domselaar, G. V., Wu, J., Earn, D. J. D., et al. (2021) · Current Biology · doi:10.1016/j.cub.2021.06.049 · Cited by 326
SARS-CoV-2 Variants, Vaccines, and Host Immunity
Mistry, P., Barmania, F., Mellet, J., Peta, K. T., Strydom, A., Viljoen, I. M., James, W., Gordon, S., & Pepper, M. S. (2022) · Frontiers in Immunology · doi:10.3389/fimmu.2021.809244 · Cited by 314
Membrane fusion and immune evasion by the spike protein of SARS-CoV-2 Delta variant
Zhang, J., Xiao, T., Cai, Y., Lavine, C. L., Peng, H., Zhu, H., Anand, K., Tong, P., Gautam, A. K., Mayer, M. L., et al. (2021) · Science · doi:10.1126/science.abl9463 · Cited by 288
Genomic characterization and epidemiology of an emerging SARS-CoV-2 variant in Delhi, India
Dhar, M. S., Marwal, R., Radhakrishnan, V. S., Ponnusamy, K., Jolly, B., Bhoyar, R. C., Sardana, V., Naushin, S., Rophina, M., Mellan, T. A., et al. (2021) · Science · doi:10.1126/science.abj9932 · Cited by 300
Self-citationGenomic characterization and Epidemiology of an emerging SARS-CoV-2 variant in Delhi, India
Dhar, M. S., Marwal, R., Radhakrishnan, V., Ponnusamy, K., Jolly, B., Bhoyar, R. C., Sardana, V., Naushin, S., Rophina, M., Mellan, T. A., et al. (2021) · doi:10.1101/2021.06.02.21258076 · Cited by 296
Self-citationSARS-CoV-2 Variants of Concern
Choi, J. Y., & Smith, D. M. (2021) · Yonsei Medical Journal · doi:10.3349/ymj.2021.62.11.961 · Cited by 319
The emergence and ongoing convergent evolution of the SARS-CoV-2 N501Y lineages
Martin, D. P., Weaver, S., Tegally, H., San, J. E., Shank, S. D., Wilkinson, E., Lucaci, A. G., Giandhari, J., Naidoo, S., Pillay, Y., et al. (2021) · Cell · doi:10.1016/j.cell.2021.09.003 · Cited by 282
“, 2021), increased transmissibility (V1, V2, and V3) (Althaus et al., 2021; Faria et al., 2021; Lubinski et al., 2021; Pearson et al., 2021; Public Health England, 2020; Volz et al., 2021), substantially increased capacity to overcome prior infection and/or vaccination-induced immunity (V2 and V3) (Cele et al.”
InfluentialSelf-citationGlobal disparities in SARS-CoV-2 genomic surveillance
Brito, A. F., Semenova, E., Dudas, G., Hassler, G. W., Kalinich, C. C., Kraemer, M. U. G., Ho, J., Tegally, H., Githinji, G., Agoti, C. N., et al. (2022) · Nature Communications · doi:10.1038/s41467-022-33713-y · Cited by 366
Self-citationCrotty, S. (2021) · Science · doi:10.1126/science.abj2258 · Cited by 277
Immunological memory to SARS‐CoV ‐2 infection and COVID ‐19 vaccines
Sette, A., & Crotty, S. (2022) · Immunological Reviews · doi:10.1111/imr.13089 · Cited by 270
Broad sarbecovirus neutralization by a human monoclonal antibody
Tortorici, M. A., Czudnochowski, N., Starr, T. N., Marzi, R., Walls, A. C., Zatta, F., Bowen, J. E., Jaconi, S., di Iulio, J., Wang, Z., et al. (2021) · Nature · doi:10.1038/s41586-021-03817-4 · Cited by 255
A COVID-19 peptide vaccine for the induction of SARS-CoV-2 T cell immunity
Heitmann, J. S., Bilich, T., Tandler, C., Nelde, A., Maringer, Y., Marconato, M., Reusch, J., Jäger, S., Denk, M., Richter, M., et al. (2021) · Nature · doi:10.1038/s41586-021-04232-5 · Cited by 257
Rapid epidemic expansion of the SARS-CoV-2 Omicron variant in southern Africa
Viana, R. P. E. S., Moyo, S. M., Amoako, D. G., Tegally, H., Scheepers, C., Althaus, C. L., Anyaneji, U. J., Bester, P. A., Boni, M. F., Chand, M., et al. (2022) · Nature · doi:10.1101/2021.12.19.21268028 · Cited by 253
Self-citationCOVID-19 and metabolic disease: mechanisms and clinical management
Steenblock, C., Schwarz, P. E. H., Ludwig, B., Linkermann, A., Zimmet, P., Kulebyakin, K. Y., Va, T., Markov, A. G., Lehnert, H., de Angelis, M. H., et al. (2021) · The Lancet Diabetes & Endocrinology · doi:10.1016/s2213-8587(21)00244-8 · Cited by 256
Hoffmann, M., Hofmann-Winkler, H., Krüger, N., Kempf, A., Nehlmeier, I., Graichen, L., Arora, P., Sidarovich, A., Moldenhauer, A.-S., Winkler, M. S., et al. (2021) · Cell Reports · doi:10.1016/j.celrep.2021.109415 · Cited by 258
Nanobodies from camelid mice and llamas neutralize SARS-CoV-2 variants
Xu, J., Xu, K. Y., Jung, S., Conte, A., Lieberman, J. A., Muecksch, F., Lorenzi, J. C. C., Park, S., Schmidt, F., Wang, Z., et al. (2021) · Nature · doi:10.1038/s41586-021-03676-z · Cited by 232
Estimating epidemiologic dynamics from cross-sectional viral load distributions
Hay, J. A., Kennedy‐Shaffer, L., Kanjilal, S., Lennon, N. J., Gabriel, S., Lipsitch, M., & Mina, M. J. (2021) · Science · doi:10.1126/science.abh0635 · Cited by 228
Self-citationThe next phase of SARS-CoV-2 surveillance: real-time molecular epidemiology
Munnink, B. B. O., Worp, N., Nieuwenhuijse, D. F., Sikkema, R. S., Haagmans, B. L., Fouchier, R. A. M., & Koopmans, M. (2021) · Nature Medicine · doi:10.1038/s41591-021-01472-w · Cited by 238
Emergence and expansion of SARS-CoV-2 B.1.526 after identification in New York
Annavajhala, M. K., Mohri, H., Wang, P., Nair, M. S., Zucker, J. E., Sheng, Z., Gomez‐Simmonds, A., Kelley, A. L., Tagliavia, M., Huang, Y., et al. (2021) · Nature · doi:10.1038/s41586-021-03908-2 · Cited by 227
The Disease Severity and Clinical Outcomes of the SARS-CoV-2 Variants of Concern
Lin, L., Liu, Y., Tang, X., & He, D. (2021) · Frontiers in Public Health · doi:10.3389/fpubh.2021.775224 · Cited by 239
Nucleocapsid mutations R203K/G204R increase the infectivity, fitness, and virulence of SARS-CoV-2
Wu, H., Xing, N., Meng, K., Fu, B., Xue, W., Dong, P., Tang, W., Xiao, Y., Liu, G., Luo, H., et al. (2021) · Cell Host & Microbe · doi:10.1016/j.chom.2021.11.005 · Cited by 229
“These mutations are carried by the increasingly frequent lineages B.1.1.7 (Alpha) (Collier et al., 2021; C. Caserta et al., 2021) and P.1 (Gamma) (Dejnirattisai et al., 2021; Faria et al., 2021).”
InfluentialEarly detection and surveillance of SARS-CoV-2 genomic variants in wastewater using COJAC
Jahn, K., Dreifuss, D., Topolsky, I., Kull, A., Ganesanandamoorthy, P., Fernández-Cassi, X., Bänziger, C., Devaux, A. J., Stachler, E. N., Caduff, L., et al. (2022) · Nature Microbiology · doi:10.1038/s41564-022-01185-x · Cited by 221
SARS-CoV-2 infection generates tissue-localized immunological memory in humans
Poon, M. M. L., Rybkina, K., Kato, Y., Kubota, M., Matsumoto, R., Bloom, N. I., Zhang, Z., Hastie, K. M., Grifoni, A., Weiskopf, D., et al. (2021) · Science Immunology · doi:10.1126/sciimmunol.abl9105 · Cited by 220
Waves and variants of SARS-CoV-2: understanding the causes and effect of the COVID-19 catastrophe
Thakur, V., Bhola, S., Thakur, P., Patel, S. K. S., Kulshrestha, S., Ratho, R. K., & Kumar, P. (2022) · Infection · doi:10.1007/s15010-021-01734-2 · Cited by 195
Ribeiro, A. C. D. M., Aikawa, N. E., Saad, C. G. S., Yuki, E. F. N., Pedrosa, T. D. N., Fusco, S. R. G., Rojo, P. T., Pereira, R. M. R., Shinjo, S. K., Andrade, D. C. O., et al. (2021) · Nature Medicine · doi:10.1038/s41591-021-01469-5 · Cited by 197
Self-citationSpatiotemporal invasion dynamics of SARS-CoV-2 lineage B.1.1.7 emergence
Kraemer, M. U. G., Hill, V., Ruis, C., Dellicour, S., Bajaj, S., McCrone, J. T., Baele, G., Parag, K. V., Battle, A. L., Gutiérrez, B., et al. (2021) · Science · doi:10.1126/science.abj0113 · Cited by 194
Self-citationExperimental Evidence for Enhanced Receptor Binding by Rapidly Spreading SARS-CoV-2 Variants
Laffeber, C., de Koning, K., Kanaar, R., & Lebbink, J. H. G. (2021) · Journal of Molecular Biology · doi:10.1016/j.jmb.2021.167058 · Cited by 194
The Global Epidemic of the SARS-CoV-2 Delta Variant, Key Spike Mutations and Immune Escape
Tian, D., Sun, Y., Zhou, J., & Ye, Q. (2021) · Frontiers in Immunology · doi:10.3389/fimmu.2021.751778 · Cited by 201
Hitchings, M. D. T., Ranzani, O., Torres, M. S. S., de Oliveira, S. B., Almirón, M., Said, R., Borg, R., Schulz, W. L., de Oliveira, R. D., da Silva, P. V., et al. (2021) · The Lancet Regional Health - Americas · doi:10.1016/j.lana.2021.100025 · Cited by 201
“The World Health Organisation declared the amma variant as a Variant of Concern [5] given the evidence for ts increased transmissibility [3] and mutations shared with other ariants of concern.”
BackgroundInfluentialCOVID-19: Unmasking Emerging SARS-CoV-2 Variants, Vaccines and Therapeutic Strategies
Raman, R., Patel, K. J., & Ranjan, K. (2021) · Biomolecules · doi:10.3390/biom11070993 · Cited by 194
Implications of diversity in sperm size and function for sperm competition and fertility
Gomendio, M., & Roldán, E. R. S. (2008) · The International Journal of Developmental Biology · doi:10.1387/ijdb.082595mg · Cited by 187
Predicting the mutational drivers of future SARS-CoV-2 variants of concern
Maher, M. C., Bartha, I., Weaver, S., di Iulio, J., Ferri, E., Soriaga, L. B., Lempp, F. A., Hie, B., Bryson, B. D., Berger, B., et al. (2022) · Science Translational Medicine · doi:10.1126/scitranslmed.abk3445 · Cited by 184
Self-citationThe evolving SARS-CoV-2 epidemic in Africa: Insights from rapidly expanding genomic surveillance
Tegally, H., San, J. E., Cotten, M. L., Moir, M., Tegomoh, B., Mboowa, G., Martin, D. P., Baxter, C., Lambisia, A. W., Diallo, A. B., et al. (2022) · Science · doi:10.1126/science.abq5358 · Cited by 190
“The remaining VOC, Gamma (14), originated in Brazil and had a limited influence in Africa, with only four recorded sequenced cases.”
OLIVEIRA, E. A., Colosimo, E. A., Silva, A. C. S. E., MAK, R. H. K., Martelli, D. R. B., Silva, L. R., Martelli‐Júnior, H., & Oliveira, M. C. L. (2021) · The Lancet Child & Adolescent Health · doi:10.1016/s2352-4642(21)00134-6 · Cited by 166
Guo, L., Wang, G., Wang, Y., Zhang, Q., Ren, L., Gu, X., Huang, T., Zhong, J., Wang, Y., Wang, X., et al. (2022) · The Lancet Microbe · doi:10.1016/s2666-5247(22)00036-2 · Cited by 174
Reduction in life expectancy in Brazil after COVID-19
Castro, M. C., Gurzenda, S., Turra, C. M., Kim, S., Andrasfay, T., & Goldman, N. (2021) · Nature Medicine · doi:10.1038/s41591-021-01437-z · Cited by 164
Emergence and Expansion of the SARS-CoV-2 Variant B.1.526 Identified in New York
Annavajhala, M. K., Mohri, H., Wang, P., Nair, M., Zucker, J. E., Sheng, Z., Gomez-Simmonds, A., Kelley, A. L., Tagliavia, M., Huang, Y., et al. (2021) · doi:10.1101/2021.02.23.21252259
The outbreak of SARS‐CoV‐2 Omicron lineages, immune escape, and vaccine effectivity
Zhou, Y., Zhi, H., & Teng, Y. (2022) · Journal of Medical Virology · doi:10.1002/jmv.28138 · Cited by 155
Victora, C. G., Castro, M. C., Gurzenda, S., de Medeiros, A. C., de França, G. V. A., & Barros, A. J. D. (2021) · EClinicalMedicine · doi:10.1016/j.eclinm.2021.101036 · Cited by 154
Interferon resistance of emerging SARS-CoV-2 variants
Guo, K., Barrett, B. S., Morrison, J. H., Mickens, K. L., Vladar, E. K., Hasenkrug, K. J., Poeschla, E. M., & Santiago, M. L. (2022) · Proceedings of the National Academy of Sciences · doi:10.1073/pnas.2203760119 · Cited by 141
Moodley, A., Stegger, M., BAĞCIGİL, A. F., Baptiste, K. E., Loeffler, A., Lloyd, D. H., Williams, N. J., Leonard, N., Abbott, Y., Skov, R. L., et al. (2006) · Journal of Antimicrobial Chemotherapy · doi:10.1093/jac/dkl394 · Cited by 146
The origins and molecular evolution of SARS-CoV-2 lineage B.1.1.7 in the UK
Hill, V., du Plessis, L., Peacock, T. P., Aggarwal, D., Colquhoun, R., Carabelli, A. M., Ellaby, N. A. F., Gallagher, E., Groves, N., Jackson, B., et al. (2022) · Virus Evolution · doi:10.1093/ve/veac080 · Cited by 145
Self-citationWang, Z., Muecksch, F., Cho, A., Gaebler, C., Hoffmann, H.-H., Ramos, V., Zong, S., Cipolla, M., Johnson, B., Schmidt, F., et al. (2022) · Immunity · doi:10.1016/j.immuni.2022.04.003 · Cited by 145
“…supersite are mutated in several variants of concern including Beta, Gamma, and Omicron—the latter of which carries 3 deletions, 4 amino acid substitutions, and an insertion in the NTD that render antibodies to the supersite ineffective (Callaway, 2021; Faria et al., 2021; Tegally et al., 2021).”
Striking Antibody Evasion Manifested by the Omicron Variant of SARS-CoV-2Preprint
Liu, L., Iketani, S., Guo, Y., Chan, J. F., Wang, M., Liu, L., Luo, Y., Chu, H., Huang, Y., Nair, M. S., et al. (2021) · bioRxiv (Cold Spring Harbor Laboratory) · doi:10.1101/2021.12.14.472719 · Cited by 142
Lustig, Y., Zuckerman, N. S., Nemet, I., Atari, N., Kliker, L., Regev‐Yochay, G., Sapir, E., Mor, O., Alroy‐Preis, S., Mendelson, E., et al. (2021) · Eurosurveillance · doi:10.2807/1560-7917.es.2021.26.26.2100557 · Cited by 143
“The Gamma isolate was kindly provided by the Tropical Medicine Institute, Sao Paulo University (Brazil) [6].”
MethodZeiser, F. A., Donida, B., da Costa, C. A., Ramos, G. D. O., Scherer, J. N., Barcellos, N. T., Alegretti, A. P., Ikeda, M. L. R., Müller, A. P. W. C., Bohn, H. C., et al. (2021) · The Lancet Regional Health - Americas · doi:10.1016/j.lana.2021.100107 · Cited by 141
COVID-19 in patients with hematologic malignancy
Langerbeins, P., & Hallek, M. J. (2022) · Blood · doi:10.1182/blood.2021012251 · Cited by 143
Molecular characteristics, immune evasion, and impact of SARS-CoV-2 variants
Sun, C., Xie, C., Bu, G., Zhong, L., & Zeng, M. (2022) · Signal Transduction and Targeted Therapy · doi:10.1038/s41392-022-01039-2 · Cited by 149
Moriyama, S., Adachi, Y., Sato, T., Tonouchi, K., Sun, L., Fukushi, S., Yamada, S., Kinoshita, H., Nojima, K., Kanno, T., et al. (2021) · Immunity · doi:10.1016/j.immuni.2021.06.015 · Cited by 140
Rates of SARS-CoV-2 transmission and vaccination impact the fate of vaccine-resistant strains
Rella, S. A., Kulikova, Y. A., Dermitzakis, E. T., & Kondrashov, F. A. (2021) · Scientific Reports · doi:10.1038/s41598-021-95025-3 · Cited by 139
Two Years into the COVID-19 Pandemic: Lessons Learned
da Silva, S. J. R., do Nascimento, J. C. F., Mendes, R. P. G., Guarines, K. M., da Silva, C. T. A., da Silva, P. G., de Magalhães, J. J. F., Vigar, J. R. J., Silva‐Júnior, A., Kohl, A., et al. (2022) · ACS Infectious Diseases · doi:10.1021/acsinfecdis.2c00204 · Cited by 155
Self-citationPango lineage designation and assignment using SARS-CoV-2 spike gene nucleotide sequences
O’Toole, Á., Pybus, O. G., Abram, M. E., Kelly, E. J., & Rambaut, A. (2022) · BMC Genomics · doi:10.1186/s12864-022-08358-2 · Cited by 146
Self-citationFast-spreading SARS-CoV-2 variants: challenges to and new design strategies of COVID-19 vaccines
Zhou, W., & Wang, W. (2021) · Signal Transduction and Targeted Therapy · doi:10.1038/s41392-021-00644-x · Cited by 134
da Silva, S. J. R., & Pena, L. (2021) · One Health · doi:10.1016/j.onehlt.2021.100287 · Cited by 147
“Using a dynamical model, a recent study has demonstrated that the gamma variant is more transmissible (estimated to be 1.7 to 2.4) when compared to non-gamma lineages, which may have accelerated the rapid propagation around the world [18].”
InfluentialModel-based estimation of transmissibility and reinfection of SARS-CoV-2 P.1 variant
Coutinho, R. M., Marquitti, F. M. D., Ferreira, L. S., Borges, M. E., Lopes, R., Canton, O., Portella, T. P., Poloni, S., Franco, C. F. J., Pluciński, M. M., et al. (2021) · Communications Medicine · doi:10.1038/s43856-021-00048-6 · Cited by 129
SARS-CoV-2 evolution in the Omicron era
Roemer, C., Sheward, D. J., Hisner, R., Gueli, F., Sakaguchi, H., Frohberg, N., Schoenmakers, J., Sato, K., O’Toole, Á., Rambaut, A., et al. (2023) · Nature Microbiology · doi:10.1038/s41564-023-01504-w · Cited by 130
“Examples of variants that are extremely different include the VOCs Alpha, Beta, Gamma and the Omicron lineages (for example, BA.1, BA.2 and BA.5) 10,12–14 The first generation of SARS-CoV-2 VOCs (Alpha, Beta, Gamma, Delta and Omicron) each evolved from pre-VOC ancestors and sequentially replaced…”
BackgroundSelf-citationEarly introductions and transmission of SARS-CoV-2 variant B.1.1.7 in the United States
Alpert, T., Brito, A. F., Lasek‐Nesselquist, E., Rothman, J. E., Valesano, A. L., MacKay, M. J., Petrone, M. E., Breban, M. I., Watkins, A. E., Vogels, C. B. F., et al. (2021) · Cell · doi:10.1016/j.cell.2021.03.061 · Cited by 122
Aggarwal, A., Stella, A. O., Walker, G. J., Akerman, A., Esneau, C., Milogiannakis, V., Burnett, D. L., McAllery, S., Silva, M. R., Lu, Y., et al. (2022) · Nature Microbiology · doi:10.1038/s41564-022-01135-7 · Cited by 118
Emerging SARS-CoV-2 Variants of Concern (VOCs): An Impending Global Crisis
Thye, A. Y.-K., Law, J. W., Pusparajah, P., Letchumanan, V., Chan, K., & Lee, L. (2021) · Biomedicines · doi:10.3390/biomedicines9101303 · Cited by 121
A look into the future of the COVID-19 pandemic in Europe: an expert consultation [viewpoint].
Iftekhar, E. N., Priesemann, V., Balling, R., Bauer, S., Beutels, P., Valdez, A. S. C., Cuschieri, S., Czypionka, T., Dumpis, U., Glaab, E., et al. (2021) · BORIS (University Library Bern) · doi:10.17863/cam.75145 · Cited by 119
Oral prodrug of remdesivir parent GS-441524 is efficacious against SARS-CoV-2 in ferrets
Cox, R. M., Wolf, J. D., Lieber, C. M., Sourimant, J., Lin, M. J., Babusis, D. M., Pont, V. D., Chan, J., Barrett, K., Lye, D. S., et al. (2021) · Nature Communications · doi:10.1038/s41467-021-26760-4 · Cited by 119
SeyedAlinaghi, S., Mirzapour, P., Dadras, O., Pashaei, Z., Karimi, A., MohsseniPour, M., Soleymanzadeh, M., Barzegary, A., Afsahi, A. M., Vahedi, F., et al. (2021) · European journal of medical research · doi:10.1186/s40001-021-00524-8 · Cited by 115
Chakraborty, C., Bhattacharya, M., & Sharma, A. R. (2022) · Reviews in Medical Virology · doi:10.1002/rmv.2270 · Cited by 111
The Spike of Concern—The Novel Variants of SARS-CoV-2
Winger, A., & Caspari, T. (2021) · Viruses · doi:10.3390/v13061002 · Cited by 122
Bolze, A., Luo, S., White, S. J., Cirulli, E. T., Wyman, D., Rossi, A. D., Machado, H., Cassens, T., Jacobs, S., Barrett, K. M. S., et al. (2021) · Cell Reports Medicine · doi:10.1016/j.xcrm.2022.100564 · Cited by 115
de Souza, W. M., Amorim, M. R., Sesti‐Costa, R., Coimbra, L. D., Brunetti, N. S., de Toledo-Teixeira, D. A., de Souza, G. F., Muraro, S. P., Parise, P. L., Barbosa, P. P., et al. (2021) · The Lancet Microbe · doi:10.1016/s2666-5247(21)00129-4 · Cited by 115
Self-citationChanging composition of SARS-CoV-2 lineages and rise of Delta variant in England
Mishra, S., Mindermann, S., Sharma, M., Whittaker, C., Mellan, T. A., Wilton, T., Klapsa, D., Mate, R., Fritzsche, M., Zambon, M. C. F. A., et al. (2021) · EClinicalMedicine · doi:10.1016/j.eclinm.2021.101064 · Cited by 109
“1 are more transmissible than ancestral SARS-CoV-2 lineages; [10,13] for B.”
BackgroundInfluentialSelf-citation
Metadata
- Authors
- Faria, N. R., Mellan, T. A., Whittaker, C., Claro, I. M., Candido, D. D. S., Mishra, S., Crispim, M. A. E., Sales, F. C. S., Hawryluk, I., McCrone, J. T., Hulswit, R. J. G., Franco, L. A. M., Ramundo, M. S., de Jesus, J. G., Andrade, P. S., Coletti, T. M., Ferreira, G. M., Silva, C. A. M., Manuli, E. R., Pereira, R. H. M., Peixoto, P. S., Kraemer, M. U. G., Gaburo, N., Camilo, C. D. C., Hoeltgebaum, H., Souza, W. M., Rocha, E. C., de Souza, L. M., de Pinho, M. C., Araujo, L. J. T., Malta, F. S. V., de Lima, A. B., Silva, J. D. P., Zauli, D. A. G., Ferreira, A. C. D. S., Schnekenberg, R. P., Laydon, D. J., Walker, P. G. T., Schlüter, H. M., dos Santos, A. L. P., Vidal, M. S., Del Caro, V. S., Filho, R. M. F., dos Santos, H. M., Aguiar, R. S., Proença-Modena, J. L., Nelson, B., Hay, J. A., Monod, M., Miscouridou, X., Coupland, H., Sonabend, R., Vollmer, M., Gandy, A., Prete, C. A., Nascimento, V. H., Suchard, M. A., Bowden, T. A., Pond, S. L. K., Wu, C.-H., Ratmann, O., Ferguson, N. M., Dye, C., Loman, N. J., Lemey, P., Rambaut, A., Fraiji, N. A., Carvalho, M. D. P. S. S., Pybus, O. G., Flaxman, S., Bhatt, S., & Sabino, E. C.
- Affiliations
- Universidade de São Paulo (BR)
- Imperial College London (GB)
- Instituto de Medicina Tropical, Faculdade de Medicina da Universidade de São Paulo, São Paulo, Brazil.
- Fundação Hospitalar de Hematologia e Hemoterapia do Amazonas (BR)
- University of Edinburgh (GB)
- Centre for Human Genetics (GB)
- Departamento de Epidemiologia, Faculdade de Saúde Pública da Universidade de São Paulo, Sao Paulo, Brazil.
- Universidade Federal de Uberlândia (BR)
- Institute of Applied Economic Research (BR)
- University of Oxford (GB)
- DB Diagnósticos do Brasil, São Paulo, Brazil.
- Laboratory of Quantitative Pathology, Center of Pathology, Adolfo Lutz Institute, São Paulo, Brazil.
- Instituto Hermes Pardini, Belo Horizonte, Brazil.
- CDL Laboratório Santos e Vidal, Manaus, Brazil.
- Universidade Federal de Minas Gerais (BR)
- Laboratory of Emerging Viruses, Department of Genetics, Evolution, Microbiology, and Immunology, Institute of Biology, University of Campinas (UNICAMP), São Paulo, Brazil.
- Instituto Nacional de Pesquisas da Amazônia (BR)
- Harvard University (US)
- Departamento de Engenharia de Sistemas Eletrônicos, Escola Politécnica da Universidade de São Paulo, São Paulo, Brazil.
- University of California, Los Angeles (US)
- Temple University (US)
- University of Southampton (GB)
- Institute for Microbiology and Infection, University of Birmingham, Birmingham, UK.
- Rega Institute for Medical Research (BE)
- Royal Veterinary College (GB)
- University of Copenhagen (DK)
- Corresponding author
- Faria, Nuno R.
- Mellan, Thomas A.
- Whittaker, Charles
- Claro, Ingra M.
- Mishra, Swapnil
- Pybus, Oliver G.
- Flaxman, Seth
- Bhatt, Samir
- ORCID
- Faria, Nuno R.
- Mellan, Thomas A.
- Whittaker, Charles
- Claro, Ingra M.
- Candido, Darlan da S.
- Mishra, Swapnil
- Crispim, Myuki A. E.
- Sales, Flavia C. S.
- Hawryluk, Iwona
- McCrone, John T.
- Hulswit, Ruben J. G.
- Franco, Lucas A. M.
- Ramundo, Mariana S.
- de Jesus, Jaqueline G.
- Andrade, Pamela S.
- Coletti, Thais M.
- Ferreira, Giulia M.
- Silva, Camila A. M.
- Manuli, Erika R.
- Pereira, Rafael H. M.
- Peixoto, Pedro S.
- Kraemer, Moritz U. G.
- Gaburo, Nelson
- Camilo, Cecilia da C.
- Hoeltgebaum, Henrique
- Souza, William M.
- Rocha, Esmenia C.
- de Souza, Leandro M.
- de Pinho, Mariana C.
- Araujo, Leonardo J. T.
- Malta, Frederico S. V.
- de Lima, Aline B.
- Silva, Joice do P.
- Zauli, Danielle A. G.
- Ferreira, Alessandro C. de S.
- Schnekenberg, Ricardo P.
- Laydon, Daniel J.
- Walker, Patrick G. T.
- Schlüter, Hannah M.
- dos Santos, Ana L. P.
- Vidal, Maria S.
- Del Caro, Valentina S.
- Aguiar, Renato S.
- Proença-Modena, José L.
- Nelson, Bruce
- Hay, James A.
- Monod, Mélodie
- Coupland, Helen
- Sonabend, Raphael
- Vollmer, Michaela
- Gandy, Axel
- Prete, Carlos A.
- Nascimento, Vitor H.
- Suchard, Marc A.
- Bowden, Thomas A.
- Pond, Sergei L. K.
- Wu, Chieh-Hsi
- Ratmann, Oliver
- Ferguson, Neil M.
- Dye, Christopher
- Loman, Nick J.
- Lemey, Philippe
- Rambaut, Andrew
- Fraiji, Nelson A.
- Carvalho, Maria do P. S. S.
- Pybus, Oliver G.
- Flaxman, Seth
- Bhatt, Samir
- Sabino, Ester C.
- Venue
- Science
- Published
- 2021-05-21
- Volume
- 372
- Issue
- 6544
- Pages
- 815-821
- ISSN
- 0036-8075 (ISSN-L)
- 1095-9203
- PMC
- PMC8139423
- OpenAlex
- W3156343712
- Cited by
- 1,461
- References
- 93
- Citations by year
- 2026: 48 · 2025: 73 · 2024: 104 · 2023: 227 · 2022: 492 · 2021: 502
- FWCI
- 105.79
- Type
- journal article
- Language
- en
- Open access
- hybrid
- doi.org
- Licence
- Locations
- Science (publishedVersion, cc-by)
- medRxiv (acceptedVersion, cc-by-nc-nd)
- PubMed Central (publishedVersion, cc-by)
- PubMed (publishedVersion)
- Edinburgh Research Explorer (University of Edinburgh) (publishedVersion, cc-by)
- LA Referencia (Red Federada de Repositorios Institucionales de Publicaciones Científicas) (publishedVersion, other-oa)
- Spiral (Imperial College London) (submittedVersion, cc-by)
- PubMed Central (submittedVersion, cc-by-nc-nd)
- ePrints Soton (University of Southampton) (submittedVersion)
- eScholarship (California Digital Library) (submittedVersion)
- eScholarship (California Digital Library) (submittedVersion, cc-by)
- Lirias (KU Leuven) (submittedVersion, other-oa)
- TUScholarShare (Temple University) (submittedVersion, cc-by)
- Funders
- Medical Research Council (MR/S0195/1)
- National Institute for Health Research (203141/Z/16/Z, MR/S007555/1, ALTF 869-2019, OPP1175094, 2018/12579-7 CNP)
- Wellcome Trust and Royal Society (204311/Z/16/Z)
- Topics
- Health Sciences › Medicine › Infectious Diseases › SARS-CoV-2 and COVID-19 Research
- Physical Sciences › Mathematics › Modeling and Simulation › COVID-19 epidemiological studies
- Life Sciences › Biochemistry, Genetics and Molecular Biology › Genetics › Evolution and Genetic Dynamics
- Keywords
- P.1 lineage, SARS-CoV-2, COVID-19 pandemic, variants of concern, spike protein mutations, E484K, N501Y, ACE2 binding, transmissibility, immune evasion, molecular clock, epidemic resurgence, Manaus, genomic surveillance
About these checks
Registry, retraction, Cites and statistics results are computed, not judged, with one exception: a printed reference that no index lists is read once by a model before it counts as a citation error. Claims are extracted by a model and kept only when their quote appears verbatim in the text; each cited source is then checked, with a model’s help, for whether it says what the claim relies on. Those verdicts can be wrong — read the claim’s quote and the cited source before relying on one.
Statistics and arithmetic are recomputed, not judged.
Confidence bands are shown only for fields calibrated on our annotated test set. None is calibrated yet, so no band is shown.
What counts as a claim ›How we measure confidence ›How we check this ›
Are you an author, or do you see a problem with this page? Request a review
