

The DOI matches its Crossref record; 138 of the 138 references it cites were found in a registry or an index; none of the 101 sources its claims cite is checked for support yet.
Strengthening the Reporting of Observational Studies in Epidemiology using Mendelian Randomisation (STROBE-MR): explanation and elaboration.
Open accessAbstract
Mendelian randomisation (MR) studies allow a better understanding of the causal effects of modifiable exposures on health outcomes, but the published evidence is often hampered by inadequate reporting. Reporting guidelines help authors effectively communicate all critical information about what was done and what was found. STROBE-MR (strengthening the reporting of observational studies in epidemiology using mendelian randomisation) assists authors in reporting their MR research clearly and transparently. Adopting STROBE-MR should help readers, reviewers, and journal editors evaluate the quality of published MR studies. This article explains the 20 items of the STROBE-MR checklist, along with their meaning and rationale, using terms defined in a glossary. Examples of transparent reporting are used for each item to illustrate best practices.
Overview
AI snapshot
Written from the paper’s full text.
TL;DR
STROBE-MR is a 20-item reporting checklist for Mendelian randomisation (MR) studies, and this article explains each item and provides examples of transparent reporting. It aims to help authors, reviewers, and journal editors communicate and appraise MR studies more clearly.
Key findings
- STROBE-MR comprises 20 reporting items covering title/abstract, introduction, methods, results, discussion, and other information; it was developed by an expert group and revised after a July 2019 preprint and debate at the 4th International Mendelian Randomisation Conference.
- The paper states that empirical evidence indicates many MR reports do not clearly state or examine MR assumptions and report insufficient details on data sources, making quality and reliability difficult to evaluate.
- This explanation and elaboration document explains the rationale of each checklist item and uses published MR studies as examples of transparent reporting; the examples are not necessarily ideal but highlight the intended issue for each item.
- The authors encourage MR study authors, reviewers, and journal editors to use STROBE-MR to improve reporting.
Methods
- Guideline development: the initiative was established in 2018 following guidance for developing medical research reporting guidelines; an expert group met face-to-face in Bristol, UK, over two days in May 2019 to discuss empirical evidence and draft checklist items.
- The draft checklist was published as a preprint in July 2019, debated on the preprint platform, social media, and at the 4th International Mendelian Randomisation Conference, then revised.
- This article is an explanation and elaboration document complementing the STROBE-MR statement; it explains the 20 checklist items using a glossary and examples identified from published MR studies, with some examples edited by removing citations and unrelated sections.
Limitations
- The paper states that STROBE-MR is not intended as a formal tool for assessing methodological or reporting quality and should not be transformed into a quality scale; it is also not a formal guideline to design and conduct MR studies.
- The paper states that some items will not apply to MR studies that do not use an instrument for the exposure or do not report instrumental variable estimates, though the checklist still provides useful guidance.
- The paper states that the examples do not necessarily represent the ideal statement for each checklist item; evident from the text, this is a consensus/guideline explanation and elaboration without reported empirical validation of whether STROBE-MR improves reporting quality.
Model-written summary. Check it against the paper before relying on it.
Integrity signals
Registry
Cites
Statistics
Figures
Verification
Claims the paper makes
68 No basis given · 67 Not checked yet · 33 Own interpretation
None of the sources cited for this claim have been checked yet.
In the paper
“Empirical evidence22 23 24 indicates that many reports of MR studies do not clearly state or examine the various assumptions of MR methods”
§ Strengthening the reporting of observational studies in epidemiology using mendelian randomisation (STROBE-MR): explanation and elaboration > Strengthening the reporting of MR studies
What the sources say
hedged- Asserted: passes — The authors put it forward as true.
- Checkable: passes — It can be checked against evidence.
- Load-bearing: passes — The paper’s conclusions depend on it.
- Based: passes — The paper gives a reason why it holds.
None of the sources cited for this claim have been checked yet.
In the paper
“and report insufficient details on the data sources”
§ Strengthening the reporting of observational studies in epidemiology using mendelian randomisation (STROBE-MR): explanation and elaboration > Abstract
What the sources say
plain- Asserted: passes — The authors put it forward as true.
- Checkable: passes — It can be checked against evidence.
- Load-bearing: passes — The paper’s conclusions depend on it.
- Based: passes — The paper gives a reason why it holds.
None of the sources cited for this claim have been checked yet.
In the paper
“As a result, the quality of reporting of these studies has been inconsistent.”
§ Strengthening the reporting of observational studies in epidemiology using mendelian randomisation (STROBE-MR): explanation and elaboration > Strengthening the reporting of MR studies
What the sources say
plain- Asserted: passes — The authors put it forward as true.
- Checkable: passes — It can be checked against evidence.
- Load-bearing: passes — The paper’s conclusions depend on it.
- Based: passes — The paper gives a reason why it holds.
None of the sources cited for this claim have been checked yet.
In the paper
“and can be produced by confounding (that is, by another factor that affects both the outcome and exposure)1 2 3”
§ Strengthening the reporting of observational studies in epidemiology using mendelian randomisation (STROBE-MR): explanation and elaboration > Abstract
What the sources say
plaindirect- Asserted: passes — The authors put it forward as true.
- Checkable: passes — It can be checked against evidence.
- Load-bearing: passes — The paper’s conclusions depend on it.
- Based: passes — The paper gives a reason why it holds.
A conclusion the paper draws from its own results — it cites no other source for it, so there is none to check. The quote shows it is in the paper.
In the paper
“Similarly, genetic variants are generally not influenced by the outcome and therefore, by reverse causation.”
§ Strengthening the reporting of observational studies in epidemiology using mendelian randomisation (STROBE-MR): explanation and elaboration > Abstract
hedged- Asserted: passes — The authors put it forward as true.
- Checkable: passes — It can be checked against evidence.
- Load-bearing: passes — The paper’s conclusions depend on it.
- Based: passes — The paper gives a reason why it holds.
- Rests on an assumption: Genetic variation is essentially randomly inherited from parents to offspring at conception.
None of the sources cited for this claim have been checked yet.
In the paper
“but the published evidence is often hampered by inadequate reporting”
§ Strengthening the reporting of observational studies in epidemiology using mendelian randomisation (STROBE-MR): explanation and elaboration > Abstract
What the sources say
plaindirect- Asserted: passes — The authors put it forward as true.
- Checkable: passes — It can be checked against evidence.
- Load-bearing: passes — The paper’s conclusions depend on it.
- Based: passes — The paper gives a reason why it holds.
None of the sources cited for this claim have been checked yet.
In the paper
“In turn, ill health could be related to a reduction or cessation of alcohol consumption, introducing potential bias due to reverse causality, when interest is in studying the effect of alcohol consumption on subsequent health.4 5”
§ Strengthening the reporting of observational studies in epidemiology using mendelian randomisation (STROBE-MR): explanation and elaboration > Abstract
hedgedcorrelational- Asserted: passes — The authors put it forward as true.
- Checkable: passes — It can be checked against evidence.
- Load-bearing: passes — The paper’s conclusions depend on it.
- Based: passes — The paper gives a reason why it holds.
In the paper
“MR thus provides an opportunity to study the association between exposures and outcomes while reducing potential bias from confounding and reverse causation.9”
§ Strengthening the reporting of observational studies in epidemiology using mendelian randomisation (STROBE-MR): explanation and elaboration > Abstract
What the sources say
- Not checked yetcites [9] source
plaindirect- Asserted: passes — The authors put it forward as true.
- Checkable: passes — It can be checked against evidence.
- Load-bearing: passes — The paper’s conclusions depend on it.
- Based: passes — The paper gives a reason why it holds.
- Rests on an assumption: Genetic variation is essentially randomly inherited from parents to offspring at conception.
In the paper
“These genetic variations can be used as instrumental variables to analyse the effect of modifiable exposures on diseases through a study method termed mendelian randomisation (MR).8”
§ Strengthening the reporting of observational studies in epidemiology using mendelian randomisation (STROBE-MR): explanation and elaboration > Abstract
What the sources say
- Not checked yetcites [8] source
plaindirect- Asserted: passes — The authors put it forward as true.
- Checkable: passes — It can be checked against evidence.
- Load-bearing: passes — The paper’s conclusions depend on it.
- Based: passes — The paper gives a reason why it holds.
A conclusion the paper draws from its own results — it cites no other source for it, so there is none to check. The quote shows it is in the paper.
In the paper
“and consequently, many factors that confound the association between the exposure and outcome cannot affect the genetic variants.”
§ Strengthening the reporting of observational studies in epidemiology using mendelian randomisation (STROBE-MR): explanation and elaboration > Abstract
plain- Asserted: passes — The authors put it forward as true.
- Checkable: passes — It can be checked against evidence.
- Load-bearing: passes — The paper’s conclusions depend on it.
- Based: passes — The paper gives a reason why it holds.
- Rests on an assumption: Genetic variation is essentially randomly inherited from parents to offspring at conception.
- It may state two separate claims as one. 38
- Probably not a substantial claim. 103
- The quote only partly states this claim. 1
In the paper
“These features make genetic variants suitable candidates as instrumental variables, which can help estimate the causal effects of modifiable exposures on outcomes.7”
§ Strengthening the reporting of observational studies in epidemiology using mendelian randomisation (STROBE-MR): explanation and elaboration > Abstract
What the sources say
- Not checked yetcites [7] source
plainconditional- Asserted: passes — The authors put it forward as true.
- Checkable: passes — It can be checked against evidence.
- Load-bearing: passes — The paper’s conclusions depend on it.
- Based: passes — The paper gives a reason why it holds.
It may state two separate claims as one.
- Rests on an assumption: Genetic variation is essentially randomly inherited from parents to offspring at conception.
The paper states this without a source or data behind it here, so there is nothing to check it against. The quote shows it is in the paper.
In the paper
“MR is not limited to studies using genetic variants to generate instrumental variable estimates (box 1, table 1); however, these studies dominate the literature.”
§ Strengthening the reporting of observational studies in epidemiology using mendelian randomisation (STROBE-MR): explanation and elaboration > Abstract
plain- Asserted: passes — The authors put it forward as true.
- Checkable: passes — It can be checked against evidence.
- Load-bearing: fails — The paper’s conclusions may not depend on it.
- Based: passes — The paper gives a reason why it holds.
Probably not a substantial claim. The paper’s conclusions may not depend on it.
A conclusion the paper draws from its own results — it cites no other source for it, so there is none to check. The quote shows it is in the paper.
In the paper
“Mendelian randomisation (MR) studies allow a better understanding of the causal effects of modifiable exposures on health outcomes”
§ Strengthening the reporting of observational studies in epidemiology using mendelian randomisation (STROBE-MR): explanation and elaboration > Abstract
plaindirect- Asserted: passes — The authors put it forward as true.
- Checkable: passes — It can be checked against evidence.
- Load-bearing: passes — The paper’s conclusions depend on it.
- Based: fails — The paper may give no reason why it holds.
Probably not a substantial claim. The paper may give no reason why it holds.
None of the sources cited for this claim have been checked yet.
In the paper
“Indeed, the term “mendelian randomisation” was introduced in 1991 for investigations of bone marrow transplantation in the treatment of childhood malignancies.11 12”
§ Strengthening the reporting of observational studies in epidemiology using mendelian randomisation (STROBE-MR): explanation and elaboration > Abstract
What the sources say
- Not checked yetcites [11] Gray, 1991, How to avoid bias when comparing bone marrow transplantation with chemotherapy, Bone Marrow Transplant
- Not checked yetcites [12] Davey Smith G. Capitalising on Mendelian randomization to assess the effects of treatments. 2006. https://www.jameslindlibrary.org/articles/capitalising-on-mendelian-randomization-to-assess-the-effects-of-treatments/
plain- Asserted: passes — The authors put it forward as true.
- Checkable: passes — It can be checked against evidence.
- Load-bearing: fails — The paper’s conclusions may not depend on it.
- Based: passes — The paper gives a reason why it holds.
Probably not a substantial claim. The paper’s conclusions may not depend on it.
A conclusion the paper draws from its own results — it cites no other source for it, so there is none to check. The quote shows it is in the paper.
In the paper
“Having an HLA compatible sibling (as a matter of chance) could also serve as a genetic instrument for bone marrow transplantation, and so might be used to infer effects of transplantation on cancer outcomes.”
§ Strengthening the reporting of observational studies in epidemiology using mendelian randomisation (STROBE-MR): explanation and elaboration > Abstract
hedgedconditional- Asserted: passes — The authors put it forward as true.
- Checkable: passes — It can be checked against evidence.
- Load-bearing: passes — The paper’s conclusions depend on it.
- Based: passes — The paper gives a reason why it holds.
It may state two separate claims as one.
A conclusion the paper draws from its own results — it cites no other source for it, so there is none to check. The quote shows it is in the paper.
In the paper
“STROBE-MR (strengthening the reporting of observational studies in epidemiology using mendelian randomisation) assists authors in reporting their MR research clearly and transparently.”
§ Strengthening the reporting of observational studies in epidemiology using mendelian randomisation (STROBE-MR): explanation and elaboration > Abstract
plaindirect- Asserted: passes — The authors put it forward as true.
- Checkable: passes — It can be checked against evidence.
- Load-bearing: passes — The paper’s conclusions depend on it.
- Based: passes — The paper gives a reason why it holds.
Probably not a substantial claim.
- Rests on an assumption: Reporting guidelines help authors effectively communicate all critical information about what was done and what was found.
In the paper
“Concerns about violations of the independence assumption usually focus on confounding by ancestry (or population stratification). However, it can also be violated by various forms of selection or collider bias, by dynastic effects, or by assortative mating.62 63 64”
§ Strengthening the reporting of observational studies in epidemiology using mendelian randomisation (STROBE-MR): explanation and elaboration > Methods > Assumptions (item 5)
What the sources say
- Not checked yetcites 62 63 64
plaindirect- Asserted: passes — The authors put it forward as true.
- Checkable: passes — It can be checked against evidence.
- Load-bearing: unclear — It is unclear whether the paper’s conclusions depend on it.
- Based: passes — The paper gives a reason why it holds.
It may state two separate claims as one.
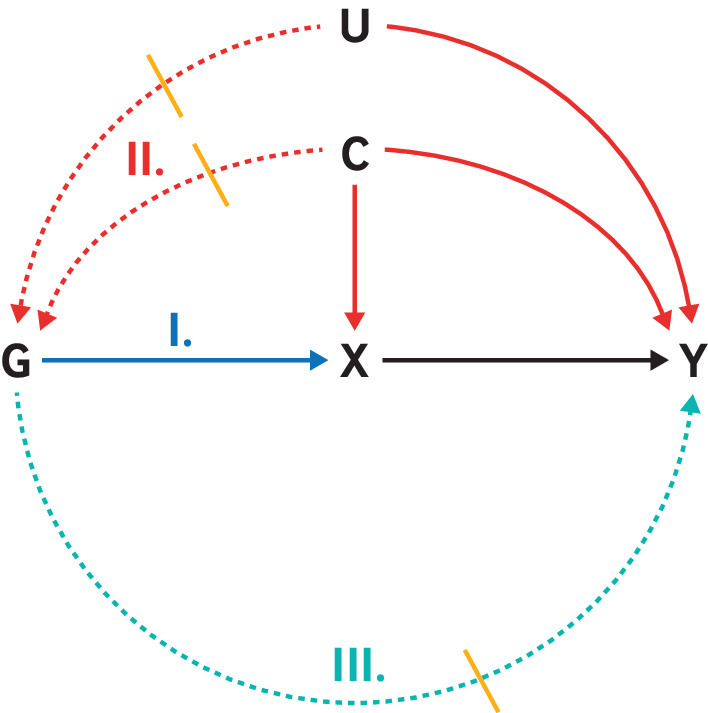
- The authors state this as an assumption: Independence: genetic variant G shares no unmeasured cause with outcome Y.
The paper states this without a source or data behind it here, so there is nothing to check it against. The quote shows it is in the paper.
In the paper
“Also, study methods could evolve over time.”
§ Strengthening the reporting of observational studies in epidemiology using mendelian randomisation (STROBE-MR): explanation and elaboration > Methods > Setting (item 4a)
hedged- Asserted: passes — The authors put it forward as true.
- Checkable: fails — It may be too vague to check against evidence.
- Load-bearing: fails — The paper’s conclusions may not depend on it.
- Based: fails — The paper may give no reason why it holds.
Probably not a substantial claim. It may be too vague to check against evidence. The paper’s conclusions may not depend on it. The paper may give no reason why it holds.
The paper states this without a source or data behind it here, so there is nothing to check it against. The quote shows it is in the paper.
In the paper
“Readers need information on the population(s) studied, setting, and locations to assess the context and generalisability of the study results.”
§ Strengthening the reporting of observational studies in epidemiology using mendelian randomisation (STROBE-MR): explanation and elaboration > Methods > Setting (item 4a)
plain- Asserted: passes — The authors put it forward as true.
- Checkable: fails — It may be too vague to check against evidence.
- Load-bearing: passes — The paper’s conclusions depend on it.
- Based: passes — The paper gives a reason why it holds.
Probably not a substantial claim. It may be too vague to check against evidence.
In the paper
“The inclusion of variants in high linkage disequilibrium might not contribute additional information in estimating the causal effect, and could even lead to biased estimates of standard errors if this correlation structure is not accounted for.47”
§ Strengthening the reporting of observational studies in epidemiology using mendelian randomisation (STROBE-MR): explanation and elaboration > Methods > Genetic variants (item 4c)
What the sources say
- Not checked yetcites [47] source
hedgedconditional- Asserted: passes — The authors put it forward as true.
- Checkable: passes — It can be checked against evidence.
- Load-bearing: passes — The paper’s conclusions depend on it.
- Based: passes — The paper gives a reason why it holds.
It may state two separate claims as one.
The paper states this without a source or data behind it here, so there is nothing to check it against. The quote shows it is in the paper.
In the paper
“The STROBE-MR (strengthening the reporting of observational studies in epidemiology using mendelian randomisation) guidelines are aimed at the (currently) large majority of MR studies that are implemented within an instrumental variable framework.”
§ Strengthening the reporting of observational studies in epidemiology using mendelian randomisation (STROBE-MR): explanation and elaboration > Abstract
plain- Asserted: passes — The authors put it forward as true.
- Checkable: passes — It can be checked against evidence.
- Load-bearing: passes — The paper’s conclusions depend on it.
- Based: passes — The paper gives a reason why it holds.
Probably not a substantial claim.
The paper states this without a source or data behind it here, so there is nothing to check it against. The quote shows it is in the paper.
In the paper
“Furthermore, sources of data could be from meta-analyses of multiple samples.”
§ Strengthening the reporting of observational studies in epidemiology using mendelian randomisation (STROBE-MR): explanation and elaboration > Methods > Study design and data sources (item 4)
hedged- Asserted: passes — The authors put it forward as true.
- Checkable: passes — It can be checked against evidence.
- Load-bearing: fails — The paper’s conclusions may not depend on it.
- Based: passes — The paper gives a reason why it holds.
Probably not a substantial claim. The paper’s conclusions may not depend on it.
In the paper
“MR Egger regression relaxes the exclusion restriction assumption but imposes an InSIDE assumption that the size of the direct effects of the genetic variants on the outcome that do not operate through the exposure are independent of the size of the genetic variants’ effects on the exposure.”
§ Strengthening the reporting of observational studies in epidemiology using mendelian randomisation (STROBE-MR): explanation and elaboration > Methods > Assumptions (item 5)
What the sources say
- Not checked yetcites [55] source
plain- Asserted: passes — The authors put it forward as true.
- Checkable: passes — It can be checked against evidence.
- Load-bearing: fails — The paper’s conclusions may not depend on it.
- Based: passes — The paper gives a reason why it holds.
Probably not a substantial claim. The paper’s conclusions may not depend on it. It may state two separate claims as one.
- The authors state this as an assumption: The size of the direct effects of the genetic variants on the outcome that do not operate through the exposure are independent of the size of the genetic variants’ effects on the exposure (InSIDE).
The paper states this without a source or data behind it here, so there is nothing to check it against. The quote shows it is in the paper.
In the paper
“Articulating the assumptions also motivates sensitivity analyses and other additional analyses used to assess the assumptions or the robustness of conclusions to their violations.”
§ Strengthening the reporting of observational studies in epidemiology using mendelian randomisation (STROBE-MR): explanation and elaboration > Methods > Assumptions (item 5)
plaindirect- Asserted: passes — The authors put it forward as true.
- Checkable: fails — It may be too vague to check against evidence.
- Load-bearing: fails — The paper’s conclusions may not depend on it.
- Based: passes — The paper gives a reason why it holds.
Probably not a substantial claim. It may be too vague to check against evidence. The paper’s conclusions may not depend on it.
In the paper
“Power calculations provide information about sample sizes needed to obtain appropriate power for desired precision of the effect estimate,43 44”
§ Strengthening the reporting of observational studies in epidemiology using mendelian randomisation (STROBE-MR): explanation and elaboration > Methods > Participants (item 4b)
What the sources say
- Not checked yetcites 43 44
plaindirect- Asserted: passes — The authors put it forward as true.
- Checkable: passes — It can be checked against evidence.
- Load-bearing: fails — The paper’s conclusions may not depend on it.
- Based: passes — The paper gives a reason why it holds.
Probably not a substantial claim. The paper’s conclusions may not depend on it.
The paper states this without a source or data behind it here, so there is nothing to check it against. The quote shows it is in the paper.
In the paper
“Some MR studies draw on multiple sources of data (eg, different sources for the ascertainment of the association between the genetic variant and exposure, and for the association between the genetic variant and outcome).”
§ Strengthening the reporting of observational studies in epidemiology using mendelian randomisation (STROBE-MR): explanation and elaboration > Methods > Study design and data sources (item 4)
plain- Asserted: passes — The authors put it forward as true.
- Checkable: passes — It can be checked against evidence.
- Load-bearing: fails — The paper’s conclusions may not depend on it.
- Based: passes — The paper gives a reason why it holds.
Probably not a substantial claim. The paper’s conclusions may not depend on it.
None of the sources cited for this claim have been checked yet.
In the paper
“When instrumental variable estimation is used to obtain effect estimates, a fourth assumption should then be stated: typically, an assumption of effect homogeneity53 or monotonicity.54”
§ Strengthening the reporting of observational studies in epidemiology using mendelian randomisation (STROBE-MR): explanation and elaboration > Methods > Assumptions (item 5)
plaindirect- Asserted: passes — The authors put it forward as true.
- Checkable: passes — It can be checked against evidence.
- Load-bearing: passes — The paper’s conclusions depend on it.
- Based: passes — The paper gives a reason why it holds.
Probably not a substantial claim.
The paper states this without a source or data behind it here, so there is nothing to check it against. The quote shows it is in the paper.
In the paper
“Additionally, the two sample MR approach assumes that the association between the genetic variants and the exposure is the same in the two samples, which might not hold if samples are selected from different subpopulations (eg, by sex, age, ethnicity).”
§ Strengthening the reporting of observational studies in epidemiology using mendelian randomisation (STROBE-MR): explanation and elaboration > Methods > Assumptions (item 5)
hedged- Asserted: passes — The authors put it forward as true.
- Checkable: passes — It can be checked against evidence.
- Load-bearing: fails — The paper’s conclusions may not depend on it.
- Based: fails — The paper may give no reason why it holds.
Probably not a substantial claim. The paper’s conclusions may not depend on it. The paper may give no reason why it holds. It may state two separate claims as one.
- The authors state this as an assumption: The association between the genetic variants and the exposure is the same in the two samples (two sample MR).
The paper states this without a source or data behind it here, so there is nothing to check it against. The quote shows it is in the paper.
In the paper
“In a two sample MR study, one stage can use summary data and another stage can use individual level data.”
§ Strengthening the reporting of observational studies in epidemiology using mendelian randomisation (STROBE-MR): explanation and elaboration > Methods > Study design and data sources (item 4)
plain- Asserted: passes — The authors put it forward as true.
- Checkable: passes — It can be checked against evidence.
- Load-bearing: fails — The paper’s conclusions may not depend on it.
- Based: passes — The paper gives a reason why it holds.
Probably not a substantial claim. The paper’s conclusions may not depend on it.
In the paper
“As in STROBE,26 presenting critical elements of study design early in the article allows readers to orient themselves on the study basics.”
§ Strengthening the reporting of observational studies in epidemiology using mendelian randomisation (STROBE-MR): explanation and elaboration > Methods > Study design and data sources (item 4)
What the sources say
- Not checked yetcites [26] source
plaindirect- Asserted: passes — The authors put it forward as true.
- Checkable: fails — It may be too vague to check against evidence.
- Load-bearing: fails — The paper’s conclusions may not depend on it.
- Based: passes — The paper gives a reason why it holds.
Probably not a substantial claim. It may be too vague to check against evidence. The paper’s conclusions may not depend on it.
The paper states this without a source or data behind it here, so there is nothing to check it against. The quote shows it is in the paper.
In the paper
“The STROBE-MR reporting guidelines are meant to apply to studies that use properties of germline genetic variants to strengthen causal inference regarding possible effects of potentially modifiable exposures on outcomes.”
§ Strengthening the reporting of observational studies in epidemiology using mendelian randomisation (STROBE-MR): explanation and elaboration > Development, scope, and intended use of STROBE-MR
plain- Asserted: passes — The authors put it forward as true.
- Checkable: passes — It can be checked against evidence.
- Load-bearing: passes — The paper’s conclusions depend on it.
- Based: passes — The paper gives a reason why it holds.
Probably not a substantial claim.
None of the sources cited for this claim have been checked yet.
In the paper
“The STROBE (strengthening the reporting of observational studies in epidemiology) guidelines for observational research25 26 were developed for the three main study designs in epidemiology (cohort, case-control, and cross sectional studies).”
§ Strengthening the reporting of observational studies in epidemiology using mendelian randomisation (STROBE-MR): explanation and elaboration > Strengthening the reporting of MR studies
plain- Asserted: passes — The authors put it forward as true.
- Checkable: passes — It can be checked against evidence.
- Load-bearing: fails — The paper’s conclusions may not depend on it.
- Based: passes — The paper gives a reason why it holds.
Probably not a substantial claim. The paper’s conclusions may not depend on it.
The paper states this without a source or data behind it here, so there is nothing to check it against. The quote shows it is in the paper.
In the paper
“MR can be used to test causal null hypotheses or estimate point, period, or lifetime effects.”
§ Strengthening the reporting of observational studies in epidemiology using mendelian randomisation (STROBE-MR): explanation and elaboration > Introduction > Background (item 2)
plain- Asserted: passes — The authors put it forward as true.
- Checkable: passes — It can be checked against evidence.
- Load-bearing: fails — The paper’s conclusions may not depend on it.
- Based: passes — The paper gives a reason why it holds.
Probably not a substantial claim. The paper’s conclusions may not depend on it. It may state two separate claims as one.
None of the sources cited for this claim have been checked yet.
In the paper
“Estimating effect sizes through the instrumental variable approach imposes a fourth assumption, usually homogeneity of effects of the exposure on the outcome.16 58 59 60”
§ Strengthening the reporting of observational studies in epidemiology using mendelian randomisation (STROBE-MR): explanation and elaboration > Methods > Assumptions (item 5)
What the sources say
- Not checked yetcites [16] source
- Not checked yetcites 58 59 60
plaindirect- Asserted: passes — The authors put it forward as true.
- Checkable: passes — It can be checked against evidence.
- Load-bearing: fails — The paper’s conclusions may not depend on it.
- Based: passes — The paper gives a reason why it holds.
Probably not a substantial claim. The paper’s conclusions may not depend on it.
- The authors state this as an assumption: The exposure has the same effects in everyone (homogeneity).
The paper states this without a source or data behind it here, so there is nothing to check it against. The quote shows it is in the paper.
In the paper
“Other aspects, such as temporal stability of association, population specificity, or biological plausability, could help understand the selected genetic variants’ validity to be used as instrumental variables.”
§ Strengthening the reporting of observational studies in epidemiology using mendelian randomisation (STROBE-MR): explanation and elaboration > Methods > Genetic variants (item 4c)
hedgedcorrelational- Asserted: passes — The authors put it forward as true.
- Checkable: fails — It may be too vague to check against evidence.
- Load-bearing: fails — The paper’s conclusions may not depend on it.
- Based: fails — The paper may give no reason why it holds.
Probably not a substantial claim. It may be too vague to check against evidence. The paper’s conclusions may not depend on it. The paper may give no reason why it holds.
A conclusion the paper draws from its own results — it cites no other source for it, so there is none to check. The quote shows it is in the paper.
In the paper
“Some STROBE items are either too general or do not apply to MR studies, while other items relevant to MR studies are missing.”
§ Strengthening the reporting of observational studies in epidemiology using mendelian randomisation (STROBE-MR): explanation and elaboration > Strengthening the reporting of MR studies
plain- Asserted: passes — The authors put it forward as true.
- Checkable: passes — It can be checked against evidence.
- Load-bearing: passes — The paper’s conclusions depend on it.
- Based: passes — The paper gives a reason why it holds.
It may state two separate claims as one.
The paper states this without a source or data behind it here, so there is nothing to check it against. The quote shows it is in the paper.
In the paper
“When planning a study or interpreting the analysis results, information about the sample size is essential.”
§ Strengthening the reporting of observational studies in epidemiology using mendelian randomisation (STROBE-MR): explanation and elaboration > Methods > Participants (item 4b)
plain- Asserted: passes — The authors put it forward as true.
- Checkable: fails — It may be too vague to check against evidence.
- Load-bearing: fails — The paper’s conclusions may not depend on it.
- Based: passes — The paper gives a reason why it holds.
Probably not a substantial claim. It may be too vague to check against evidence. The paper’s conclusions may not depend on it.
A conclusion the paper draws from its own results — it cites no other source for it, so there is none to check. The quote shows it is in the paper.
In the paper
“Statistical power is best ascertained by examination of the 95% confidence intervals of the estimates, since they require fewer assumptions than pre-experiment power calculations.”
§ Strengthening the reporting of observational studies in epidemiology using mendelian randomisation (STROBE-MR): explanation and elaboration > Methods > Participants (item 4b)
plaindirect- Asserted: passes — The authors put it forward as true.
- Checkable: passes — It can be checked against evidence.
- Load-bearing: fails — The paper’s conclusions may not depend on it.
- Based: passes — The paper gives a reason why it holds.
Probably not a substantial claim. The paper’s conclusions may not depend on it.
None of the sources cited for this claim have been checked yet.
In the paper
“Described in detail elsewhere,27 we established this initiative in 2018, following guidance for the development of medical research reporting guidelines.28”
§ Strengthening the reporting of observational studies in epidemiology using mendelian randomisation (STROBE-MR): explanation and elaboration > Development, scope, and intended use of STROBE-MR
plaindirect- Asserted: passes — The authors put it forward as true.
- Checkable: passes — It can be checked against evidence.
- Load-bearing: fails — The paper’s conclusions may not depend on it.
- Based: passes — The paper gives a reason why it holds.
Probably not a substantial claim. The paper’s conclusions may not depend on it. It may state two separate claims as one.
The paper states this without a source or data behind it here, so there is nothing to check it against. The quote shows it is in the paper.
In the paper
“When multiple variants are used in the analysis, these assumptions pertain to each of the variants.”
§ Strengthening the reporting of observational studies in epidemiology using mendelian randomisation (STROBE-MR): explanation and elaboration > Methods > Assumptions (item 5)
plain- Asserted: passes — The authors put it forward as true.
- Checkable: passes — It can be checked against evidence.
- Load-bearing: fails — The paper’s conclusions may not depend on it.
- Based: fails — The paper may give no reason why it holds.
Probably not a substantial claim. The paper’s conclusions may not depend on it. The paper may give no reason why it holds.
- The authors state this as an assumption: Relevance: genetic variant G is associated with the exposure of interest X.
- The authors state this as an assumption: Independence: genetic variant G shares no unmeasured cause with outcome Y.
- The authors state this as an assumption: Exclusion restriction: genetic variant G does not affect outcome Y except through its potential effect on the exposure of interest X.
The paper states this without a source or data behind it here, so there is nothing to check it against. The quote shows it is in the paper.
In the paper
“Explicitly stating the three core instrumental variable assumptions, ideally in the methods sections, can help readers to understand the underlying premises of the MR method, and to allow them to judge their validity.”
§ Strengthening the reporting of observational studies in epidemiology using mendelian randomisation (STROBE-MR): explanation and elaboration > Methods > Assumptions (item 5)
plainconditional- Asserted: passes — The authors put it forward as true.
- Checkable: fails — It may be too vague to check against evidence.
- Load-bearing: passes — The paper’s conclusions depend on it.
- Based: passes — The paper gives a reason why it holds.
Probably not a substantial claim. It may be too vague to check against evidence.
The paper states this without a source or data behind it here, so there is nothing to check it against. The quote shows it is in the paper.
In the paper
“For two sample MR, this information will often require referring to supplementary material presented in previously published articles.”
§ Strengthening the reporting of observational studies in epidemiology using mendelian randomisation (STROBE-MR): explanation and elaboration > Methods > Genetic variants (item 4c)
hedged- Asserted: passes — The authors put it forward as true.
- Checkable: fails — It may be too vague to check against evidence.
- Load-bearing: fails — The paper’s conclusions may not depend on it.
- Based: passes — The paper gives a reason why it holds.
Probably not a substantial claim. It may be too vague to check against evidence. The paper’s conclusions may not depend on it.
The paper states this without a source or data behind it here, so there is nothing to check it against. The quote shows it is in the paper.
In the paper
“Two sample MR studies are most commonly conducted with summary level data, where the weights are derived from the first sample, which are then applied in the second sample to estimate the gene-outcome association.”
§ Strengthening the reporting of observational studies in epidemiology using mendelian randomisation (STROBE-MR): explanation and elaboration > Development, scope, and intended use of STROBE-MR
plain- Asserted: passes — The authors put it forward as true.
- Checkable: passes — It can be checked against evidence.
- Load-bearing: fails — The paper’s conclusions may not depend on it.
- Based: fails — The paper may give no reason why it holds.
Probably not a substantial claim. The paper’s conclusions may not depend on it. The paper may give no reason why it holds.
In the paper
“The exclusion restriction is sometimes also referred to as an assumption of no horizontal pleiotropy (box 3), but it can be violated in several other ways (eg, by gene-exposure interaction, by having some form of time varying exposures, by measurement error in the exposure that is related to the instrument or by a multi-component exposure).59”
§ Strengthening the reporting of observational studies in epidemiology using mendelian randomisation (STROBE-MR): explanation and elaboration > Methods > Assumptions (item 5)
What the sources say
- Not checked yetcites [59] source
plaindirect- Asserted: passes — The authors put it forward as true.
- Checkable: passes — It can be checked against evidence.
- Load-bearing: unclear — It is unclear whether the paper’s conclusions depend on it.
- Based: passes — The paper gives a reason why it holds.
It may state two separate claims as one.
- The authors state this as an assumption: Exclusion restriction: genetic variant G does not affect outcome Y except through its potential effect on the exposure of interest X.
The paper states this without a source or data behind it here, so there is nothing to check it against. The quote shows it is in the paper.
In the paper
“The F statistic can also be approximated using summary level data.”
§ Strengthening the reporting of observational studies in epidemiology using mendelian randomisation (STROBE-MR): explanation and elaboration > Methods > Assumptions (item 5)
plain- Asserted: passes — The authors put it forward as true.
- Checkable: passes — It can be checked against evidence.
- Load-bearing: fails — The paper’s conclusions may not depend on it.
- Based: passes — The paper gives a reason why it holds.
Probably not a substantial claim. The paper’s conclusions may not depend on it.
A conclusion the paper draws from its own results — it cites no other source for it, so there is none to check. The quote shows it is in the paper.
In the paper
“Other study designs, such as twin studies, also use the basic principles of mendelian genetics and so can be considered a form of MR.”
§ Strengthening the reporting of observational studies in epidemiology using mendelian randomisation (STROBE-MR): explanation and elaboration > Abstract
plain- Asserted: passes — The authors put it forward as true.
- Checkable: passes — It can be checked against evidence.
- Load-bearing: fails — The paper’s conclusions may not depend on it.
- Based: passes — The paper gives a reason why it holds.
Probably not a substantial claim. The paper’s conclusions may not depend on it. It may state two separate claims as one.
The paper states this without a source or data behind it here, so there is nothing to check it against. The quote shows it is in the paper.
In the paper
“The independence assumption cannot be directly verified, but it can be partially assessed in many research settings.”
§ Strengthening the reporting of observational studies in epidemiology using mendelian randomisation (STROBE-MR): explanation and elaboration > Methods > Assumptions (item 5)
plain- Asserted: passes — The authors put it forward as true.
- Checkable: passes — It can be checked against evidence.
- Load-bearing: unclear — It is unclear whether the paper’s conclusions depend on it.
- Based: passes — The paper gives a reason why it holds.
It may state two separate claims as one.
- The authors state this as an assumption: Independence: genetic variant G shares no unmeasured cause with outcome Y.
The paper states this without a source or data behind it here, so there is nothing to check it against. The quote shows it is in the paper.
In the paper
“Providing a description of the ancestry of the participants will help understand potential sources of heterogeneity and generalisability of results.”
§ Strengthening the reporting of observational studies in epidemiology using mendelian randomisation (STROBE-MR): explanation and elaboration > Methods > Setting (item 4a)
plaincorrelational- Asserted: passes — The authors put it forward as true.
- Checkable: fails — It may be too vague to check against evidence.
- Load-bearing: fails — The paper’s conclusions may not depend on it.
- Based: passes — The paper gives a reason why it holds.
Probably not a substantial claim. It may be too vague to check against evidence. The paper’s conclusions may not depend on it.
The paper states this without a source or data behind it here, so there is nothing to check it against. The quote shows it is in the paper.
In the paper
“Exposures such as environmental factors and therapies can change over time.”
§ Strengthening the reporting of observational studies in epidemiology using mendelian randomisation (STROBE-MR): explanation and elaboration > Methods > Setting (item 4a)
plain- Asserted: passes — The authors put it forward as true.
- Checkable: fails — It may be too vague to check against evidence.
- Load-bearing: fails — The paper’s conclusions may not depend on it.
- Based: fails — The paper may give no reason why it holds.
Probably not a substantial claim. It may be too vague to check against evidence. The paper’s conclusions may not depend on it. The paper may give no reason why it holds.
The paper states this without a source or data behind it here, so there is nothing to check it against. The quote shows it is in the paper.
In the paper
“Detailed descriptions of the study participants and sampling frame help readers understand the applicability of the results.”
§ Strengthening the reporting of observational studies in epidemiology using mendelian randomisation (STROBE-MR): explanation and elaboration > Methods > Participants (item 4b)
plaindirect- Asserted: passes — The authors put it forward as true.
- Checkable: fails — It may be too vague to check against evidence.
- Load-bearing: fails — The paper’s conclusions may not depend on it.
- Based: passes — The paper gives a reason why it holds.
Probably not a substantial claim. It may be too vague to check against evidence. The paper’s conclusions may not depend on it.
In the paper
“Reporting the F statistic, if individual level data are available, provides several advantages for understanding the risk of weak instrument bias.65”
§ Strengthening the reporting of observational studies in epidemiology using mendelian randomisation (STROBE-MR): explanation and elaboration > Methods > Assumptions (item 5)
What the sources say
- Not checked yetcites [65] source
plaindirect- Asserted: passes — The authors put it forward as true.
- Checkable: passes — It can be checked against evidence.
- Load-bearing: fails — The paper’s conclusions may not depend on it.
- Based: passes — The paper gives a reason why it holds.
Probably not a substantial claim. The paper’s conclusions may not depend on it.
In the paper
“The homogeneity assumption can also be replaced by imposing a monotonicity assumption that an increase in the number of risk alleles does not lower the likelihood of exposure for any individuals, typically leading to estimating an effect in a subgroup of the study population.61”
§ Strengthening the reporting of observational studies in epidemiology using mendelian randomisation (STROBE-MR): explanation and elaboration > Methods > Assumptions (item 5)
What the sources say
- Not checked yetcites [61] source
plaindirect- Asserted: passes — The authors put it forward as true.
- Checkable: passes — It can be checked against evidence.
- Load-bearing: fails — The paper’s conclusions may not depend on it.
- Based: passes — The paper gives a reason why it holds.
Probably not a substantial claim. The paper’s conclusions may not depend on it. It may state two separate claims as one.
- The authors state this as an assumption: An increase in the number of risk alleles does not lower the likelihood of exposure for any individuals (monotonicity).
None of the sources cited for this claim have been checked yet.
In the paper
“Reporting associations between measured covariates that might confound the variant-outcome association can also prove helpful, particularly if scaled by instrument strength67 68 or presented alongside a related bias analytical approach.69”
§ Strengthening the reporting of observational studies in epidemiology using mendelian randomisation (STROBE-MR): explanation and elaboration > Methods > Assumptions (item 5)
What the sources say
- Not checked yetcites 67 68
- Not checked yetcites [69] source
plain- Asserted: passes — The authors put it forward as true.
- Checkable: fails — It may be too vague to check against evidence.
- Load-bearing: fails — The paper’s conclusions may not depend on it.
- Based: passes — The paper gives a reason why it holds.
Probably not a substantial claim. It may be too vague to check against evidence. The paper’s conclusions may not depend on it.
- The authors state this as an assumption: Independence: genetic variant G shares no unmeasured cause with outcome Y.
The paper states this without a source or data behind it here, so there is nothing to check it against. The quote shows it is in the paper.
In the paper
“The word “causal” should be used carefully, because MR only provides estimates intended to inform our understanding of causal associations under specific assumptions.”
§ Strengthening the reporting of observational studies in epidemiology using mendelian randomisation (STROBE-MR): explanation and elaboration > Title and abstract (item 1) > Abstract
plainconditional- Asserted: passes — The authors put it forward as true.
- Checkable: passes — It can be checked against evidence.
- Load-bearing: passes — The paper’s conclusions depend on it.
- Based: passes — The paper gives a reason why it holds.
Probably not a substantial claim.
The paper states this without a source or data behind it here, so there is nothing to check it against. The quote shows it is in the paper.
In the paper
“In case-control studies, the choice of cases and controls is crucial to interpreting the results, and the method of their selection has major implications for study validity.”
§ Strengthening the reporting of observational studies in epidemiology using mendelian randomisation (STROBE-MR): explanation and elaboration > Methods > Participants (item 4b)
plaindirect- Asserted: passes — The authors put it forward as true.
- Checkable: fails — It may be too vague to check against evidence.
- Load-bearing: fails — The paper’s conclusions may not depend on it.
- Based: fails — The paper may give no reason why it holds.
Probably not a substantial claim. It may be too vague to check against evidence. The paper’s conclusions may not depend on it. The paper may give no reason why it holds. It may state two separate claims as one.
The paper states this without a source or data behind it here, so there is nothing to check it against. The quote shows it is in the paper.
In the paper
“Providing information on the ascertainment of genotypes and their quality control will enable readers to assess the quality of the genetic variants used in the study.”
§ Strengthening the reporting of observational studies in epidemiology using mendelian randomisation (STROBE-MR): explanation and elaboration > Methods > Genetic variants (item 4c)
plaindirect- Asserted: passes — The authors put it forward as true.
- Checkable: fails — It may be too vague to check against evidence.
- Load-bearing: fails — The paper’s conclusions may not depend on it.
- Based: passes — The paper gives a reason why it holds.
Probably not a substantial claim. It may be too vague to check against evidence. The paper’s conclusions may not depend on it.
The paper states this without a source or data behind it here, so there is nothing to check it against. The quote shows it is in the paper.
In the paper
“Knowing when a study took place and over what period participants were recruited and followed up puts the study in historical context, which is essential for interpreting results.”
§ Strengthening the reporting of observational studies in epidemiology using mendelian randomisation (STROBE-MR): explanation and elaboration > Methods > Setting (item 4a)
plaindirect- Asserted: passes — The authors put it forward as true.
- Checkable: fails — It may be too vague to check against evidence.
- Load-bearing: fails — The paper’s conclusions may not depend on it.
- Based: passes — The paper gives a reason why it holds.
Probably not a substantial claim. It may be too vague to check against evidence. The paper’s conclusions may not depend on it.
The paper states this without a source or data behind it here, so there is nothing to check it against. The quote shows it is in the paper.
In the paper
“Instead, the estimation is replaced by testing for a non-null effect.”
§ Strengthening the reporting of observational studies in epidemiology using mendelian randomisation (STROBE-MR): explanation and elaboration > Results > Main results (item 11)
plain- Asserted: passes — The authors put it forward as true.
- Checkable: passes — It can be checked against evidence.
- Load-bearing: fails — The paper’s conclusions may not depend on it.
- Based: passes — The paper gives a reason why it holds.
Probably not a substantial claim. The paper’s conclusions may not depend on it. The quote only partly states this claim.
A conclusion the paper draws from its own results — it cites no other source for it, so there is none to check. The quote shows it is in the paper.
In the paper
“Although this test is often interpreted as an assessment of the exclusion restriction, it is jointly testing the exclusion restriction, independence, and homogeneity assumptions.”
§ Strengthening the reporting of observational studies in epidemiology using mendelian randomisation (STROBE-MR): explanation and elaboration > Methods > Assumptions (item 5)
plain- Asserted: passes — The authors put it forward as true.
- Checkable: passes — It can be checked against evidence.
- Load-bearing: passes — The paper’s conclusions depend on it.
- Based: passes — The paper gives a reason why it holds.
It may state two separate claims as one.
- The authors state this as an assumption: Relevance: genetic variant G is associated with the exposure of interest X.
- The authors state this as an assumption: Independence: genetic variant G shares no unmeasured cause with outcome Y.
- The authors state this as an assumption: Exclusion restriction: genetic variant G does not affect outcome Y except through its potential effect on the exposure of interest X.
- The authors state this as an assumption: The exposure has the same effects in everyone (homogeneity).
The paper states this without a source or data behind it here, so there is nothing to check it against. The quote shows it is in the paper.
In the paper
“Evidence on the consistency of the genetic variant’s association with the exposure or outcome helps to understand the degree of heterogeneity of effects.”
§ Strengthening the reporting of observational studies in epidemiology using mendelian randomisation (STROBE-MR): explanation and elaboration > Results > Descriptive data (item 10)
plaincorrelational- Asserted: passes — The authors put it forward as true.
- Checkable: passes — It can be checked against evidence.
- Load-bearing: fails — The paper’s conclusions may not depend on it.
- Based: passes — The paper gives a reason why it holds.
Probably not a substantial claim. The paper’s conclusions may not depend on it.
The paper states this without a source or data behind it here, so there is nothing to check it against. The quote shows it is in the paper.
In the paper
“While many assumptions cannot be verified, there are methods available to attempt to falsify them.”
§ Strengthening the reporting of observational studies in epidemiology using mendelian randomisation (STROBE-MR): explanation and elaboration > Methods > Assessment of assumptions (item 7)
plain- Asserted: passes — The authors put it forward as true.
- Checkable: passes — It can be checked against evidence.
- Load-bearing: passes — The paper’s conclusions depend on it.
- Based: passes — The paper gives a reason why it holds.
Probably not a substantial claim. It may state two separate claims as one.
A conclusion the paper draws from its own results — it cites no other source for it, so there is none to check. The quote shows it is in the paper.
In the paper
“However, if the homogeneity and monotonicity assumptions do not hold, it might be preferable not to report the estimates and outline this situation.”
§ Strengthening the reporting of observational studies in epidemiology using mendelian randomisation (STROBE-MR): explanation and elaboration > Results > Main results (item 11)
hedged- Asserted: passes — The authors put it forward as true.
- Checkable: fails — It may be too vague to check against evidence.
- Load-bearing: fails — The paper’s conclusions may not depend on it.
- Based: passes — The paper gives a reason why it holds.
Probably not a substantial claim. It may be too vague to check against evidence. The paper’s conclusions may not depend on it.
The paper states this without a source or data behind it here, so there is nothing to check it against. The quote shows it is in the paper.
In the paper
“Readers can assess group differences better if the descriptive statistics are provided for each category separately.”
§ Strengthening the reporting of observational studies in epidemiology using mendelian randomisation (STROBE-MR): explanation and elaboration > Results > Descriptive data (item 10)
plaindirect- Asserted: passes — The authors put it forward as true.
- Checkable: fails — It may be too vague to check against evidence.
- Load-bearing: fails — The paper’s conclusions may not depend on it.
- Based: passes — The paper gives a reason why it holds.
Probably not a substantial claim. It may be too vague to check against evidence. The paper’s conclusions may not depend on it.
The paper states this without a source or data behind it here, so there is nothing to check it against. The quote shows it is in the paper.
In the paper
“Distributions of continuous variables are easily summarised by mean and standard deviation, or by median and percentile range (eg, 25th and 75th percentiles) in case of asymmetrical distribution.”
§ Strengthening the reporting of observational studies in epidemiology using mendelian randomisation (STROBE-MR): explanation and elaboration > Results > Descriptive data (item 10)
plain- Asserted: passes — The authors put it forward as true.
- Checkable: fails — It may be too vague to check against evidence.
- Load-bearing: fails — The paper’s conclusions may not depend on it.
- Based: passes — The paper gives a reason why it holds.
Probably not a substantial claim. It may be too vague to check against evidence. The paper’s conclusions may not depend on it. It may state two separate claims as one.
The paper states this without a source or data behind it here, so there is nothing to check it against. The quote shows it is in the paper.
In the paper
“Information on study participants will help readers understand the target population and assess the validity and generalisability of results.”
§ Strengthening the reporting of observational studies in epidemiology using mendelian randomisation (STROBE-MR): explanation and elaboration > Results > Descriptive data (item 10)
plaindirect- Asserted: passes — The authors put it forward as true.
- Checkable: fails — It may be too vague to check against evidence.
- Load-bearing: fails — The paper’s conclusions may not depend on it.
- Based: passes — The paper gives a reason why it holds.
Probably not a substantial claim. It may be too vague to check against evidence. The paper’s conclusions may not depend on it.
The paper states this without a source or data behind it here, so there is nothing to check it against. The quote shows it is in the paper.
In the paper
“Furthermore, a global exploration of the homogeneity assumption can examine any differences in variance of a continuous outcome across the genetic instrument; the extent of such differences provides evidence as to extent of violation of the homogeneity assumption.”
§ Strengthening the reporting of observational studies in epidemiology using mendelian randomisation (STROBE-MR): explanation and elaboration > Methods > Assumptions (item 5)
plaincorrelational- Asserted: passes — The authors put it forward as true.
- Checkable: passes — It can be checked against evidence.
- Load-bearing: fails — The paper’s conclusions may not depend on it.
- Based: fails — The paper may give no reason why it holds.
Probably not a substantial claim. The paper’s conclusions may not depend on it. The paper may give no reason why it holds. It may state two separate claims as one.
- The authors state this as an assumption: The exposure has the same effects in everyone (homogeneity).
The paper states this without a source or data behind it here, so there is nothing to check it against. The quote shows it is in the paper.
In the paper
“Reporting on the association between the genetic variant and the outcome is useful because it can provide an initial indication about the possibility of a causal association between the exposure and outcome.”
§ Strengthening the reporting of observational studies in epidemiology using mendelian randomisation (STROBE-MR): explanation and elaboration > Results > Main results (item 11)
plainconditional- Asserted: passes — The authors put it forward as true.
- Checkable: fails — It may be too vague to check against evidence.
- Load-bearing: fails — The paper’s conclusions may not depend on it.
- Based: passes — The paper gives a reason why it holds.
Probably not a substantial claim. It may be too vague to check against evidence. The paper’s conclusions may not depend on it.
A conclusion the paper draws from its own results — it cites no other source for it, so there is none to check. The quote shows it is in the paper.
In the paper
“If the results from all the approaches are largely consistent, author can have more confidence in drawing robust conclusions regarding the presence and magnitude of a causal effect.”
§ Strengthening the reporting of observational studies in epidemiology using mendelian randomisation (STROBE-MR): explanation and elaboration > Results > Sensitivity analyses and additional analyses (item 13)
plain- Asserted: passes — The authors put it forward as true.
- Checkable: fails — It may be too vague to check against evidence.
- Load-bearing: passes — The paper’s conclusions depend on it.
- Based: passes — The paper gives a reason why it holds.
Probably not a substantial claim. It may be too vague to check against evidence.
The paper states this without a source or data behind it here, so there is nothing to check it against. The quote shows it is in the paper.
In the paper
“Independent replication of MR findings in an independent dataset or with a different study design (eg, one sample v two sample MR) is typically advocated to assess the findings’ robustness.”
§ Strengthening the reporting of observational studies in epidemiology using mendelian randomisation (STROBE-MR): explanation and elaboration > Methods > Assumptions (item 5)
plain- Asserted: passes — The authors put it forward as true.
- Checkable: passes — It can be checked against evidence.
- Load-bearing: fails — The paper’s conclusions may not depend on it.
- Based: passes — The paper gives a reason why it holds.
Probably not a substantial claim. The paper’s conclusions may not depend on it.
- The authors state this as an assumption: Relevance: genetic variant G is associated with the exposure of interest X.
- The authors state this as an assumption: Independence: genetic variant G shares no unmeasured cause with outcome Y.
- The authors state this as an assumption: Exclusion restriction: genetic variant G does not affect outcome Y except through its potential effect on the exposure of interest X.
- The authors state this as an assumption: The exposure has the same effects in everyone (homogeneity).
The paper states this without a source or data behind it here, so there is nothing to check it against. The quote shows it is in the paper.
In the paper
“Reporting the association between the genetic variant and the exposure is required to evaluate the relevance assumption (item 8b).”
§ Strengthening the reporting of observational studies in epidemiology using mendelian randomisation (STROBE-MR): explanation and elaboration > Results > Main results (item 11)
plaincorrelational- Asserted: passes — The authors put it forward as true.
- Checkable: passes — It can be checked against evidence.
- Load-bearing: passes — The paper’s conclusions depend on it.
- Based: passes — The paper gives a reason why it holds.
Probably not a substantial claim.
The paper states this without a source or data behind it here, so there is nothing to check it against. The quote shows it is in the paper.
In the paper
“The use of known biological effects of a SNP can also be leveraged to decrease the probability of violation of this assumption.”
§ Strengthening the reporting of observational studies in epidemiology using mendelian randomisation (STROBE-MR): explanation and elaboration > Methods > Assumptions (item 5)
plaindirect- Asserted: passes — The authors put it forward as true.
- Checkable: passes — It can be checked against evidence.
- Load-bearing: fails — The paper’s conclusions may not depend on it.
- Based: passes — The paper gives a reason why it holds.
Probably not a substantial claim. The paper’s conclusions may not depend on it.
- The authors state this as an assumption: Exclusion restriction: genetic variant G does not affect outcome Y except through its potential effect on the exposure of interest X.
In the paper
“The E value69 can be used to understand the degree to which unmeasured confounding might explain findings.”
§ Strengthening the reporting of observational studies in epidemiology using mendelian randomisation (STROBE-MR): explanation and elaboration > Results > Assessment of assumptions (item 12)
What the sources say
- Not checked yetcites [69] source
plain- Asserted: passes — The authors put it forward as true.
- Checkable: passes — It can be checked against evidence.
- Load-bearing: fails — The paper’s conclusions may not depend on it.
- Based: passes — The paper gives a reason why it holds.
Probably not a substantial claim. The paper’s conclusions may not depend on it.
The paper states this without a source or data behind it here, so there is nothing to check it against. The quote shows it is in the paper.
In the paper
“The first three core assumptions pertain to any MR analysis with a single instrument; the additional assumptions are needed for instrumental variable estimation.”
§ Strengthening the reporting of observational studies in epidemiology using mendelian randomisation (STROBE-MR): explanation and elaboration > Methods > Assessment of assumptions (item 7)
plain- Asserted: passes — The authors put it forward as true.
- Checkable: passes — It can be checked against evidence.
- Load-bearing: fails — The paper’s conclusions may not depend on it.
- Based: fails — The paper may give no reason why it holds.
Probably not a substantial claim. The paper’s conclusions may not depend on it. The paper may give no reason why it holds. It may state two separate claims as one.
The paper states this without a source or data behind it here, so there is nothing to check it against. The quote shows it is in the paper.
In the paper
“Comparing levels of exposure across the genotype distribution can also indicate monotonicity and linearity of the genetic effect.”
§ Strengthening the reporting of observational studies in epidemiology using mendelian randomisation (STROBE-MR): explanation and elaboration > Results > Main results (item 11)
plaincorrelational- Asserted: passes — The authors put it forward as true.
- Checkable: passes — It can be checked against evidence.
- Load-bearing: fails — The paper’s conclusions may not depend on it.
- Based: passes — The paper gives a reason why it holds.
Probably not a substantial claim. The paper’s conclusions may not depend on it.
The paper states this without a source or data behind it here, so there is nothing to check it against. The quote shows it is in the paper.
In the paper
“Information on the distribution of the exposure, outcomes, and other variables helps judge the comparability of groups and generalisability of the findings.”
§ Strengthening the reporting of observational studies in epidemiology using mendelian randomisation (STROBE-MR): explanation and elaboration > Results > Descriptive data (item 10)
plain- Asserted: passes — The authors put it forward as true.
- Checkable: fails — It may be too vague to check against evidence.
- Load-bearing: fails — The paper’s conclusions may not depend on it.
- Based: passes — The paper gives a reason why it holds.
Probably not a substantial claim. It may be too vague to check against evidence. The paper’s conclusions may not depend on it.
The paper states this without a source or data behind it here, so there is nothing to check it against. The quote shows it is in the paper.
In the paper
“An allele score could be weighted or unweighted.”
§ Strengthening the reporting of observational studies in epidemiology using mendelian randomisation (STROBE-MR): explanation and elaboration > Methods > Statistical methods: main analysis (item 6)
hedged- Asserted: passes — The authors put it forward as true.
- Checkable: passes — It can be checked against evidence.
- Load-bearing: fails — The paper’s conclusions may not depend on it.
- Based: passes — The paper gives a reason why it holds.
Probably not a substantial claim. The paper’s conclusions may not depend on it.
The paper states this without a source or data behind it here, so there is nothing to check it against. The quote shows it is in the paper.
In the paper
“Each study design has different types of biases and could have different degrees of statistical power.”
§ Strengthening the reporting of observational studies in epidemiology using mendelian randomisation (STROBE-MR): explanation and elaboration > Results > Sensitivity analyses and additional analyses (item 13)
hedgedcorrelational- Asserted: passes — The authors put it forward as true.
- Checkable: passes — It can be checked against evidence.
- Load-bearing: fails — The paper’s conclusions may not depend on it.
- Based: fails — The paper may give no reason why it holds.
Probably not a substantial claim. The paper’s conclusions may not depend on it. The paper may give no reason why it holds. It may state two separate claims as one.
None of the sources cited for this claim have been checked yet.
In the paper
“Simulations might also help understand the plausible size and direction of bias induced by assortative mating,62 dynastic effects,9 63 and time varying effects,77 if deemed relevant.”
§ Strengthening the reporting of observational studies in epidemiology using mendelian randomisation (STROBE-MR): explanation and elaboration > Methods > Assumptions (item 5)
What the sources say
hedgedconditional- Asserted: passes — The authors put it forward as true.
- Checkable: fails — It may be too vague to check against evidence.
- Load-bearing: fails — The paper’s conclusions may not depend on it.
- Based: passes — The paper gives a reason why it holds.
Probably not a substantial claim. It may be too vague to check against evidence. The paper’s conclusions may not depend on it.
- The authors state this as an assumption: Relevance: genetic variant G is associated with the exposure of interest X.
- The authors state this as an assumption: Independence: genetic variant G shares no unmeasured cause with outcome Y.
- The authors state this as an assumption: Exclusion restriction: genetic variant G does not affect outcome Y except through its potential effect on the exposure of interest X.
- The authors state this as an assumption: The exposure has the same effects in everyone (homogeneity).
A conclusion the paper draws from its own results — it cites no other source for it, so there is none to check. The quote shows it is in the paper.
In the paper
“If the instrumental variable assumptions are not apparently falsified and are generally supported, or sensitivity analyses are robust to violation of the assumptions (item 8b), then estimates from the MR analysis can be reported in a meaningful manner, preferably on an intuitive scale (eg, relative risk, risk difference).”
§ Strengthening the reporting of observational studies in epidemiology using mendelian randomisation (STROBE-MR): explanation and elaboration > Results > Main results (item 11)
plain- Asserted: passes — The authors put it forward as true.
- Checkable: passes — It can be checked against evidence.
- Load-bearing: passes — The paper’s conclusions depend on it.
- Based: passes — The paper gives a reason why it holds.
Probably not a substantial claim. It may state two separate claims as one.
The paper states this without a source or data behind it here, so there is nothing to check it against. The quote shows it is in the paper.
In the paper
“Exclusion restriction is relaxed in sensitivity analyses such as MR Egger regression.”
§ Strengthening the reporting of observational studies in epidemiology using mendelian randomisation (STROBE-MR): explanation and elaboration > Methods > Assessment of assumptions (item 7)
plaindirect- Asserted: passes — The authors put it forward as true.
- Checkable: passes — It can be checked against evidence.
- Load-bearing: fails — The paper’s conclusions may not depend on it.
- Based: fails — The paper may give no reason why it holds.
Probably not a substantial claim. The paper’s conclusions may not depend on it. The paper may give no reason why it holds.
A conclusion the paper draws from its own results — it cites no other source for it, so there is none to check. The quote shows it is in the paper.
In the paper
“Wider adoption of these methods should increase the accuracy, transparency, and robustness of MR studies.”
§ Strengthening the reporting of observational studies in epidemiology using mendelian randomisation (STROBE-MR): explanation and elaboration > Methods > Software and pre-registration (item 9)
hedgeddirect- Asserted: passes — The authors put it forward as true.
- Checkable: fails — It may be too vague to check against evidence.
- Load-bearing: fails — The paper’s conclusions may not depend on it.
- Based: fails — The paper may give no reason why it holds.
Probably not a substantial claim. It may be too vague to check against evidence. The paper’s conclusions may not depend on it. The paper may give no reason why it holds.
In the paper
“For the exclusion restriction assumption, MR Egger regression55 can be used to detect certain versions of pleiotropy and therefore provide evidence of certain violations of the exclusion restriction.”
§ Strengthening the reporting of observational studies in epidemiology using mendelian randomisation (STROBE-MR): explanation and elaboration > Methods > Assumptions (item 5)
What the sources say
- Not checked yetcites [55] source
plaindirect- Asserted: passes — The authors put it forward as true.
- Checkable: passes — It can be checked against evidence.
- Load-bearing: passes — The paper’s conclusions depend on it.
- Based: passes — The paper gives a reason why it holds.
It may state two separate claims as one.
- The authors state this as an assumption: Exclusion restriction: genetic variant G does not affect outcome Y except through its potential effect on the exposure of interest X.
A conclusion the paper draws from its own results — it cites no other source for it, so there is none to check. The quote shows it is in the paper.
In the paper
“Putting the MR results in context will help readers understand if the strengths and weaknesses of MR allow for results that support or contradict previous evidence.”
§ Strengthening the reporting of observational studies in epidemiology using mendelian randomisation (STROBE-MR): explanation and elaboration > Results > Sensitivity analyses and additional analyses (item 13)
plaindirect- Asserted: passes — The authors put it forward as true.
- Checkable: fails — It may be too vague to check against evidence.
- Load-bearing: fails — The paper’s conclusions may not depend on it.
- Based: passes — The paper gives a reason why it holds.
Probably not a substantial claim. It may be too vague to check against evidence. The paper’s conclusions may not depend on it.
The paper states this without a source or data behind it here, so there is nothing to check it against. The quote shows it is in the paper.
In the paper
“It also provides readers with the information needed to replicate the study and to assess whether the study is likely to show collider bias.”
§ Strengthening the reporting of observational studies in epidemiology using mendelian randomisation (STROBE-MR): explanation and elaboration > Results > Descriptive data (item 10)
plaindirect- Asserted: passes — The authors put it forward as true.
- Checkable: fails — It may be too vague to check against evidence.
- Load-bearing: fails — The paper’s conclusions may not depend on it.
- Based: passes — The paper gives a reason why it holds.
Probably not a substantial claim. It may be too vague to check against evidence. The paper’s conclusions may not depend on it. It may state two separate claims as one.
The paper states this without a source or data behind it here, so there is nothing to check it against. The quote shows it is in the paper.
In the paper
“Any transformations made in the quantitative variables (that is, exposure, outcome, or relevant covariates) should be explicitly mentioned, because they affect both interpretation of results and their comparability with other studies.”
§ Strengthening the reporting of observational studies in epidemiology using mendelian randomisation (STROBE-MR): explanation and elaboration > Methods > Statistical methods: main analysis (item 6)
plaindirect- Asserted: passes — The authors put it forward as true.
- Checkable: passes — It can be checked against evidence.
- Load-bearing: fails — The paper’s conclusions may not depend on it.
- Based: passes — The paper gives a reason why it holds.
Probably not a substantial claim. The paper’s conclusions may not depend on it.
None of the sources cited for this claim have been checked yet.
In the paper
“Plots can be useful for examining potential violations of the instrumental variable assumptions, especially for the exclusion restriction assumption.”
§ Strengthening the reporting of observational studies in epidemiology using mendelian randomisation (STROBE-MR): explanation and elaboration > Results > Main results (item 11)
plaincorrelational- Asserted: passes — The authors put it forward as true.
- Checkable: passes — It can be checked against evidence.
- Load-bearing: fails — The paper’s conclusions may not depend on it.
- Based: passes — The paper gives a reason why it holds.
Probably not a substantial claim. The paper’s conclusions may not depend on it.
The paper states this without a source or data behind it here, so there is nothing to check it against. The quote shows it is in the paper.
In the paper
“Numbers and percentages best describe categorical variables.”
§ Strengthening the reporting of observational studies in epidemiology using mendelian randomisation (STROBE-MR): explanation and elaboration > Results > Descriptive data (item 10)
plain- Asserted: passes — The authors put it forward as true.
- Checkable: fails — It may be too vague to check against evidence.
- Load-bearing: fails — The paper’s conclusions may not depend on it.
- Based: passes — The paper gives a reason why it holds.
Probably not a substantial claim. It may be too vague to check against evidence. The paper’s conclusions may not depend on it.
The paper states this without a source or data behind it here, so there is nothing to check it against. The quote shows it is in the paper.
In the paper
“Two sample MR analyses assume that the SNP-exposure associations are similar in the two samples.”
§ Strengthening the reporting of observational studies in epidemiology using mendelian randomisation (STROBE-MR): explanation and elaboration > Results > Descriptive data (item 10)
plain- Asserted: passes — The authors put it forward as true.
- Checkable: passes — It can be checked against evidence.
- Load-bearing: passes — The paper’s conclusions depend on it.
- Based: fails — The paper may give no reason why it holds.
Probably not a substantial claim. The paper may give no reason why it holds.
The paper states this without a source or data behind it here, so there is nothing to check it against. The quote shows it is in the paper.
In the paper
“The homogeneity assumption requires that the exposure has the same effects in everyone, which is not directly verifiable.”
§ Strengthening the reporting of observational studies in epidemiology using mendelian randomisation (STROBE-MR): explanation and elaboration > Methods > Assumptions (item 5)
plain- Asserted: passes — The authors put it forward as true.
- Checkable: fails — It may be too vague to check against evidence.
- Load-bearing: fails — The paper’s conclusions may not depend on it.
- Based: fails — The paper may give no reason why it holds.
Probably not a substantial claim. It may be too vague to check against evidence. The paper’s conclusions may not depend on it. The paper may give no reason why it holds. It may state two separate claims as one.
- The authors state this as an assumption: The exposure has the same effects in everyone (homogeneity).
A conclusion the paper draws from its own results — it cites no other source for it, so there is none to check. The quote shows it is in the paper.
In the paper
“A measure of absolute risk can provide an estimate of the excess amount of disease that can be attributed to the exposure over a particular period, which can then be used to estimate the absolute benefit of an intervention aimed at reducing levels of the exposure.”
§ Strengthening the reporting of observational studies in epidemiology using mendelian randomisation (STROBE-MR): explanation and elaboration > Results > Main results (item 11)
plaindirect- Asserted: passes — The authors put it forward as true.
- Checkable: passes — It can be checked against evidence.
- Load-bearing: fails — The paper’s conclusions may not depend on it.
- Based: fails — The paper may give no reason why it holds.
Probably not a substantial claim. The paper’s conclusions may not depend on it. The paper may give no reason why it holds. It may state two separate claims as one.
The paper states this without a source or data behind it here, so there is nothing to check it against. The quote shows it is in the paper.
In the paper
“If the estimation is based on a meta-analysis, the number of included studies will also help determine if tests for heterogeneity are properly powered to detect its presence.”
§ Strengthening the reporting of observational studies in epidemiology using mendelian randomisation (STROBE-MR): explanation and elaboration > Results > Descriptive data (item 10)
hedgedcorrelational- Asserted: passes — The authors put it forward as true.
- Checkable: passes — It can be checked against evidence.
- Load-bearing: fails — The paper’s conclusions may not depend on it.
- Based: passes — The paper gives a reason why it holds.
Probably not a substantial claim. The paper’s conclusions may not depend on it.
The paper states this without a source or data behind it here, so there is nothing to check it against. The quote shows it is in the paper.
In the paper
“Associations with measured covariates (eg, age, sex, and race or ethnic origin) and effect estimates across subpopulations can be reported with one sample MR studies, but generally not with two sample MR studies”
§ Strengthening the reporting of observational studies in epidemiology using mendelian randomisation (STROBE-MR): explanation and elaboration > Methods > Assessment of assumptions (item 7)
plain- Asserted: passes — The authors put it forward as true.
- Checkable: passes — It can be checked against evidence.
- Load-bearing: unclear — It is unclear whether the paper’s conclusions depend on it.
- Based: passes — The paper gives a reason why it holds.
It may state two separate claims as one.
A conclusion the paper draws from its own results — it cites no other source for it, so there is none to check. The quote shows it is in the paper.
In the paper
“The inclusion of multiple variants with missing data in the estimation of causal effects could decrease precision.”
§ Strengthening the reporting of observational studies in epidemiology using mendelian randomisation (STROBE-MR): explanation and elaboration > Methods > Statistical methods: main analysis (item 6)
hedgedconditional- Asserted: passes — The authors put it forward as true.
- Checkable: passes — It can be checked against evidence.
- Load-bearing: fails — The paper’s conclusions may not depend on it.
- Based: fails — The paper may give no reason why it holds.
Probably not a substantial claim. The paper’s conclusions may not depend on it. The paper may give no reason why it holds.
In the paper
“When selection bias is a concern, researchers also frequently conduct simulations to understand the plausible size and direction of bias.64”
§ Strengthening the reporting of observational studies in epidemiology using mendelian randomisation (STROBE-MR): explanation and elaboration > Methods > Assumptions (item 5)
What the sources say
- Not checked yetcites [64] source
plain- Asserted: passes — The authors put it forward as true.
- Checkable: passes — It can be checked against evidence.
- Load-bearing: fails — The paper’s conclusions may not depend on it.
- Based: passes — The paper gives a reason why it holds.
Probably not a substantial claim. The paper’s conclusions may not depend on it.
- The authors state this as an assumption: Relevance: genetic variant G is associated with the exposure of interest X.
- The authors state this as an assumption: Independence: genetic variant G shares no unmeasured cause with outcome Y.
- The authors state this as an assumption: Exclusion restriction: genetic variant G does not affect outcome Y except through its potential effect on the exposure of interest X.
- The authors state this as an assumption: The exposure has the same effects in everyone (homogeneity).
In the paper
“Because several of the estimators using multiple genetic variants rely on different versions of relaxing or adapting the instrumental variable assumptions (eg, MR Egger, median based, or modal based estimators), a comparison of estimates obtained using each of these approaches can help understand the sensitivity of effect estimates to the non-overlapping assumptions of each.74”
§ Strengthening the reporting of observational studies in epidemiology using mendelian randomisation (STROBE-MR): explanation and elaboration > Methods > Assumptions (item 5)
What the sources say
- Not checked yetcites [74]
plainconditional- Asserted: passes — The authors put it forward as true.
- Checkable: passes — It can be checked against evidence.
- Load-bearing: passes — The paper’s conclusions depend on it.
- Based: passes — The paper gives a reason why it holds.
Probably not a substantial claim.
- The authors state this as an assumption: Relevance: genetic variant G is associated with the exposure of interest X.
- The authors state this as an assumption: Independence: genetic variant G shares no unmeasured cause with outcome Y.
- The authors state this as an assumption: Exclusion restriction: genetic variant G does not affect outcome Y except through its potential effect on the exposure of interest X.
- The authors state this as an assumption: The exposure has the same effects in everyone (homogeneity).
A conclusion the paper draws from its own results — it cites no other source for it, so there is none to check. The quote shows it is in the paper.
In the paper
“For a two sample analysis, authors should state the covariates used to estimate the genetic variant-exposure and genetic variant-outcome associations to assess any differences in the use of covariates between the two associations, which could lead to bias.”
§ Strengthening the reporting of observational studies in epidemiology using mendelian randomisation (STROBE-MR): explanation and elaboration > Methods > Statistical methods: main analysis (item 6)
hedgeddirect- Asserted: passes — The authors put it forward as true.
- Checkable: passes — It can be checked against evidence.
- Load-bearing: passes — The paper’s conclusions depend on it.
- Based: passes — The paper gives a reason why it holds.
Probably not a substantial claim.
A conclusion the paper draws from its own results — it cites no other source for it, so there is none to check. The quote shows it is in the paper.
In the paper
“Sensitivity analyses can test the robustness of effect estimates to plausible violations of the underlying assumptions and help understand the plausible size or direction of bias.”
§ Strengthening the reporting of observational studies in epidemiology using mendelian randomisation (STROBE-MR): explanation and elaboration > Methods > Sensitivity analyses and additional analyses (item 8)
plainconditional- Asserted: passes — The authors put it forward as true.
- Checkable: passes — It can be checked against evidence.
- Load-bearing: passes — The paper’s conclusions depend on it.
- Based: passes — The paper gives a reason why it holds.
Probably not a substantial claim. It may state two separate claims as one.
A conclusion the paper draws from its own results — it cites no other source for it, so there is none to check. The quote shows it is in the paper.
In the paper
“In some instances, the interpretation of estimates in terms of absolute risks or risk differences rather than relative risk differences might be more clinically meaningful, by taking into account the baseline risk.”
§ Strengthening the reporting of observational studies in epidemiology using mendelian randomisation (STROBE-MR): explanation and elaboration > Results > Main results (item 11)
hedged- Asserted: passes — The authors put it forward as true.
- Checkable: fails — It may be too vague to check against evidence.
- Load-bearing: fails — The paper’s conclusions may not depend on it.
- Based: passes — The paper gives a reason why it holds.
Probably not a substantial claim. It may be too vague to check against evidence. The paper’s conclusions may not depend on it.
In the paper
“One possibility for supporting its validity is to determine whether the effect estimate, or even the genetic variants’ effects on the exposure, is the same across subpopulations.67 71”
§ Strengthening the reporting of observational studies in epidemiology using mendelian randomisation (STROBE-MR): explanation and elaboration > Methods > Assumptions (item 5)
What the sources say
- Not checked yetcites 67 71
hedged- Asserted: passes — The authors put it forward as true.
- Checkable: passes — It can be checked against evidence.
- Load-bearing: fails — The paper’s conclusions may not depend on it.
- Based: passes — The paper gives a reason why it holds.
Probably not a substantial claim. The paper’s conclusions may not depend on it.
- The authors state this as an assumption: The exposure has the same effects in everyone (homogeneity).
The paper states this without a source or data behind it here, so there is nothing to check it against. The quote shows it is in the paper.
In the paper
“However, the approach depends on an additional assumption (described above) and requires multiple independent variants.”
§ Strengthening the reporting of observational studies in epidemiology using mendelian randomisation (STROBE-MR): explanation and elaboration > Methods > Assumptions (item 5)
plain- Asserted: passes — The authors put it forward as true.
- Checkable: passes — It can be checked against evidence.
- Load-bearing: unclear — It is unclear whether the paper’s conclusions depend on it.
- Based: passes — The paper gives a reason why it holds.
It may state two separate claims as one.
- The authors state this as an assumption: Exclusion restriction: genetic variant G does not affect outcome Y except through its potential effect on the exposure of interest X.
The paper states this without a source or data behind it here, so there is nothing to check it against. The quote shows it is in the paper.
In the paper
“A summary measure of follow-up time—such as mean, median, or total follow-up—is also important to understand the period over which events were recorded.”
§ Strengthening the reporting of observational studies in epidemiology using mendelian randomisation (STROBE-MR): explanation and elaboration > Results > Descriptive data (item 10)
plain- Asserted: passes — The authors put it forward as true.
- Checkable: fails — It may be too vague to check against evidence.
- Load-bearing: fails — The paper’s conclusions may not depend on it.
- Based: passes — The paper gives a reason why it holds.
Probably not a substantial claim. It may be too vague to check against evidence. The paper’s conclusions may not depend on it.
In the paper
“The bias is a linear function of the number of individuals included in both samples, so the consequences of a small amount of overlap may not be severe.94”
§ Strengthening the reporting of observational studies in epidemiology using mendelian randomisation (STROBE-MR): explanation and elaboration > Results > Descriptive data (item 10)
What the sources say
- Not checked yetcites [94] source
hedgedcorrelational- Asserted: passes — The authors put it forward as true.
- Checkable: passes — It can be checked against evidence.
- Load-bearing: unclear — It is unclear whether the paper’s conclusions depend on it.
- Based: passes — The paper gives a reason why it holds.
It may state two separate claims as one.
None of the sources cited for this claim have been checked yet.
In the paper
“Additional plots might also aid in the visualisation of results, assessing assumption violation, and detecting potential influential or outlier points.”
§ Strengthening the reporting of observational studies in epidemiology using mendelian randomisation (STROBE-MR): explanation and elaboration > Results > Sensitivity analyses and additional analyses (item 13)
What the sources say
hedgedconditional- Asserted: passes — The authors put it forward as true.
- Checkable: fails — It may be too vague to check against evidence.
- Load-bearing: fails — The paper’s conclusions may not depend on it.
- Based: passes — The paper gives a reason why it holds.
Probably not a substantial claim. It may be too vague to check against evidence. The paper’s conclusions may not depend on it. It may state two separate claims as one.
None of the sources cited for this claim have been checked yet.
In the paper
“In general, causal inference can be presented in a triangulation framework, evaluating the overall body of evidence from several different approaches.103 104”
§ Strengthening the reporting of observational studies in epidemiology using mendelian randomisation (STROBE-MR): explanation and elaboration > Results > Sensitivity analyses and additional analyses (item 13)
plain- Asserted: passes — The authors put it forward as true.
- Checkable: fails — It may be too vague to check against evidence.
- Load-bearing: fails — The paper’s conclusions may not depend on it.
- Based: passes — The paper gives a reason why it holds.
Probably not a substantial claim. It may be too vague to check against evidence. The paper’s conclusions may not depend on it.
The paper states this without a source or data behind it here, so there is nothing to check it against. The quote shows it is in the paper.
In the paper
“Usually MR studies are interpreted as a so-called lifetime effect of the exposure, but some settings (eg, MR studies in pregnant women to study prenatal exposures) lend themselves to studies of period effects.”
§ Strengthening the reporting of observational studies in epidemiology using mendelian randomisation (STROBE-MR): explanation and elaboration > Discussion > Interpretation (item 16)
plain- Asserted: passes — The authors put it forward as true.
- Checkable: passes — It can be checked against evidence.
- Load-bearing: fails — The paper’s conclusions may not depend on it.
- Based: passes — The paper gives a reason why it holds.
Probably not a substantial claim. The paper’s conclusions may not depend on it. It may state two separate claims as one.
The paper states this without a source or data behind it here, so there is nothing to check it against. The quote shows it is in the paper.
In the paper
“Because many interventions cannot be tested in randomised clinical trials, MR evidence might help to better understand the possible causal effect of the exposure on the outcome (box 4).”
§ Strengthening the reporting of observational studies in epidemiology using mendelian randomisation (STROBE-MR): explanation and elaboration > Discussion > Interpretation (item 16)
hedgedconditional- Asserted: passes — The authors put it forward as true.
- Checkable: fails — It may be too vague to check against evidence.
- Load-bearing: passes — The paper’s conclusions depend on it.
- Based: passes — The paper gives a reason why it holds.
Probably not a substantial claim. It may be too vague to check against evidence.
In the paper
“Conversely, the long term effect of lowered low density lipoprotein (LDL) cholesterol can be estimated from early life onwards by MR and is double the effect estimate derived from randomised trials.”
§ Strengthening the reporting of observational studies in epidemiology using mendelian randomisation (STROBE-MR): explanation and elaboration > Discussion > Interpretation (item 16)
What the sources say
- Not checked yetcites [112] source
plaindirect- Asserted: passes — The authors put it forward as true.
- Checkable: passes — It can be checked against evidence.
- Load-bearing: unclear — It is unclear whether the paper’s conclusions depend on it.
- Based: passes — The paper gives a reason why it holds.
It may state two separate claims as one.
None of the sources cited for this claim have been checked yet.
In the paper
“Structured discussions can help authors avoid over-interpreting results, and act as a guide for readers.107 108”
§ Strengthening the reporting of observational studies in epidemiology using mendelian randomisation (STROBE-MR): explanation and elaboration > Discussion
plaindirect- Asserted: passes — The authors put it forward as true.
- Checkable: fails — It may be too vague to check against evidence.
- Load-bearing: fails — The paper’s conclusions may not depend on it.
- Based: passes — The paper gives a reason why it holds.
Probably not a substantial claim. It may be too vague to check against evidence. The paper’s conclusions may not depend on it. It may state two separate claims as one.
In the paper
“For example, findings from a cohort of a specific age group collected in the past might not apply to people currently in the same age group.118”
§ Strengthening the reporting of observational studies in epidemiology using mendelian randomisation (STROBE-MR): explanation and elaboration > Discussion > Generalisability (item 17)
What the sources say
- Not checked yetcites [118] source
hedged- Asserted: passes — The authors put it forward as true.
- Checkable: passes — It can be checked against evidence.
- Load-bearing: fails — The paper’s conclusions may not depend on it.
- Based: passes — The paper gives a reason why it holds.
Probably not a substantial claim. The paper’s conclusions may not depend on it.
A conclusion the paper draws from its own results — it cites no other source for it, so there is none to check. The quote shows it is in the paper.
In the paper
“Time dependency of the effects of instruments is an important issue that should be considered when interpreting MR findings, and is well served by viewing this in the context of gene-environment equivalence.”
§ Strengthening the reporting of observational studies in epidemiology using mendelian randomisation (STROBE-MR): explanation and elaboration > Discussion > Interpretation (item 16)
boosted- Asserted: passes — The authors put it forward as true.
- Checkable: fails — It may be too vague to check against evidence.
- Load-bearing: fails — The paper’s conclusions may not depend on it.
- Based: passes — The paper gives a reason why it holds.
Probably not a substantial claim. It may be too vague to check against evidence. The paper’s conclusions may not depend on it. It may state two separate claims as one.
None of the sources cited for this claim have been checked yet.
In the paper
“Authors should disclose funding sources for biobanks or other repositories or databases used in their study because these entities also have commercial interests that might influence research integrity.124 125”
§ Strengthening the reporting of observational studies in epidemiology using mendelian randomisation (STROBE-MR): explanation and elaboration > Other information > Funding (item 18)
hedgedconditional- Asserted: passes — The authors put it forward as true.
- Checkable: passes — It can be checked against evidence.
- Load-bearing: fails — The paper’s conclusions may not depend on it.
- Based: passes — The paper gives a reason why it holds.
Probably not a substantial claim. The paper’s conclusions may not depend on it.
In the paper
“This bias is of special concern when research is funded by an entity that has an interest in outcomes that are favourable to its own commercial, academic, or other interests.123”
§ Strengthening the reporting of observational studies in epidemiology using mendelian randomisation (STROBE-MR): explanation and elaboration > Other information > Funding (item 18)
What the sources say
- Not checked yetcites [123] source
plaincorrelational- Asserted: passes — The authors put it forward as true.
- Checkable: passes — It can be checked against evidence.
- Load-bearing: fails — The paper’s conclusions may not depend on it.
- Based: passes — The paper gives a reason why it holds.
Probably not a substantial claim. The paper’s conclusions may not depend on it.
A conclusion the paper draws from its own results — it cites no other source for it, so there is none to check. The quote shows it is in the paper.
In the paper
“Describing the source of funding allows readers to evaluate the work’s credibility and trustworthiness in the light of any potential influence from funders.”
§ Strengthening the reporting of observational studies in epidemiology using mendelian randomisation (STROBE-MR): explanation and elaboration > Other information > Funding (item 18)
plaindirect- Asserted: passes — The authors put it forward as true.
- Checkable: fails — It may be too vague to check against evidence.
- Load-bearing: passes — The paper’s conclusions depend on it.
- Based: passes — The paper gives a reason why it holds.
Probably not a substantial claim. It may be too vague to check against evidence.
A conclusion the paper draws from its own results — it cites no other source for it, so there is none to check. The quote shows it is in the paper.
In the paper
“This difference probably reflects MR providing an estimate of lifelong effects, whereas trials provide an effect estimate for period of randomisation, which lasts just a few years in cholesterol lowering randomised clinical trials.”
§ Strengthening the reporting of observational studies in epidemiology using mendelian randomisation (STROBE-MR): explanation and elaboration > Discussion > Interpretation (item 16)
hedgedconditional- Asserted: passes — The authors put it forward as true.
- Checkable: passes — It can be checked against evidence.
- Load-bearing: passes — The paper’s conclusions depend on it.
- Based: passes — The paper gives a reason why it holds.
It may state two separate claims as one.
The paper states this without a source or data behind it here, so there is nothing to check it against. The quote shows it is in the paper.
In the paper
“While the biological mechanisms that allow genetic variants to be used as instrumental variables are often unknown, the discussion should consider possibilities.”
§ Strengthening the reporting of observational studies in epidemiology using mendelian randomisation (STROBE-MR): explanation and elaboration > Discussion > Interpretation (item 16)
plain- Asserted: passes — The authors put it forward as true.
- Checkable: passes — It can be checked against evidence.
- Load-bearing: fails — The paper’s conclusions may not depend on it.
- Based: fails — The paper may give no reason why it holds.
Probably not a substantial claim. The paper’s conclusions may not depend on it. The paper may give no reason why it holds.
The paper states this without a source or data behind it here, so there is nothing to check it against. The quote shows it is in the paper.
In the paper
“Authors should address the plausibility of all the instrumental variable assumptions, which is especially important because many of the assumptions are not empirically verifiable.”
§ Strengthening the reporting of observational studies in epidemiology using mendelian randomisation (STROBE-MR): explanation and elaboration > Discussion > Limitations (item 15)
plain- Asserted: passes — The authors put it forward as true.
- Checkable: passes — It can be checked against evidence.
- Load-bearing: passes — The paper’s conclusions depend on it.
- Based: fails — The paper may give no reason why it holds.
Probably not a substantial claim. The paper may give no reason why it holds.
The paper states this without a source or data behind it here, so there is nothing to check it against. The quote shows it is in the paper.
In the paper
“For example, an instrumental variable estimate’s precision from a meta-analysis of multiple SNPs will usually be greater than that for a single SNP.”
§ Strengthening the reporting of observational studies in epidemiology using mendelian randomisation (STROBE-MR): explanation and elaboration > Discussion > Limitations (item 15)
hedgedcorrelational- Asserted: passes — The authors put it forward as true.
- Checkable: passes — It can be checked against evidence.
- Load-bearing: fails — The paper’s conclusions may not depend on it.
- Based: fails — The paper may give no reason why it holds.
Probably not a substantial claim. The paper’s conclusions may not depend on it. The paper may give no reason why it holds.
In the paper
“Caution is especially warranted when interpreting effect estimates with a binary exposure.114”
§ Strengthening the reporting of observational studies in epidemiology using mendelian randomisation (STROBE-MR): explanation and elaboration > Discussion > Interpretation (item 16)
What the sources say
- Not checked yetcites [114] source
plain- Asserted: passes — The authors put it forward as true.
- Checkable: fails — It may be too vague to check against evidence.
- Load-bearing: fails — The paper’s conclusions may not depend on it.
- Based: passes — The paper gives a reason why it holds.
Probably not a substantial claim. It may be too vague to check against evidence. The paper’s conclusions may not depend on it.
The paper states this without a source or data behind it here, so there is nothing to check it against. The quote shows it is in the paper.
In the paper
“For example, because genetic variants might not have a constant effect over the entire life course, authors should consider whether the effect estimate derived in the study would generalise to other exposure periods.”
§ Strengthening the reporting of observational studies in epidemiology using mendelian randomisation (STROBE-MR): explanation and elaboration > Discussion > Generalisability (item 17)
hedged- Asserted: passes — The authors put it forward as true.
- Checkable: passes — It can be checked against evidence.
- Load-bearing: passes — The paper’s conclusions depend on it.
- Based: fails — The paper may give no reason why it holds.
Probably not a substantial claim. The paper may give no reason why it holds.
The paper states this without a source or data behind it here, so there is nothing to check it against. The quote shows it is in the paper.
In the paper
“Other sources of influence can include employers, political appointees, and government researchers.”
§ Strengthening the reporting of observational studies in epidemiology using mendelian randomisation (STROBE-MR): explanation and elaboration > Other information > Funding (item 18)
plain- Asserted: passes — The authors put it forward as true.
- Checkable: passes — It can be checked against evidence.
- Load-bearing: fails — The paper’s conclusions may not depend on it.
- Based: fails — The paper may give no reason why it holds.
Probably not a substantial claim. The paper’s conclusions may not depend on it. The paper may give no reason why it holds.
The paper states this without a source or data behind it here, so there is nothing to check it against. The quote shows it is in the paper.
In the paper
“Authors could consider, for example, the possibility that (residual) genotype-phenotype confounders (such as population structure, genetic nurture, or assortative mating) could lead to a violation of the independence assumption.”
§ Strengthening the reporting of observational studies in epidemiology using mendelian randomisation (STROBE-MR): explanation and elaboration > Discussion > Limitations (item 15)
hedgedconditional- Asserted: passes — The authors put it forward as true.
- Checkable: passes — It can be checked against evidence.
- Load-bearing: fails — The paper’s conclusions may not depend on it.
- Based: fails — The paper may give no reason why it holds.
Probably not a substantial claim. The paper’s conclusions may not depend on it. The paper may give no reason why it holds.
None of the sources cited for this claim have been checked yet.
In the paper
“The source of research funding can lead to bias or perceptions of bias in the design, conduct, or interpretation of research.121 122”
§ Strengthening the reporting of observational studies in epidemiology using mendelian randomisation (STROBE-MR): explanation and elaboration > Other information > Funding (item 18)
plaindirect- Asserted: passes — The authors put it forward as true.
- Checkable: passes — It can be checked against evidence.
- Load-bearing: fails — The paper’s conclusions may not depend on it.
- Based: passes — The paper gives a reason why it holds.
Probably not a substantial claim. The paper’s conclusions may not depend on it.
A conclusion the paper draws from its own results — it cites no other source for it, so there is none to check. The quote shows it is in the paper.
In the paper
“Also, MR estimates are directly calculated only for the exposure range caused by differences in alleles. Applying MR results, therefore, might not generalise to a wider exposure range.”
§ Strengthening the reporting of observational studies in epidemiology using mendelian randomisation (STROBE-MR): explanation and elaboration > Discussion > Generalisability (item 17)
hedgedconditional- Asserted: passes — The authors put it forward as true.
- Checkable: passes — It can be checked against evidence.
- Load-bearing: passes — The paper’s conclusions depend on it.
- Based: passes — The paper gives a reason why it holds.
It may state two separate claims as one.
The paper states this without a source or data behind it here, so there is nothing to check it against. The quote shows it is in the paper.
In the paper
“Since clinical and policy interventions might have different effect sizes compared with the genetic variants included in the MR study, extrapolation of this evidence should be clearly described and cautious.”
§ Strengthening the reporting of observational studies in epidemiology using mendelian randomisation (STROBE-MR): explanation and elaboration > Discussion > Interpretation (item 16)
hedged- Asserted: passes — The authors put it forward as true.
- Checkable: passes — It can be checked against evidence.
- Load-bearing: passes — The paper’s conclusions depend on it.
- Based: fails — The paper may give no reason why it holds.
Probably not a substantial claim. The paper may give no reason why it holds.
In the paper
“When such interests are not disclosed, public trust in the research enterprise is eroded.128”
§ Strengthening the reporting of observational studies in epidemiology using mendelian randomisation (STROBE-MR): explanation and elaboration > Other information > Conflicts of interest (item 20)
What the sources say
- Not checked yetcites [128] source
plaindirect- Asserted: passes — The authors put it forward as true.
- Checkable: passes — It can be checked against evidence.
- Load-bearing: fails — The paper’s conclusions may not depend on it.
- Based: passes — The paper gives a reason why it holds.
Probably not a substantial claim. The paper’s conclusions may not depend on it.
In the paper
“Finally, an important component of interpretation is defining the time period.60”
§ Strengthening the reporting of observational studies in epidemiology using mendelian randomisation (STROBE-MR): explanation and elaboration > Discussion > Interpretation (item 16)
What the sources say
- Not checked yetcites [60] source
plain- Asserted: passes — The authors put it forward as true.
- Checkable: passes — It can be checked against evidence.
- Load-bearing: fails — The paper’s conclusions may not depend on it.
- Based: passes — The paper gives a reason why it holds.
Probably not a substantial claim. The paper’s conclusions may not depend on it.
The paper states this without a source or data behind it here, so there is nothing to check it against. The quote shows it is in the paper.
In the paper
“Various components of growth and development could be influenced by the variants, whilst their identification through genetic association studies is often from association with phenotype measured at one time point.”
§ Strengthening the reporting of observational studies in epidemiology using mendelian randomisation (STROBE-MR): explanation and elaboration > Discussion > Interpretation (item 16)
hedgedconditional- Asserted: passes — The authors put it forward as true.
- Checkable: passes — It can be checked against evidence.
- Load-bearing: unclear — It is unclear whether the paper’s conclusions depend on it.
- Based: passes — The paper gives a reason why it holds.
It may state two separate claims as one.
In the paper
“Consensus is building that data sharing is “an inseparable part of the research process.”127”
§ Strengthening the reporting of observational studies in epidemiology using mendelian randomisation (STROBE-MR): explanation and elaboration > Other information > Data and data sharing (item 19)
What the sources say
- Not checked yetcites [127] source
plain- Asserted: passes — The authors put it forward as true.
- Checkable: passes — It can be checked against evidence.
- Load-bearing: fails — The paper’s conclusions may not depend on it.
- Based: passes — The paper gives a reason why it holds.
Probably not a substantial claim. The paper’s conclusions may not depend on it.
In the paper
“Financial connections between researchers and commercial or other entities and firmly held ideological or intellectual views can lead to bias in the design, conduct, or reporting of study results.”
§ Strengthening the reporting of observational studies in epidemiology using mendelian randomisation (STROBE-MR): explanation and elaboration > Other information > Conflicts of interest (item 20)
What the sources say
- Not checked yetcites [128] source
plaindirect- Asserted: passes — The authors put it forward as true.
- Checkable: passes — It can be checked against evidence.
- Load-bearing: fails — The paper’s conclusions may not depend on it.
- Based: passes — The paper gives a reason why it holds.
Probably not a substantial claim. The paper’s conclusions may not depend on it.
The paper states this without a source or data behind it here, so there is nothing to check it against. The quote shows it is in the paper.
In the paper
“Effects of genetic variants can influence outcomes from conception onwards and in a manner that can be variable and complex.”
§ Strengthening the reporting of observational studies in epidemiology using mendelian randomisation (STROBE-MR): explanation and elaboration > Discussion > Interpretation (item 16)
plaindirect- Asserted: passes — The authors put it forward as true.
- Checkable: passes — It can be checked against evidence.
- Load-bearing: passes — The paper’s conclusions depend on it.
- Based: passes — The paper gives a reason why it holds.
It may state two separate claims as one.
The paper relies on this without support.
Reporting guidelines help authors effectively communicate all critical information about what was done and what was found.
“Reporting guidelines help authors effectively communicate all critical information about what was done and what was found.”
The paper relies on this without support.
Genetic variation is essentially randomly inherited from parents to offspring at conception.
“Genetic variation is essentially randomly inherited from parents to offspring at conception”
The paper relies on this without support.
Mendelian randomisation studies have increased in popularity and have begun to inform understanding of disease causation.
“Given these advantages, MR studies have increased in popularity and have begun to inform understanding of disease causation.”
The authors state this as an assumption.
Relevance: genetic variant G is associated with the exposure of interest X.
“I. Relevance: genetic variant G is associated with the exposure of interest X”
The authors state this as an assumption.
Independence: genetic variant G shares no unmeasured cause with outcome Y.
“II. Independence: genetic variant G shares no unmeasured cause with outcome Y”
The authors state this as an assumption.
Exclusion restriction: genetic variant G does not affect outcome Y except through its potential effect on the exposure of interest X.
“III. Exclusion restriction: genetic variant G does not affect outcome Y except through its potential effect on the exposure of interest X.”
The authors state this as an assumption.
The exposure has the same effects in everyone (homogeneity).
“The homogeneity assumption requires that the exposure has the same effects in everyone, which is not directly verifiable.”
The authors state this as an assumption.
An increase in the number of risk alleles does not lower the likelihood of exposure for any individuals (monotonicity).
“The homogeneity assumption can also be replaced by imposing a monotonicity assumption that an increase in the number of risk alleles does not lower the likelihood of exposure for any individuals, typically leading to estimating an effect in a subgroup of the study population.61”
The authors state this as an assumption.
The size of the direct effects of the genetic variants on the outcome that do not operate through the exposure are independent of the size of the genetic variants’ effects on the exposure (InSIDE).
“MR Egger regression relaxes the exclusion restriction assumption but imposes an InSIDE assumption that the size of the direct effects of the genetic variants on the outcome that do not operate through the exposure are independent of the size of the genetic variants’ effects on the exposure.”
The authors state this as an assumption.
The association between the genetic variants and the exposure is the same in the two samples (two sample MR).
“Additionally, the two sample MR approach assumes that the association between the genetic variants and the exposure is the same in the two samples, which might not hold if samples are selected from different subpopulations (eg, by sex, age, ethnicity).”
The paper relies on this without support.
Original data are needed by readers or researchers who wish to evaluate or replicate analyses.
“Original data are needed by readers or researchers who wish to evaluate or replicate analyses.”
The paper relies on this without support.
Many funders and journals encourage or require data sharing, and provide guidance to authors about the content of any explicit data sharing statement required by their journal.
“Many funders and journals encourage or require data sharing, and provide guidance to authors about the content of any explicit data sharing statement required by their journal.”
Claims other papers make about this one
Each is checked against this paper’s own text: does it say what the citing paper says it does?
In the citing paper
“The comprehensive E&E document, 15 which is intended for use alongside the checklist, also benefited greatly from this consultation process.”
From Strengthening the Reporting of Observational Studies in Epidemiology Using Mendelian Randomization: The STROBE-MR Statement (2021) · cites this paper as [15]
Self-check
Percentages, sums and reported differences re-computed from the paper’s own numbers.
Each contradiction between two passages listed here was confirmed by an independent check.
Rated minor: it would not touch a result — a value no result rests on, a p-value that stays on the same side of the significance level, or a conflict that is clerical, resolved elsewhere in the paper, or outside its own findings.
In the paper
§ Strengthening the reporting of observational studies in epidemiology using mendelian randomisation (STROBE-MR): explanation and elaboration > Results > Descriptive data (item 10)
“| 2p16.2 | SPTBN1 | rs4233949 | −23.21 | G | 0.61 | 1.03 (1.02 to 1.05) | 6.9×10⁻⁵ | | 1.04 (1.05 to 1.05)”
§ Strengthening the reporting of observational studies in epidemiology using mendelian randomisation (STROBE-MR): explanation and elaboration > Results > Descriptive data (item 10)
“1.05 to 1.05”
Rated minor: it would not touch a result — a value no result rests on, a p-value that stays on the same side of the significance level, or a conflict that is clerical, resolved elsewhere in the paper, or outside its own findings.
In the paper
§ Strengthening the reporting of observational studies in epidemiology using mendelian randomisation (STROBE-MR): explanation and elaboration > Results > Main results (item 11)
“The BMI allele score was also associated with 25(OH)D concentrations (per unit increase −0.06% [-0.20% to −0.02%], p=0.004).”
§ Strengthening the reporting of observational studies in epidemiology using mendelian randomisation (STROBE-MR): explanation and elaboration > Results > Sensitivity analyses and additional analyses (item 13)
“The BMI allele score was also associated with 25(OH)D concentrations (per unit increase −0.06%, [−0.10% to −0.02%], p=0.004)”
Rated minor: it would not touch a result — a value no result rests on, a p-value that stays on the same side of the significance level, or a conflict that is clerical, resolved elsewhere in the paper, or outside its own findings.
In the paper
§ Strengthening the reporting of observational studies in epidemiology using mendelian randomisation (STROBE-MR): explanation and elaboration > Results > Descriptive data (item 10)
“| 9q34.11 | FUBP3 | rs7851693 | 0 | G | 0.35 | 1.03 (1.01 to 1.06) | 1.3×10⁻⁴ | | 1.05 (1.06 to 1.06)”
§ Strengthening the reporting of observational studies in epidemiology using mendelian randomisation (STROBE-MR): explanation and elaboration > Results > Descriptive data (item 10)
“1.06 to 1.06”
Rated minor: it would not touch a result — a value no result rests on, a p-value that stays on the same side of the significance level, or a conflict that is clerical, resolved elsewhere in the paper, or outside its own findings.
In the paper
§ Strengthening the reporting of observational studies in epidemiology using mendelian randomisation (STROBE-MR): explanation and elaboration > Results > Descriptive data (item 10)
“| 14q32.12 | RPS6KA5 | rs1286083 | 0 | T | 0.82 | 1.04 (1.02 to 1.06) | 8.8×10⁻⁵ | | 1.05 (1.04 to 1.07) | 3.0×10⁻¹⁴ | | 1.05 (1.04 to 1.06) | 1.6×10⁻¹⁷ | 185 085 | 43.3 |”
§ Strengthening the reporting of observational studies in epidemiology using mendelian randomisation (STROBE-MR): explanation and elaboration > Results > Descriptive data (item 10)
“combined (185 057 cases; 377 201 controls).”
Citations
Cites
Quantifying heterogeneity in a meta‐analysis
Higgins, J. P. T., & Thompson, S. G. (2002) · Statistics in Medicine · doi:10.1002/sim.1186 · Cited by 36,763
Self-citationCook, R. J., Dickens, B. M., & Fathalla, M. F. (2003) · Oxford University Press eBooks · doi:10.1093/acprof:oso/9780199241323.003.0025 · Cited by 10,822
Elm, E. V., Altman, D. G., Egger, M., Pocock, S. J., Gøtzsche, P. C., & Vandenbroucke, J. P. (2007) · BMJ · doi:10.1136/bmj.39335.541782.ad · Cited by 10,766
Self-citationBowden, J., Davey Smith, G., & Burgess, S. (2015) · International Journal of Epidemiology · doi:10.1093/ije/dyv080 · Cited by 9,816
Bowden, J., Davey Smith, G., Haycock, P. C., & Burgess, S. (2016) · Genetic Epidemiology · doi:10.1002/gepi.21965 · Cited by 8,922
Vandenbroucke, J. P., von Elm, E., Altman, D. G., Gøtzsche, P. C., Mulrow, C. D., Pocock, S. J., Poole, C., Schlesselman, J. J., Egger, M., & Initiative, F. T. S. (2007) · PLoS Medicine · doi:10.1371/journal.pmed.0040297 · Cited by 8,613
Self-citationThe MR-Base platform supports systematic causal inference across the human phenome
Hemani, G., Zheng, J., Elsworth, B., Wade, K. H., Haberland, V., Baird, D., Laurin, C., Burgess, S., Bowden, J., Langdon, R., et al. (2018) · eLife · doi:10.7554/elife.34408 · Cited by 7,959
Self-citationSensitivity analysis in observational research: Introducing the E-value
VanderWeele, T. J., & Ding, P. (2017) · Annals of Internal Medicine · doi:10.7326/m16-2607 · Cited by 6,350
Self-citationDavey Smith, G., & Ebrahim, S. (2003) · International Journal of Epidemiology · doi:10.1093/ije/dyg070 · Cited by 5,882
Research works printed but not linked: 1
- Conference MR. 2019. MRC Integrative Epidemiology Unit. University of Bristol. 2020. https://www.bristol.ac.uk/integrative-epidemiology/seminars/2019/mr-conference-2019.html
Cited by
Sorted by citations
Items 301–400 of 1,000
Yao, Y., Hu, H., Chen, L., & Zheng, H. (2024) · Frontiers in Microbiology · doi:10.3389/fmicb.2024.1321268 · Cited by 13
Shi, X., Li, M., Yao, J., Li, M. D., & Yang, Z. (2024) · Addiction · doi:10.1111/add.16465 · Cited by 11
Roles of gut microbiota in androgenetic alopecia: insights from Mendelian randomization analysis
Fu, H., Xu, T., Zhao, W., Jiang, L., & Shan, S. (2024) · Frontiers in Microbiology · doi:10.3389/fmicb.2024.1360445 · Cited by 12
“Exosomes, extracellular vesicles involved in cell communication, homeostasis, differentiation, and organogenesis (Li et al., 2018, 2021; Lai et al., 2022), are pivotal in hair morphogenesis and regeneration, holding potential for alopecia treatment (Hu et al., 2020).”
BackgroundYu, Y., Tong, K., Hu, G., Yang, X., Wu, J., Bai, S., & Yu, R. (2024) · Frontiers in Microbiology · doi:10.3389/fmicb.2024.1378311 · Cited by 12
Wang, B., Xiong, Y., Ren, L., & Zhang, S. (2024) · Journal of Affective Disorders · doi:10.1016/j.jad.2024.07.119 · Cited by 10
Li, R., Huang, G., Li, Y., Huang, M., Huang, Y., Li, Y., Li, G., & Song, W. C. (2024) · Frontiers in Pharmacology · doi:10.3389/fphar.2024.1427318 · Cited by 10
Imahori, Y., Qin, C., Tang, B., & Hägg, S. (2024) · GeroScience · doi:10.1007/s11357-024-01334-6 · Cited by 10
“The paper follows reporting according to the STROBE-MR guidelines [17].”
Chen, Z., Wu, X., Yang, Q., Zhao, H., Ying, H., Liu, H., Wang, C., Zheng, R., Lin, H., Wang, S., et al. (2024) · The Journal of Clinical Endocrinology & Metabolism · doi:10.1210/clinem/dgae635 · Cited by 10
Mo, Q., Liu, X., Gong, W., Wang, Y., Yuan, Z., Sun, X., & Wang, S. (2024) · International Journal of Molecular Sciences · doi:10.3390/ijms251910236 · Cited by 12
“The MR analysis conforms to the STROBE-MR Statement [59], mainly involving instrumental variable selection, instrumental variable assessment, primary MR analysis, and sensitivity analysis.”
MethodZou, C., Zou, H.-X., Jiang, Y., Lai, S., & Liu, J. (2024) · Nutrition Metabolism and Cardiovascular Diseases · doi:10.1016/j.numecd.2024.09.022 · Cited by 11
Wang, Z., Xiong, F., Zhang, Q., & Wang, H. (2024) · Aging Clinical and Experimental Research · doi:10.1007/s40520-024-02865-w · Cited by 10
“Recently, TSMR method has gained popularity in clinical research as a result of its capacity to overcome the effects of potential con - founding and reverse causality [ 13 ].”
MethodAutoimmune Diseases and Risk of Non‐Hodgkin Lymphoma: A Mendelian Randomisation Study
Shi, X., Wallach, J. D., Ma, X., & Rogne, T. (2024) · Cancer Medicine · doi:10.1002/cam4.70327 · Cited by 10
Salenius, K., Väljä, N., Thusberg, S., Iris, F., Ladd‐Acosta, C., Roos, C., Nykter, M., Fasano, A., Autio, R., Lin, J., et al. (2024) · BMC Psychiatry · doi:10.1186/s12888-024-06392-w · Cited by 11
Ma, Y., Wu, F., Yu, Z., & Yang, L. (2025) · Scientific Reports · doi:10.1038/s41598-025-86794-2 · Cited by 12
Nguyen, K. T. K., Xu, H., Gaynor, B. J., McArdle, P. F., O’Connor, T. D., Perry, J. A., Worrall, B. B., Malik, R., Boncoraglio, G. B., Adebamowo, S. N., et al. (2025) · Stroke · doi:10.1161/strokeaha.124.048015 · Cited by 12
Hang, Y.-Q., Piao, X. L., Wu, J., Jiang, Q.-W., & Han, Y. (2025) · Public Health · doi:10.1016/j.puhe.2025.105731 · Cited by 10
Causal relationship and mediating role between depression and cognitive performance
Hao, X., Cao, F., Xu, Z., You, S., Mi, T., Wang, L., Guo, Y., Zhang, Z., Cao, J., Lou, J., et al. (2025) · The Journal of Prevention of Alzheimer s Disease · doi:10.1016/j.tjpad.2025.100196 · Cited by 10
Zhu, X., Wei, J., Li, J., Zuo, S., Wang, J., & Liu, N. (2025) · Nutrition & Metabolism · doi:10.1186/s12986-025-00933-0 · Cited by 10
“To evaluate study quality, data extraction was conducted using a template designed based on the STROBE-MR (Strengthening the Reporting of Observational Studies in Epidemiology with Mendelian Randomization) criteria [11–12].”
Causal association between oral microbiota and oral cancer: a mendelian randomization study
Zhu, W., Qiu, P., Ren, Z., Xu, X., Jiang, X., Yang, W., Han, Y., Oyang, L., Lin, J., Peng, M., et al. (2025) · Scientific Reports · doi:10.1038/s41598-025-05553-5 · Cited by 13
“STROBE-MR checklist was followed in the conduct and interpretation of the MR study 9,10 (Additional file 1: Table S1).”
Sarcopenia and Risk of Cognitive Impairment: Cohort Study and Mendelian Randomization Analysis
Sha, T., Zhang, Y., Wei, J., Li, C., Zeng, C., Lei, G., & Wang, Y. (2025) · JMIR Aging · doi:10.2196/66031 · Cited by 11
“Furthermore, current available human evidence on such association is mostly based on observational research, and therefore cannot be relied on to derive causal inferences due to inherent limitations (eg, reverse causality and unmeas-ured confounders) [22].”
Zhang, Z., Li, G., Yu, L., Jiang, J., Zhou, S., & Jiang, Y. (2023) · International Archives of Allergy and Immunology · doi:10.1159/000528350 · Cited by 9
Liang, W., & Sun, F. (2023) · Journal of Endocrinological Investigation · doi:10.1007/s40618-023-02233-x · Cited by 12
“The study was conducted between March 16 and May 14, 2023, and is reported following the Strengthening the Reporting of Observational Studies in Epidemiology Using Mendelian Randomization guidelines [33].”
Jia, H., Liu, Y., & Liu, D. (2023) · Frontiers in Endocrinology · doi:10.3389/fendo.2023.1221228 · Cited by 14
Chen, H., Zhou, X., Hu, J., Li, S., Wang, Z., Zhu, T., Cheng, H., & Zhang, G. (2023) · Lipids in Health and Disease · doi:10.1186/s12944-023-01983-0 · Cited by 10
“This study was conducted in accordance with the Guidelines for Strengthening the Reporting of Observational Studies in Epidemiology using Mendelian Randomization (STROBE-MR) [19] (Table S1).”
MethodMendelian randomization analysis to investigate the gut microbiome in oral and oropharyngeal cancer
Zhang, Q., Wang, H., Tian, Y., Li, J., Xin, Y., & Jiang, X. M. (2024) · Frontiers in Cellular and Infection Microbiology · doi:10.3389/fcimb.2023.1210807 · Cited by 10
Microbiome and its implications in oncogenesis: a Mendelian randomization perspective.
Feng, K., Ren, F., Xing, Z., Zhao, Y., Yang, C., Liu, J., Shang, Q., Wang, X., & Wang, X. (2023) · PubMed Central · Cited by 11
Lin, L., Yu, H., Xue, Y., Wang, L., & Zhu, P. (2024) · BMC Medical Genomics · doi:10.1186/s12920-024-01826-6 · Cited by 10
“In line with best practices, our study adhered to the Strengthening the Reporting of Observational Studies in Epidemiology using Mendelian Randomization (STROBE-MR) checklist (Table S1) [29].”
MethodMa, G., Yang, J., Wang, X., Xia, E., Yu, J., Zhang, M., Hu, Y., Ma, S., Zhou, X., Fan, Q., et al. (2024) · Scientific Reports · doi:10.1038/s41598-024-62509-x · Cited by 11
“Therefore, MR analysis is a reliable method to investigate the causal relationship between exposure and outcome 6,7 .”
Giontella, A., Lotta, L. A., Overton, J. D., Baras, A., Sartorio, A., Minuz, P., Gill, D., Melander, O., & Fava, C. (2021) · Journal of Personalized Medicine · doi:10.3390/jpm11121306 · Cited by 10
“The analysis was performed using the MR-STROBE guidelines as the reference for reporting MR studies [18].”
Zhao, H., Wu, S., Liu, H., Luo, Z., Sun, J., & Jin, X. (2023) · European Journal of Nutrition · doi:10.1007/s00394-023-03158-0 · Cited by 10
Plasma Proteomic Determinants of Common Causes of MortalityPreprint
Sethi, A., Raj, A., Wright, K., & Melamud, E. (2023) · Research Square · doi:10.21203/rs.3.rs-2626017/v1 · Cited by 8
Li, T., Hu, K., Ye, L., Ma, J., Huang, L., Guo, C., Huang, X., Jiang, J., Xie, X., Guo, C., et al. (2023) · Journal of Atherosclerosis and Thrombosis · doi:10.5551/jat.64461 · Cited by 10
Liu, S., Ding, D., Liu, F.-Y., Guo, Y. Q., Xie, L., & Han, F. (2024) · Journal of Ovarian Research · doi:10.1186/s13048-023-01340-w · Cited by 9
“…exhibit a strong association with the exposure; (ii) genetically determined variations should be independent of confounding factors between the exposure and outcome; and (iii) genetically determined variations should only influence the outcome through the exposure and not via other pathways [19].”
BackgroundLi, S., & Gong, M. (2024) · Gut · doi:10.1136/gutjnl-2023-330967 · Cited by 9
Wang, B., Xiong, Y., Ren, L., Zhang, J., & Zhang, S. (2024) · Immunity Inflammation and Disease · doi:10.1002/iid3.1251 · Cited by 8
Causal effect of gut microbiota and diabetic nephropathy: a Mendelian randomization study
He, G., Chen, J., Hao, W., & Hu, W. (2024) · Diabetology & Metabolic Syndrome · doi:10.1186/s13098-024-01327-7 · Cited by 10
“Mendelian randomization (MR) analysis is a study method to explore the causal effect of exposures and outcomes by using genetic variations as instrumental variables (IVs) [17].”
BackgroundCausal link between oxidative stress and epilepsy: A two‐sample Mendelian randomization study
Xia, Y., Lai, W., Sha, L., Duan, Y., & Chen, L. (2024) · Brain and Behavior · doi:10.1002/brb3.3549 · Cited by 9
Li, H., Li, W., Li, D., Yuan, L., Xu, Y., Su, P., Wu, L., & Zhang, Z. (2024) · Frontiers in Endocrinology · doi:10.3389/fendo.2024.1366290 · Cited by 9
“The design of this study referred to the Mendelian Randomized Enhanced Epidemiological Observation Study Report (STROBE-MR) (17), and all participants in this study were subjects of European ancestry to reduce population strati fi cation bias.”
MethodLi, H., Zhang, H., Hua, W., Liu, H., Zhang, B., Dong, H., Liu, J., Zhou, Y., Yang, P., & Jing, M. (2024) · Journal of Stroke and Cerebrovascular Diseases · doi:10.1016/j.jstrokecerebrovasdis.2024.107814 · Cited by 9
Platelet indices and inflammatory bowel disease: a Mendelian randomization study
Li, H., & Liu, T. (2024) · Frontiers in Immunology · doi:10.3389/fimmu.2024.1377915 · Cited by 9
Causal roles of skin and gut microbiota in skin appendage disorders suggested by genetic study
Zhu, Y., Liu, W., Wang, M., Wang, X., & Wang, S. (2024) · Frontiers in Immunology · doi:10.3389/fimmu.2024.1427276 · Cited by 11
Lv, H., Wang, Z., Huang, C., Yu, X., Li, X., & Song, X. (2024) · Ophthalmology Science · doi:10.1016/j.xops.2024.100684 · Cited by 9
Li, Y., Shan, L., Wen, Q., Cao, C., Huang, M., Zhang, C., Li, X., Wang, K., Zhou, T., Zha, F., et al. (2025) · BMC Endocrine Disorders · doi:10.1186/s12902-025-01834-2 · Cited by 9
“Finally, the predictive value for DM risk were assessed through ROC curve analysis [20, 26].”
Yang, Q., Li, M., Chen, P., Dou, N., Liu, M., Lu, P., & Yu, C. (2025) · Journal of the American Heart Association · doi:10.1161/jaha.124.035936 · Cited by 11
Wei, P., Gao, S., & Han, G. (2025) · Biomedicines · doi:10.3390/biomedicines13030639 · Cited by 9
Cannabis use and the risk of periodontitis: A two‐sample Mendelian randomization study
Baumeister, S., Alayash, Z., Baurecht, H., Reckelkamm, S. L., Kocher, T., Holtfreter, B., Ehmke, B., & Nolde, M. (2022) · Journal Of Clinical Periodontology · doi:10.1111/jcpe.13632 · Cited by 11
Lipid-lowering drug targets and Parkinson's disease: A sex-specific Mendelian randomization study
Zhao, Y., & Taliun, S. A. G. (2022) · Frontiers in Neurology · doi:10.3389/fneur.2022.940118 · Cited by 9
Zhang, L., Yang, F., Ma, J., Hu, Y., Li, M., Wang, C., Chang, X., & Yang, L. (2023) · The Journal of Prevention of Alzheimer s Disease · doi:10.14283/jpad.2023.116 · Cited by 9
“The study adhered to the reporting guidelines of the STROBE-MR (20).”
Ren, S., Chen, X., Xu, M., & Li, X. (2023) · Nutrients · doi:10.3390/nu15194208 · Cited by 9
Cai, X., Li, X., Liang, C., Zhang, M., Xu, Y., Dong, Z., Weng, Y., & Yu, W. (2023) · Scientific Reports · doi:10.1038/s41598-023-48175-5 · Cited by 8
“The STROBE-ME guidelines 15,16 were followed during the current study.”
MethodYao, X., Yang, Y., Jiang, Z. S., Ma, W., & Yao, X. (2024) · Frontiers in Nutrition · doi:10.3389/fnut.2024.1337256 · Cited by 9
Yin, T., Zhu, X., He, Z., Bai, H., Shen, C., Li, R., & Wang, B. (2024) · PLoS ONE · doi:10.1371/journal.pone.0287125 · Cited by 10
“We report MR Studies following the reporting guidelines for enhanced observational epidemiological studies using Mendelian randomization (STROBE-MR) [21].”
MethodChen, S., Zhang, M., Zhang, W., Shao, X., Yang, X., Yang, Z. G., & Nan, K. (2024) · Journal of Epidemiology and Global Health · doi:10.1007/s44197-024-00199-4 · Cited by 9
“This is because genetic variants are randomly assorted during gamete formation and are not influenced by environmental or lifestyle factors [23, 24].”
BackgroundMillard, L. A. C., Smith, G. D., & Tilling, K. M. (2024) · European Journal of Epidemiology · doi:10.1007/s10654-024-01097-6 · Cited by 9
“In addition to the approaches using a covariate set that we focus on in this study, there are other falsification tests for exclusion restriction assumption [33, 34].”
MethodLiu, Y., Song, F., Liu, M., Huang, X., Xue, S., Zhang, X., Hao, H., & Zhang, J. (2024) · Lipids in Health and Disease · doi:10.1186/s12944-024-02139-4 · Cited by 9
“According to the STROBE-MR guidelines [21, 22], the process of selecting instrumental variables was as follows: ① in order to select SNPs that meet Assumption 1, a statistically significant threshold (cid:31) P < 5 × 10 − 8 (cid:30) was established; because of the limited number of significant SNPs…”
MethodMa, L., Liu, Z., Fu, L., Fan, J., Kong, C., Wang, T., Bu, H., Liu, Q., Yuan, J., & Fan, X. (2024) · Frontiers in Psychiatry · doi:10.3389/fpsyt.2024.1397813 · Cited by 9
An Overview of Methods and Exemplars of the Use of Mendelian Randomisation in Nutritional Research
Bennett, D., & Du, H. (2022) · Nutrients · doi:10.3390/nu14163408 · Cited by 9
“There is now a large body of literature on how to read [80], conduct [81,82] and report [83] MR studies.”
BackgroundBody Shape Phenotypes and Breast Cancer Risk: A Mendelian Randomization Analysis
Peruchet‐Noray, L., Dimou, N. L., Sedlmeier, A. M., Fervers, B., Romieu, I., Viallon, V., Gunter, M. J., Ferrari, P., Carreras‐Torres, R., & Freisling, H. (2023) · Cancers · doi:10.3390/cancers15041296 · Cited by 10
“The MR analysis was performed and reported in line with the STROBE-MR guidelines [13,14].”
MethodSelf-citationExploring the Lifetime Effect of Children on Wellbeing Using Two-Sample Mendelian Randomisation
Woolf, B. A. R., Sallis, H., & Munafo, M. R. (2023) · Genes · doi:10.3390/genes14030716 · Cited by 7
“This manuscript conforms to the STROBE-MR guidelines [57].”
MethodSelf-citationHavdahl, A., Hughes, A., Sanderson, E. C. M., Ask, H., Cheesman, R., Reichborn‐Kjennerud, T., Andreassen, O. A., Corfield, E. C., Hannigan, L. J., Magnus, P. M., et al. (2023) · medRxiv · doi:10.1101/2023.02.22.23285699 · Cited by 9
Self-citationPhysical activity and the risk of periodontitis: an instrumental variable study
Baumeister, S., Reckelkamm, S. L., Ehmke, B., Nolde, M., & Baurecht, H. (2023) · Clinical Oral Investigations · doi:10.1007/s00784-023-05109-9 · Cited by 8
“The study was conducted based on relevant analysis and reporting guidelines [27, 28].”
MethodFu, Q., Shen, T., Yu, Q., Jiang, L., & Yang, R. (2023) · Scientific Reports · doi:10.1038/s41598-023-46117-9 · Cited by 9
“The analysis design strictly followed the STROBE-MR statement 17,18 , the complete STROBE-MR checklist can be found in the Supplementary Table S1.”
MethodAssociations of 10 dietary habits with breast cancer: a Mendelian randomization study
Wang, X., Chen, L., Cao, R., Ma, R., Liu, Y., Zhao, Q., & Du, Y. (2023) · Frontiers in Nutrition · doi:10.3389/fnut.2023.1215220 · Cited by 8
Yang, J., Lin, W., Ma, Y., Song, H., Mu, C., Wu, Q., Chen, H., Zhang, J., & Liu, X. (2024) · Frontiers in Immunology · doi:10.3389/fimmu.2024.1370831 · Cited by 9
Zhou, F., Liu, Y., Shi, Y., Wu, N., Xie, Y., & Zhou, X. (2024) · Journal of Gastroenterology and Hepatology · doi:10.1111/jgh.16658 · Cited by 11
“13 Data sources.”
Liu, B., Liu, R., Gu, Y., Shen, X., Zhou, J., & Luo, C. (2024) · Frontiers in Endocrinology · doi:10.3389/fendo.2024.1406382 · Cited by 8
The effect of depression status on osteoarthritis: A powerful two-step Mendelian randomization study
Yan, Z., Yang, J., Zhang, H., Li, Z., Zheng, W., Li, S., & Huang, W. (2024) · Journal of Affective Disorders · doi:10.1016/j.jad.2024.08.009 · Cited by 8
Lu, Y., Su, Q., Xie, Z., & Liang, J. (2024) · Food Science & Nutrition · doi:10.1002/fsn3.4630 · Cited by 9
“…of genetic variants as instrumental variables (IVs) for exposures, such as specific dietary preferences, MR analysis can enhance the robustness of causal inference by mitigating unobserved confounding and attenuating reverse causation (Davies, Holmes, and Davey Smith 2018; Skrivankova et al. 2021).”
van Hooijdonk, K. J. M., Reed, Z. E., van den Broek, N., Singh, M., Sallis, H., Gillespie, N. A., Munafo, M. R., & Vink, J. M. (2025) · Psychological Medicine · doi:10.1017/s0033291724003349 · Cited by 8
“The within-person cross-lagged effects (red arrows Figure 2) illustrate how one variable potentially influences another variable over time within a person and are of interest when studying possible causal effects.”
White blood cell traits and lung cancer risk: a two-sample mendelian randomization analysis
Long, K., Zhu, Z., Zheng, X., Xu, G., Chen, C. Y., & Ke, X. (2025) · Scientific Reports · doi:10.1038/s41598-025-88366-w · Cited by 9
“This study adhered to the Strengthening the Reporting of Observational Studies in Epidemiology Using Mendelian Randomization (STROBE-MR) guidelines 23,24 .”
Chen, J., Wang, Y., Wang, K., Mei, Z., & Wang, L. (2025) · Journal of Cellular and Molecular Medicine · doi:10.1111/jcmm.70379 · Cited by 8
Chen, J., Duan, W., Liu, P., Cui, L., Li, A., Zhang, X., & Zuo, X. (2025) · Journal of Affective Disorders · doi:10.1016/j.jad.2025.02.069 · Cited by 9
Spleen volume in relation to ulcerative colitis and Crohn’s disease: a Mendelian randomization study
Su, Q., Li, J., Lu, Y., Liang, J., Huang, S. M., Wu, M., He, Y., An, Z., Ding, J., & Zhang, Z. (2025) · Scientific Reports · doi:10.1038/s41598-025-90104-1 · Cited by 8
Ruan, Z., Liu, J., & Zhao, J. (2025) · BMC Endocrine Disorders · doi:10.1186/s12902-025-01863-x · Cited by 10
“This two-sample MR study followed the STROBE-MR guidelines for strengthening reporting [27].”
Wang, C., Feng, Y., Liu, X., Sun, H., Guo, Z., Shao, J., Li, K., Chen, J., Shu, K., Kong, D., et al. (2025) · BMC Medicine · doi:10.1186/s12916-025-04058-2 · Cited by 11
“Multiple testing correction was applied, and statistical significance was defined at an FDR threshold of < 0.05.”
InfluentialA Principled Framework for Mendelian Randomization in Oral Health Research
Bashir, N. Z., Romandini, M., Kebschull, M., Tsilidis, K. K., Michaud, D. S., & Burgess, S. (2025) · Journal of Periodontal Research · doi:10.1111/jre.13411 · Cited by 8
Tianqi, Y., Zhou, Y., Wu, X., Fang, Z., & Liu, C. (2025) · Nature and Science of Sleep · doi:10.2147/nss.s524675 · Cited by 8
White blood cells and chronic rhinosinusitis: a Mendelian randomization study
Pongdee, T., Bielinski, S. J., Decker, P. A., Kita, H., & Larson, N. B. (2022) · Allergy Asthma and Clinical Immunology · doi:10.1186/s13223-022-00739-2 · Cited by 8
Deng, Y., Huang, J., & Wong, M. C. S. (2023) · Cancer Reports · doi:10.1002/cnr2.1913 · Cited by 8
Deng, G.-H., & Wei, Y.-K. (2023) · Medicine · doi:10.1097/md.0000000000035656 · Cited by 8
“[26] At the same time, this study has some limitations.”
BackgroundLi, M., Shi, P., Yang, H., Tong, S., Qiu, N., Yao, F., Du, Y., Xi, S., & Wang, F. (2024) · Ecotoxicology and Environmental Safety · doi:10.1016/j.ecoenv.2023.115896 · Cited by 8
Genetic correlations and causal relationships between cardio-metabolic traits and sepsis
Zhang, Z., Chen, L., Zhang, H., Xiao, W. L., Yang, J., Huang, J., Hu, Q., Jin, K., & Hong, Y. (2024) · Scientific Reports · doi:10.1038/s41598-024-56467-7 · Cited by 8
“We follow the reporting guideline Strengthening the reporting of observational studies in epidemiology using the Mendelian randomization (STROBE-MR) 20 .”
MethodLiang, Y., Luo, S., Bell, S., Mo, J. M. Y., He, B., Zhou, Y., Bai, X., & Au Yeung, S. L. (2024) · BMC Medicine · doi:10.1186/s12916-024-03486-w · Cited by 8
“This study was conducted in accordance with the Strengthening the Reporting of Observational Studies in Epidemiology using MR (STROBE-MR) (Additional file 2: Supplementary Note) [24].”
MethodLiu, P., Shang, J., Qi, Z., Qiu, S., Lai, X., Shi, L., Zhang, Z., Li, M., & Yang, L. (2024) · Frontiers in Genetics · doi:10.3389/fgene.2024.1260247 · Cited by 9
Jiang, X., Zheng, L., Xiong, M., Wang, S., Jin, Q., Yang, Y., Fang, Y., Lin, H., Mei, J., & Zhou, S. (2024) · Technology in Cancer Research & Treatment · doi:10.1177/15330338241277699 · Cited by 10
Li, J., Ma, X., Zhuo, K., He, Y., Lin, M., Wang, W., Guo, S., Tang, C. S., Zhang, X., & Gao, X. (2024) · Clinical and Experimental Ophthalmology · doi:10.1111/ceo.14440 · Cited by 9
Association of air pollutants with psychiatric disorders: a two-sample Mendelian randomization
Ma, Y.-Y., Li, Q., Shi, A., Li, J.-L., Wang, Y., & Li, X. (2024) · Ecotoxicology and Environmental Safety · doi:10.1016/j.ecoenv.2024.117105 · Cited by 8
Ma, H., Song, D., Zhang, H., Li, T., & Jin, X. Y. (2024) · Cancer Immunology Immunotherapy · doi:10.1007/s00262-024-03854-8 · Cited by 8
“…randomization (MR), an innovative statistical approach, employs genetic variants as proxies to estimate the causal effects of potential risk factors on disease outcomes, thereby overcoming biases such as confounding and reverse causation inherent in traditional observational epidemiology [14, 15].”
BackgroundSystematic Reviews of Epidemiological Studies of Etiology and Prevalence
Egger, M., Buitrago‐García, D., & Smith, G. D. (2022) · Wiley eBooks · doi:10.1002/9781119099369.ch19 · Cited by 6
Self-citationCannabis Use and CKD: Epidemiological Associations and Mendelian Randomization
Dellepiane, S., Paranjpe, I., Rajagopal, M., Kamat, S., O’Hagan, R., Gulamali, F. F., Rein, J. L., Charney, A. W., Do, R., Coca, S. G., et al. (2022) · Kidney Medicine · doi:10.1016/j.xkme.2022.100582 · Cited by 9
“This analysis can be performed using data from the same (1-sample Mendelian randomization) or a different GWAS (2-sample Mendelian randomization).(13)”
MethodGenetically Proxied CRP (C-Reactive Protein) Levels and Lobar Intracerebral Hemorrhage Risk
Myserlis, E. P., Anderson, C. D., & Georgakis, M. K. (2023) · Stroke · doi:10.1161/strokeaha.122.041889 · Cited by 8
Jensen, C. F., Timofeeva, M. N., & Berg‐Beckhoff, G. (2023) · Nutrition Metabolism and Cardiovascular Diseases · doi:10.1016/j.numecd.2023.04.013 · Cited by 8
Bai, C., Shen, Z., Qiu, B., & Zhang, S. (2023) · Frontiers in Endocrinology · doi:10.3389/fendo.2023.1272200 · Cited by 7
“Firstly, despite our efforts to mitigate pleiotropic bias using various methods, there is still a risk of potential pleiotropic bias, inherent to the limitations of the MR method itself (13).”
BackgroundInfluentialZhu, Y., Bi, Y., & Zhu, T. (2024) · Brain and Behavior · doi:10.1002/brb3.3596 · Cited by 8
Methods and practical considerations for performing Mendelian randomization
Richmond, R. C., & Sanderson, E. C. M. (2022) · International Journal of Epidemiology · doi:10.1093/ije/dyac166 · Cited by 8
Self-citationAlkhaqani, A. L. (2022) · Al-Rafidain Journal of Medical Sciences · doi:10.54133/ajms.v2i.66 · Cited by 7
“The STROBE statement is a reporting guideline that assists in categorizing research and provides guidelines on how to effectively report them [6].”
MethodYang, J., Su, T., Zhang, Y., Jia, M., Yin, X., Lang, Y., & Cui, L. (2023) · Frontiers in Neurology · doi:10.3389/fneur.2023.1277996 · Cited by 7
“…variables must be strongly correlated with exposure factors; (2) instrumental variables cannot be correlated with any confounding factors that are associated with exposure and outcome; (3) instrumental variables can only influence outcome variables through exposure factors (8) (Figure 1).”
BackgroundXie, X., Liu, T., & Wang, G. (2024) · Lipids in Health and Disease · doi:10.1186/s12944-023-01989-8 · Cited by 7
“This study adhered to the Strengthening the Reporting of Observational Studies in Epidemiology Using MR rules [16].”
MethodWu, M., Chen, J.-H., Kuang, X., Chen, Y., Wang, Y., Huang, L., Su, M., Chen, Y., Qu, E., & Zhang, X. (2024) · BIO Integration · doi:10.15212/bioi-2023-0020 · Cited by 7
“…with traits associated with sarcopenia; (ii) genetic variants independent of potential confounding factors; and (iii) genetic variants influencing ovarian cancer risk solely through the risk factor, without involvement in alternative pathways (exclusion restriction assumption) [15, 16].”
BackgroundCrinion, S., Wyse, C. A., Donohoe, G. J., Lopez, L. M., & Morris, D. W. (2024) · American Journal of Medical Genetics Part B Neuropsychiatric Genetics · doi:10.1002/ajmg.b.32980 · Cited by 7
Metadata
- Authors
- Skrivankova, V. W., Richmond, R. C., Woolf, B. A. R., Davies, N. M., Swanson, S. A., VanderWeele, T. J., Timpson, N. J., Higgins, J. P. T., Dimou, N., Langenberg, C., Loder, E. W., Golub, R. M., Egger, M., Davey Smith, G., & Richards, J. B.
- Affiliations
- University of Bern (CH)
- University of Bristol (GB)
- Norwegian University of Science and Technology (NO)
- Erasmus MC (NL)
- Harvard University (US)
- Centre international de recherche sur le cancer (FR)
- University of Cambridge (GB)
- Northwestern University (US)
- University of London (GB)
- Corresponding author
- Richards, J Brent
- ORCID
- Venue
- BMJ
- Publisher
- BMJ
- Published
- 2021-10-26
- Volume
- 375
- Pages
- n2233
- ISSN
- 1756-1833 (ISSN-L)
- PMC
- PMC8546498
- OpenAlex
- W3210406414
- Semantic Scholar
- 99c3b9a1837c0cd16d8ee30fe55332a366bfbbf6
- Cited by
- 1,648
- References
- 137
- Citations by year
- 2026: 217 · 2025: 484 · 2024: 599 · 2023: 252 · 2022: 91 · 2021: 4
- FWCI
- 140.35
- Type
- journal article
- Language
- en
- Open access
- hybrid
- doi.org
- Locations
- BMJ (publishedVersion, cc-by)
- Europe PMC (PubMed Central) (publishedVersion, other-oa)
- PubMed Central (publishedVersion, cc-by)
- PubMed (publishedVersion)
- EUR Research Repository (Erasmus University Rotterdam) (publishedVersion, cc-by)
- EUR Research Repository (Erasmus University Rotterdam) (submittedVersion, cc-by)
- BORIS (University Library Bern) (submittedVersion, cc-by)
- Apollo (University of Cambridge) (submittedVersion, cc-by)
- Apollo
- Apollo (cc-by)
- Funders
- National Science Foundation (189498)
- World Health Organization
- Wellcome Trust (WT 217065/Z/19/Z, 217065/Z/19/Z, 202802/Z/16/Z, 217065, 202802)
- Public Health Agency of Canada
- University Hospitals Bristol NHS Foundation Trust
- Compute Canada
- NIHR Bristol Biomedical Research Centre (MC_UU_00011/1, BRC‐1215‐2001, NF-SI-0617-10145)
- Cancer Research UK (C18281/, 29019, C18281 / A19169, 10710, MC_UU_00011/1, 10118, 16563, A19169, 19169)
- National Institute for Health and Care Research (BRC-1215-2001, C18281/A19169, 217065/Z/19/Z, NF-SI-0617-10145, MC_UU_00011/1)
- Department of Health and Social Care
- King's College London
- European Commission (633784)
- University of Bristol (C18281/A19169, 217065/Z/19/Z, MC_UU_00011/1)
- Public Health Agency
- Schweizerischer Nationalfonds zur Förderung der Wissenschaftlichen Forschung (189498, 10145)
- ZonMw (91617066)
- Nederlandse Organisatie voor Wetenschappelijk Onderzoek (91617066)
- Jewish General Hospital
- Norges Forskningsråd (189498, 295989)
- National Institutes of Health (217065/Z/19/Z)
- Canadian Institutes of Health Research (365825; 409511, 40951_1, 365825)
- Medical Research Council (MC_UU_00011/6, 217065/Z/19/Z, MR/M005070/1, 202802/Z/16/Z, 217065, WT 217065/Z/19/Z, MC_UU_00011/7, MC_UU_00011/5, MC_UU_00011/1, MC_UU_00011, MC_UU_00011/2)
- Economic and Social Research Council (+3 PhD Studentship Award, ES/P000630/1, 1+3 PhD Studentship, ES/N000498/1)
- National Cancer Institute (R01CA222147)
- Topics
- Social Sciences › Decision Sciences › Statistics, Probability and Uncertainty › Meta-analysis and systematic reviews
- Physical Sciences › Mathematics › Statistics and Probability › Statistical Methods in Epidemiology
- Physical Sciences › Mathematics › Statistics and Probability › Advanced Causal Inference Techniques
- Keywords
- reporting guidelines, Mendelian randomization, observational studies, causal inference, reporting checklist, transparency in research reporting, study quality assessment
- MeSH terms
- Humans, Epidemiologic Research Design, Guidelines as Topic, Mendelian Randomization Analysis, Observational Studies as Topic
About these checks
Registry, retraction, Cites and statistics results are computed, not judged, with one exception: a printed reference that no index lists is read once by a model before it counts as a citation error. Claims are extracted by a model and kept only when their quote appears verbatim in the text; each cited source is then checked, with a model’s help, for whether it says what the claim relies on. Those verdicts can be wrong — read the claim’s quote and the cited source before relying on one.
A language model drew the claims from the paper on 2026-10-10, under version 3 of the claim definition (model deepseek-v4.1-flash, prompt extract-v3).
A second model labelled each claim on 2026-10-10 (model jev-1.13-20260917, definition revision gold-guideline-v0.2).
Statistics and arithmetic are recomputed, not judged.
Confidence bands are shown only for fields calibrated on our annotated test set. None is calibrated yet, so no band is shown.
What counts as a claim ›How we measure confidence ›How we check this ›
Are you an author, or do you see a problem with this page? Request a review
