

The DOI matches its Crossref record; 69 of the 69 references it cites were found in a registry or an index.
Mediterranean diet intervention in overweight and obese subjects lowers plasma cholesterol and causes changes in the gut microbiome and metabolome independently of energy intake
Open accessAbstract
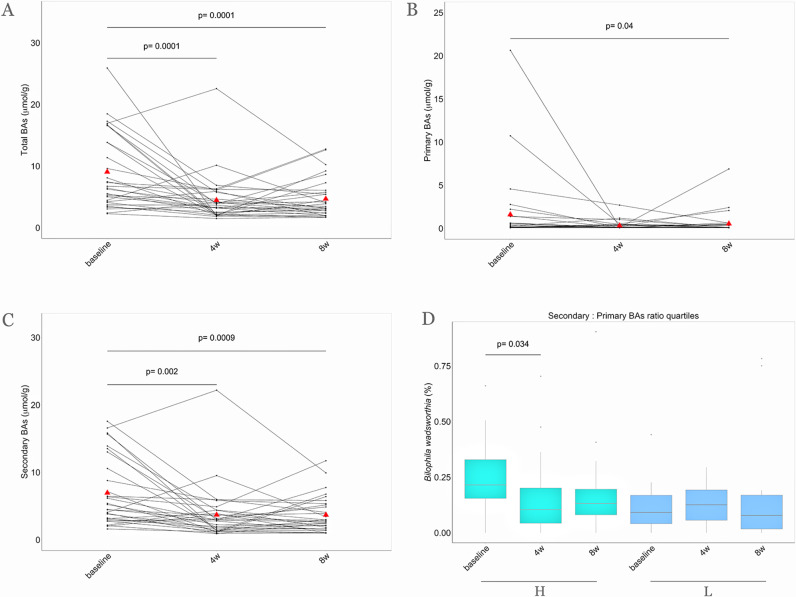
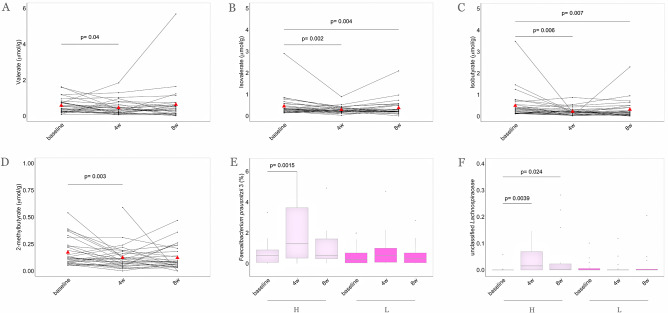
Objectives This study aimed to explore the effects of an isocaloric Mediterranean diet (MD) intervention on metabolic health, gut microbiome and systemic metabolome in subjects with lifestyle risk factors for metabolic disease. Design Eighty-two healthy overweight and obese subjects with a habitually low intake of fruit and vegetables and a sedentary lifestyle participated in a parallel 8-week randomised controlled trial. Forty-three participants consumed an MD tailored to their habitual energy intakes (MedD), and 39 maintained their regular diets (ConD). Dietary adherence, metabolic parameters, gut microbiome and systemic metabolome were monitored over the study period. Results Increased MD adherence in the MedD group successfully reprogrammed subjects’ intake of fibre and animal proteins. Compliance was confirmed by lowered levels of carnitine in plasma and urine. Significant reductions in plasma cholesterol (primary outcome) and faecal bile acids occurred in the MedD compared with the ConD group. Shotgun metagenomics showed gut microbiome changes that reflected individual MD adherence and increase in gene richness in participants who reduced systemic inflammation over the intervention. The MD intervention led to increased levels of the fibre-degrading Faecalibacterium prausnitzii and of genes for microbial carbohydrate degradation linked to butyrate metabolism. The dietary changes in the MedD group led to increased urinary urolithins, faecal bile acid degradation and insulin sensitivity that co-varied with specific microbial taxa. Conclusion Switching subjects to an MD while maintaining their energy intake reduced their blood cholesterol and caused multiple changes in their microbiome and metabolome that are relevant in future strategies for the improvement of metabolic health.
Overview
The claims and statistics of this paper haven’t been checked yet.
Run the check — free, no account needed. It reads the open-access text and checks the sources it cites.
Integrity signals
Registry
Cites
Statistics
Figures
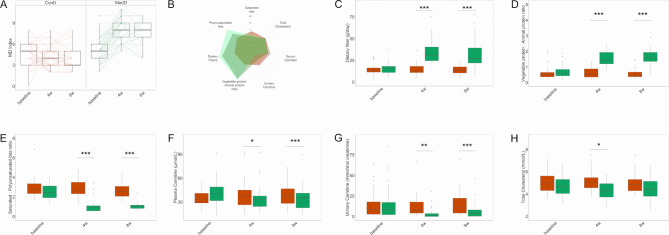
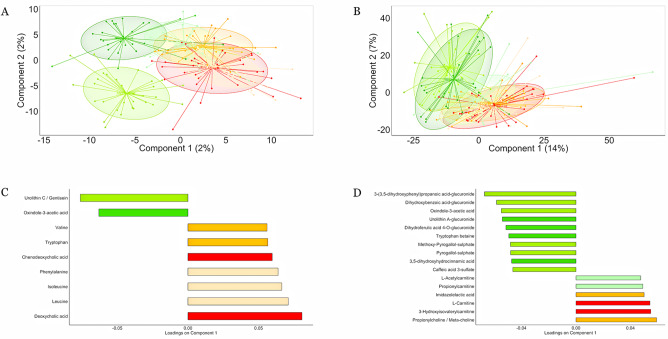
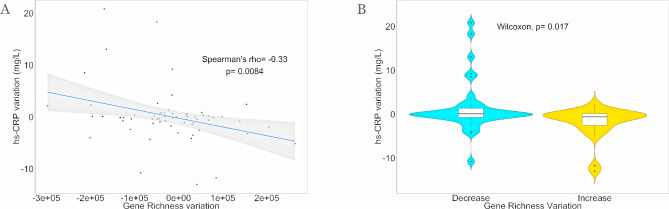
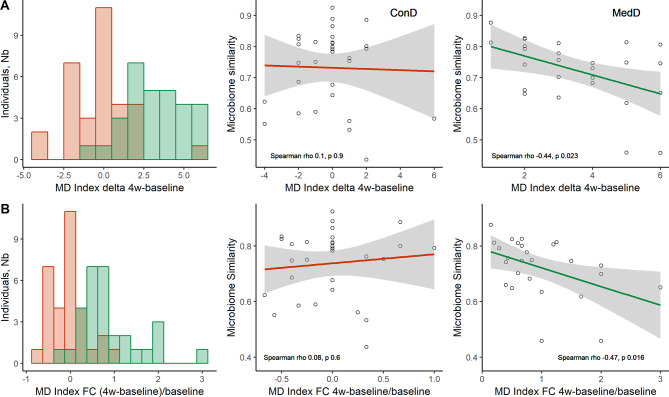
Verification
Claims the paper makes
The claims and statistics of this paper haven’t been checked yet.
Run the check — free, no account needed. It reads the open-access text and checks the sources it cites.
Claims other papers make about this one
Each is checked against this paper’s own text: does it say what the citing paper says it does?
In the citing paper
“Greater microbial diversity as well as higher abundance of health-promoting bacterial taxa (i.e., Clostridium cluster XIVa, F. prausnitzii, Roseburia, Eubacterium, B. thetaiotaomicron, Parabacteroides distasonis, Bifidobacterium adolescentis, and Bifidobacterium longum) have been associated with consumption of the Mediterranean diet (38)(39)(40).”
From Diet and the Microbiota–Gut–Brain Axis: Sowing the Seeds of Good Mental Health (2021) · cites this paper as [40]
In the citing paper
“More recent human intervention studies also support the beneficial impact of a Mediterranean diet on microbiota profiles.”
From Diet and the Microbiota–Gut–Brain Axis: Sowing the Seeds of Good Mental Health (2021) · cites this paper as [40]
In the citing paper
“Additionally, adherence to a Mediterranean diet was linked to beneficial microbiota-related metabolomic profiles, such as increased levels of SCFAs and reductions in BCFAs, bile acids, and trimethylamine N-oxide (TMAO) (38,40,41).”
From Diet and the Microbiota–Gut–Brain Axis: Sowing the Seeds of Good Mental Health (2021) · cites this paper as [40]
Self-check
Percentages, sums and reported differences re-computed from the paper’s own numbers.
The self-check needs the paper’s full text.
Citations
Cites
Diet rapidly and reproducibly alters the human gut microbiome
David, L. A., Maurice, C. F., Carmody, R. N., Gootenberg, D. B., Button, J. E., Wolfe, B. E., Ling, A. V., Devlin, A. S., Varma, Y., Fischbach, M. A., et al. (2014) · Nature · doi:10.1038/nature12820 · Cited by 10,100
Complex heatmaps reveal patterns and correlations in multidimensional genomic data
Gu, Z., Eils, R., & Schlesner, M. (2016) · Bioinformatics · doi:10.1093/bioinformatics/btw313 · Cited by 10,037
Richness of human gut microbiome correlates with metabolic markers
Le Chatelier, E., Nielsen, T., Qin, J., Prifti, E., Hildebrand, F., Falony, G., Almeida, M., Arumugam, M., Batto, J.-M., Kennedy, S., et al. (2013) · Nature · doi:10.1038/nature12506 · Cited by 4,662
Self-citationSokol, H., Pigneur, B., Watterlot, L., Lakhdari, O., Bermúdez-Humarán, L. G., Gratadoux, J.-J., Blugeon, S., Bridonneau, C., Furet, J.-P., Corthier, G., et al. (2008) · Proceedings of the National Academy of Sciences · doi:10.1073/pnas.0804812105 · Cited by 4,413
Changes in diet and lifestyle and long-term weight gain in women and men
Mozaffarian, D., Hao, T., Rimm, E. B., Willett, W. C., & Hu, F. B. (2011) · New England Journal of Medicine · doi:10.1056/nejmoa1014296 · Cited by 2,527
Human gut microbes impact host serum metabolome and insulin sensitivity
Pedersen, H. K., Gudmundsdottir, V., Nielsen, H. B., Hyotylainen, T., Nielsen, T., Jensen, B. A. H., Forslund, K., Hildebrand, F., Prifti, E., Falony, G., et al. (2016) · Nature · doi:10.1038/nature18646 · Cited by 2,116
Dietary-fat-induced taurocholic acid promotes pathobiont expansion and colitis in Il10-/- mice
Devkota, S., Wang, Y., Musch, M. W., Leone, V., Fehlner-Peach, H., Nadimpalli, A., Antonopoulos, D. A., Jabri, B., & Chang, E. B. (2012) · Nature · doi:10.1038/nature11225 · Cited by 1,904
Current methods of the U.S. Preventive Services Task Force
Harris, R., Helfand, M., Woolf, S. H., Lohr, K. N., Mulrow, C. D., Teutsch, S. M., & Atkins, D. C. (2001) · American Journal of Preventive Medicine · doi:10.1016/s0749-3797(01)00261-6 · Cited by 1,720
De Filippis, F., Pellegrini, N., Vannini, L., Jeffery, I. B., La Storia, A., Laghi, L., Serrazanetti, D. I., Di Cagno, R., Ferrocino, I., Lazzi, C., et al. (2016) · Gut · doi:10.1136/gutjnl-2015-309957 · Cited by 1,638
Cited by
Sorted by citations
Items 301–400 of 592
Verediano, T. A., Ana, C. T. S., Grancieri, M., Tako, E., Paes, M. C. D., & Martino, H. S. D. (2022) · Nutrition Research · doi:10.1016/j.nutres.2022.10.005 · Cited by 10
Sinsuebchuea, J., Paenkaew, P., Wutthi-in, M., Nantanaranon, T., Laeman, K., Kittichotirat, W., Wattanachaisaereekul, S., Dulsawat, S., Nopharatana, M., Vorapreeda, N., et al. (2023) · Microorganisms · doi:10.3390/microorganisms11010136 · Cited by 11
Gregory, S., Ntailianis, G., Shannon, O. M., Stevenson, E., Ritchie, C. W., Wells, K., & Terrera, G. M. (2023) · Nutrition Metabolism and Cardiovascular Diseases · doi:10.1016/j.numecd.2023.07.020 · Cited by 9
Ferguson, J. J. A., Clarke, E. D., Stanford, J., Burrows, T. L., Wood, L., & Collins, C. E. (2023) · BMJ Open · doi:10.1136/bmjopen-2023-073658 · Cited by 9
Wang, G., Xu, X.-X., Ma, L., Yang, J., Yang, B.-C., Peng, R., Pan, Z., Sima, Y., & Xu, S. (2024) · Journal of Economic Entomology · doi:10.1093/jee/toae014 · Cited by 9
Diabetes and vitamin D: The effect of insulin sensitivity and gut microbial health
Daley, D. K., & Myrie, S. B. (2024) · Advances in food and nutrition research · doi:10.1016/bs.afnr.2024.04.001 · Cited by 15
Zhang, J., Liu, Q.-M., Gu, F., Li, Y., Chen, H., Liu, M., Zhou, Y. T., Liu, H., Wei, X., & Liu, G. (2024) · Food & Function · doi:10.1039/d4fo00991f · Cited by 9
Differential effects of low or high-fat dairy and fat derived from dairy products on MASLD
Tirosh, O., Verman, M., Wajcman, D. I., Grinshpan, L. S., Isakov, N. F., Webb, M., Shibolet, O., Kariv, R., & Zelber‐Sagi, S. (2024) · JHEP Reports · doi:10.1016/j.jhepr.2024.101194 · Cited by 10
Wang, Z., Zhang, H., & Shao, Z. (2024) · Scientific Reports · doi:10.1038/s41598-024-83971-7 · Cited by 9
Unraveling Spinal Cord Injury Nutrition: Effects of Diet on the Host and Microbiome
Li, Z., Wang, X., Du, H., Liu, W., Zhang, C., Talifu, Z., Xu, X. P., Pan, Y., Zhang, J., Ke, H., et al. (2025) · Advances in Nutrition · doi:10.1016/j.advnut.2025.100448 · Cited by 12
Seethaler, B., Neyrinck, A. M., Basrai, M., Kiechle, M. B., Delzenne, N. M., & Bischoff, S. C. (2025) · Life Sciences · doi:10.1016/j.lfs.2025.123855 · Cited by 12
Muscogiuri, G., Maiorino, M. I., Paolini, B., Aversano, F., Buscemi, C., Cappiello, I., Caruso, I., Ceriani, E., Chimienti, M., Cicero, A. F. G., et al. (2025) · Nutrition · doi:10.1016/j.nut.2025.112975 · Cited by 9
Personalized Delivery of Probiotics and Prebiotics via 3D Food Printing
Yu, J. Y. (2025) · Metabolites · doi:10.3390/metabo15110744 · Cited by 12
Zhang, Y., & Wang, D. D. (2026) · Gut Microbes · doi:10.1080/19490976.2026.2644682 · Cited by 13
Resiliency of the Digestive System During Aging and the Impact of Diet
Sanders, L., Goltz, S. R., & Maki, K. C. (2023) · Nutrition Today · doi:10.1097/nt.0000000000000616 · Cited by 10
Metabolomics application for the design of an optimal diet
Naureen, Z., Cristoni, S., Donato, K., Medori, M. C., Samaja, M., Herbst, K. L., Aquilanti, B., Velluti, V., Matera, G., Fioretti, F., et al. (2022) · Journal of preventive medicine and hygiene · doi:10.15167/2421-4248/jpmh2022.63.2s3.2755 · Cited by 11
Multiscale adaptive differential abundance analysis in microbial compositional data
Wang, S. (2023) · Bioinformatics · doi:10.1093/bioinformatics/btad178 · Cited by 9
Effectiveness of mainstream diets
Modi, N., & Priefer, R. (2020) · Obesity Medicine · doi:10.1016/j.obmed.2020.100239 · Cited by 11
Zeraattalab-Motlagh, S., Lesani, A., Majdi, M., & Shab‐Bidar, S. (2022) · British Journal Of Nutrition · doi:10.1017/s0007114522001842 · Cited by 8
Food-breastmilk combinations alter the colonic microbiome of weaning infants: an in silico study
da Silva, V. G., Smith, N. W., Mullaney, J. A., Wall, C. R., Roy, N. C., & McNabb, W. C. (2024) · mSystems · doi:10.1128/msystems.00577-24 · Cited by 9
Fang, X., Zhang, Y., Huang, X., Miao, R., Zhang, Y., & Tian, J. (2025) · Diabetes Obesity and Metabolism · doi:10.1111/dom.16387 · Cited by 10
Gentile, G., Marinaccio, L., Mollica, A., & Stefanucci, A. (2025) · Food Safety and Health · doi:10.1002/fsh3.70019 · Cited by 8
Gut microbiota’s role in heart failure
Florek, K., Komorowska, K., Ptak, J., Jarocki, M., Gontarczyk, J., Mania, R., Boluk, A., Żurawska-Płaksej, E., Łaczmański, Ł., & Sokolski, M. (2025) · Heart Failure Reviews · doi:10.1007/s10741-025-10543-w · Cited by 11
Dietary interventions for modulating the gut microbiome in PCOS management
Patel, E. (2026) · Frontiers in Endocrinology · doi:10.3389/fendo.2026.1713408 · Cited by 8
Dietary Polyphenols as Modulators of Bifidobacterium in the Human Gut Microbiota
Toderescu, C. D., Parveen, M., Trifunschi, S., Oancea, A., (Jurj), G. C. C., Cresneac, I. G., Munteanu, M. F., Ciopanoiu, I., Boru, C., Pogurschi, E. N., et al. (2026) · Nutrients · doi:10.3390/nu18050782 · Cited by 12
Calatayud-Sáez, F. M., Calatayud, B., & Calatayud, A. (2022) · Nutrients · doi:10.3390/nu14050936 · Cited by 8
Regulation of SARS-CoV-2 infection by diet-modulated gut microbiota
Tieu, V., Tibi, S., & Ling, J. (2023) · Frontiers in Cellular and Infection Microbiology · doi:10.3389/fcimb.2023.1167827 · Cited by 9
Memili, A., Lulla, A., Liu, H., Shikany, J. M., Jacobs, D. R., Langsetmo, L., North, K. E., Jones, C. D., Launer, L. J., & Meyer, K. A. (2022) · Journal of Nutrition · doi:10.1016/j.tjnut.2022.12.019 · Cited by 8
Optimizing Dietary Fiber Intake: Strategies for Human Nutrition and Food Science
Walsh, S. K., Armet, A. M., Nikolaeva, D. D., Mota, J. F., Lucey, A. J., Oliero, M., & Walter, J. (2026) · Annual Review of Food Science and Technology · doi:10.1146/annurev-food-052824-044842 · Cited by 7
Lee, C. Y. (2021) · Frontiers in Endocrinology · doi:10.3389/fendo.2021.748477 · Cited by 8
McLeod, A., Bernabé, B. P., Xia, Y., Sanchez-Flack, J., Lamar, M., Schiffer, L. A., Hemphill, N. O., Fantuzzi, G., Maki, P. M., Fitzgibbon, M., et al. (2023) · Nutrients · doi:10.3390/nu15153332 · Cited by 9
Gallegos, I. R., Arroyo, M. M., López‐González, Á. A., Herrero, M. T. V., Vallejos, D., Sastre-Alzamora, T., & Ramírez‐Manent, J. I. (2024) · Nutrients · doi:10.3390/nu16071082 · Cited by 7
O'CONNOR, H. M., Li, S., Hodge, A. M., Callaway, L. K., McIntyre, D. H., Barrett, H. L., Wilkinson, S. A., & Nitert, M. D. (2022) · Journal of Human Nutrition and Dietetics · doi:10.1111/jhn.13123 · Cited by 7
Four functional profiles for fibre and mucin metabolism in the human gut microbiome
Labarthe, S., Plancade, S., Raguideau, S., Oñate, F. P., Chatelier, E. L., Leclerc, M., & Laroche, B. (2023) · Microbiome · doi:10.1186/s40168-023-01667-y · Cited by 8
Liu, S., Zhang, J., Sheng, Y., Feng, T., Shi, W., Lu, Y., Guan, X., Chen, X., Huang, J., & Chen, J. (2023) · Metabolites · doi:10.3390/metabo13030336 · Cited by 7
Zyoud, S. H. (2024) · Journal of Health Population and Nutrition · doi:10.1186/s41043-024-00497-4 · Cited by 10
Food Neophobia and scarce olfactory performances are linked to oral microbiota
Valentino, V., Filippis, F. D., Menghi, L., Gasperi, F., & Ercolini, D. (2022) · Food Research International · doi:10.1016/j.foodres.2022.111092 · Cited by 7
Song, Y., Cheng, F., Du, Y., Zheng, J., An, Y., & Lu, Y. (2023) · Nutrients · doi:10.3390/nu15183974 · Cited by 7
Dietary Trends, Microbiome, and Cardiovascular Health: A Narrative Review
Sanchis‐Gomar, F., Pareja-Galeano, H., Moya-Morales, J. M., Vázquez-González, S., & Pérez-Quilis, C. (2025) · Heart and Mind · doi:10.4103/hm.hm-d-24-00109 · Cited by 7
Zhang, X., Wu, L., Li, H., Zhang, S., & Hua, W. (2025) · Frontiers in Nutrition · doi:10.3389/fnut.2025.1583805 · Cited by 7
Gut microbiota and its role in development of chronic disease and aging
Vesnina, A. D., Frolova, A. S., Chekushkina, D., Milentyeva, I., Luzyanin, S., & Aksenova, L. (2025) · Foods and raw materials · doi:10.21603/2308-4057-2026-1-668 · Cited by 8
Long, D., Mao, C., An, H., Zhu, Y., & Xu, Y. (2025) · Frontiers in Nutrition · doi:10.3389/fnut.2025.1594481 · Cited by 9
Comparative effect of dietary patterns on selected cardiovascular risk factors: A network study
Sun, Y., Shang, M., Zhang, Y., Hu, J., & Wang, H. (2025) · Scientific Reports · doi:10.1038/s41598-025-13596-x · Cited by 8
Gut microbiota as a metabolic mediator to prevent or attenuate MASLD
Luo, J., Wei, Y., Fan, Z., Li, B., Li, L., Chai, Y., Xing, Z., Qiu, Y., Lu, W., & Fang, Z. (2025) · Critical Reviews in Food Science and Nutrition · doi:10.1080/10408398.2025.2545525 · Cited by 7
de Oliveira, A. D. S., Graciliano, N. G., Praxedes, D. R. S., Macêna, M. D. L., Júnior, A. E. D. S., Pereira, M. R., dos Santos, J. V. L., Galdino-Silva, M. B., Almeida, K. M. M., Tenório, D. M. C., et al. (2025) · Food & Function · doi:10.1039/d5fo02449h · Cited by 9
The Role of Gut Microbiota in Chronic Noncommunicable Diseases: An Overview of the Last Decade
Minari, T. P., & Pisani, L. P. (2025) · Nutrition Reviews · doi:10.1093/nutrit/nuaf200 · Cited by 7
The Mediterranean diet: historical benefits and contemporary challenges in Southern Italy
Abenavoli, L., Kobyliak, N. M., Kukharchuk, A., Chervona, O., Shvets, Y. V., Scarlata, G. G. M., Morano, D., Christian, E., Molochek, N., Lynchak, O. V., et al. (2025) · Nutrition Research · doi:10.1016/j.nutres.2025.11.010 · Cited by 6
Patoine, C., Sheffler, J., Sims, T., Gutierrez, V., Park, G., Mayonu, M., Wang, B., & Nagpal, R. (2025) · Gut Microbes Reports · doi:10.1080/29933935.2025.2605879 · Cited by 8
Massart, A. G. M., Rocha, Á., Ferreira, J. P., Soares, C., Campos, M. J., & Martinho, D. V. (2025) · Journal of Functional Morphology and Kinesiology · doi:10.3390/jfmk10010016 · Cited by 6
Connan, C., Fromentin, S., Benallaoua, M., Alvarez, A., Pons, N., Quinquis, B., Morabito, C., Nazare, J., Borezée‐Durant, E., Haimet, F., et al. (2025) · JMIR Research Protocols · doi:10.2196/64894 · Cited by 6
Lim, T., Lee, K., Kim, R. H., Ryu, J., Cha, K. H., Park, S. Y., Koo, S. Y., & Hwang, K. T. (2023) · Food Science and Biotechnology · doi:10.1007/s10068-023-01267-4 · Cited by 6
Effects of OsomeFood Clean Label plant-based meals on the gut microbiome
Dwiyanto, J., Bibi, C., Meng, L. M. C., Jason, F., Tan, G., Lim, J., & Chong, C. W. (2023) · BMC Microbiology · doi:10.1186/s12866-023-02822-z · Cited by 6
Understanding the Relationship Between Cerebrovascular Disease and the Gut Microbiome
Roth, W., Lo, E., DeLeon, O., Suriya, S. S., Fakhri, F., Brorson, J. R., Polster, S. P., Kass‐Hout, T., Prabhakaran, S., & Siegler, J. E. (2024) · Stroke Vascular and Interventional Neurology · doi:10.1161/svin.124.001272 · Cited by 7
Frolova, M. S., Yudin, S. M., Makarov, V. V., Glazunova, O. A., Alikina, О., Markelova, N., Kolzhetsov, N. P., Dzhelyadin, T., Shcherbakova, V. A., Trubitsyn, V. E., et al. (2021) · Life · doi:10.3390/life11111246 · Cited by 6
Day, M., Sing, E., Spencer, M., Moellenberg, K., Mello, I., & Moore, A. (2024) · Nursing · doi:10.1097/nsg.0000000000000063 · Cited by 6
The possible effects of chili peppers on ADHD in relation to the gut microbiota
Li, Y., Feng, J. B., Ding, G., Deng, L., He, Y., Zhang, Q., Wang, J., & Chen, X. (2025) · Frontiers in Nutrition · doi:10.3389/fnut.2025.1551650 · Cited by 5
Wang, Q., Han, C., Zheng, Y., Liu, X., Lv, Z., Du, Z., Liu, T., Hao, C., Meng, X., Li, T., et al. (2025) · Free Radical Biology and Medicine · doi:10.1016/j.freeradbiomed.2025.08.003 · Cited by 5
Alternative proteins and gut health: balancing sustainability and uncertainty
Marotta, R., Pontonio, E., Ferrocino, I., & Filippis, F. D. (2025) · Current Opinion in Food Science · doi:10.1016/j.cofs.2025.101355 · Cited by 5
Regulation of sterol metabolism by gut microbiota and its relevance to disease
Huang, C., Wu, Q., Wang, J., Cai, J., Wang, Z., You, L., Zhu, Z., & Ding, Y. (2025) · Gut Microbes · doi:10.1080/19490976.2025.2589493 · Cited by 5
Williams, G. M., Hoedt, E. C., Duncanson, K., Gan, L. T., Prakoso, E., Talley, N. J., & Beck, E. J. (2025) · Nutrition & Metabolism · doi:10.1186/s12986-025-00939-8 · Cited by 5
Xiang, S., Li, Y., Li, Y., Xie, S., Wang, C., Che, X., & Du, Y. (2026) · The journal of nutrition health & aging · doi:10.1016/j.jnha.2026.100775 · Cited by 6
The gut-brain axis in diabetic neuropathy, cognitive impairment, and emotional disorders
Yu, X., Zhang, K., Kan, C., Ma, Y., Sheng, S., Zheng, T., & Sun, X. (2026) · Neuroscience · doi:10.1016/j.neuroscience.2026.02.006 · Cited by 5
Sanghvi, G. V., Bishoyi, A. K., Joshi, K., Kaneriya, J. P., & Pattani, V. B. (2026) · Clinical Nutrition ESPEN · doi:10.1016/j.clnesp.2026.103422 · Cited by 6
Persistence of folk dishes in the Coastal Cilento's Culinary Culture: an ethnogastronomic approach
Motti, R., Ercolini, D., Ricciardi, M., Gherardelli, M., Iacomino, G., & Magistris, A. D. (2024) · Discover Food · doi:10.1007/s44187-024-00083-x · Cited by 5
The gut microbiome without any plant food? A case study on the gut microbiome of a healthy carnivore
Karačić, A., Dikarlo, P., Dorst, I., Renko, I., & Pršo, A.-M. L. (2024) · Microbiota and Host · doi:10.1530/mah-24-0006 · Cited by 5
Are an Aging Gut and a Decrease in Butyrate Production the Reasons for Atherosclerosis?
Dicks, L. M. T. (2025) · International Journal of Molecular Sciences · doi:10.3390/ijms26178276 · Cited by 6
Shevlyakov, A., Nikogosov, D. A., Stewart, L.-A., & Toribio-Mateas, M. A. (2021) · Public Health Nutrition · doi:10.1017/s1368980021002524 · Cited by 5
Jamka, M., Wasiewicz-Gajdzis, M., & Walkowiak, J. (2021) · Journal of Medical Science · doi:10.20883/medical.e523 · Cited by 6
Cecchini, M., Urbano, T., Lasagni, D., Luca, T. D., Malavolti, M., Baraldi, C., Grioni, S., Agnoli, C., Sieri, S., Santachiara, A., et al. (2022) · Dietetics · doi:10.3390/dietetics1020010 · Cited by 5
The Role of the Human Gutome on Chronic Disease
Hoefer, C. C., Hollon, L. K., & Campbell, J. A. (2022) · Clinics in Laboratory Medicine · doi:10.1016/j.cll.2022.09.015 · Cited by 5
Ren, Y., Feng, Y., Wang, Q., Qu, P., Luo, S., Huang, D., Chen, L., Zhao, L., & Liang, X. (2023) · Public Health · doi:10.1016/j.puhe.2023.04.018 · Cited by 5
Solving the Obesity Crisis in Older Adults with the Mediterranean Diet: Policy Brief
Hanna, A. M. R. (2023) · The journal of nutrition health & aging · doi:10.1007/s12603-023-1995-9 · Cited by 5
How Different Are the Influences of Mediterranean and Japanese Diets on the Gut Microbiome?
Moriki, D., Koumpagioti, D., Francino, M. P., Rufián‐Henares, J. Á., Kalogiannis, M., Priftis, K. Ν., & Douros, K. (2024) · Endocrine Metabolic & Immune Disorders - Drug Targets · doi:10.2174/0118715303261069231124092259 · Cited by 4
Lu, F., Wong, C. K. H., Ng, A. P. P., Li, L., Fong, D., Ip, P., Tse, E. T. Y., & Lam, C. L. K. (2024) · Patient Education and Counseling · doi:10.1016/j.pec.2024.108240 · Cited by 5
In-depth Microbiological Characterization of Urine From Subjects With Type 2 Diabetes
Calvigioni, M., Biancalana, E., Mazzantini, D., Celandroni, F., Rossi, C., Mengozzi, A., Ghelardi, E., & Solini, A. (2024) · The Journal of Clinical Endocrinology & Metabolism · doi:10.1210/clinem/dgae389 · Cited by 5
Possibilities and Prospects of Modification of the Intestinal Microbiome
Малаева, Е. Г., & Стома, И. О. (2022) · The Russian Archives of Internal Medicine · doi:10.20514/2226-6704-2022-12-5-341-351 · Cited by 6
Impact of gut permeability on the breast microbiome using a non-human primate model
Bawaneh, A., Shively, C. A., Tooze, J. A., & Cook, K. L. (2022) · Gut Microbiome · doi:10.1017/gmb.2022.9 · Cited by 5
DietHub: Dietary habits analysis through understanding the content of recipes
Petković, M., Popovski, G., Seljak, B. K., Kocev, D., & Eftimov, T. (2020) · Trends in Food Science & Technology · doi:10.1016/j.tifs.2020.10.017 · Cited by 5
Procházková, N., Laursen, M. F., Barbera, G. L., Tsekitsidi, E., Jørgensen, M. S., Rasmussen, M. A., Raes, J., Licht, T. R., Dragsted, L. O., & Roager, H. M. (2024) · bioRxiv (Cold Spring Harbor Laboratory) · doi:10.1101/2024.01.23.574598 · Cited by 5
Stanford, J., Gómez‐Martín, M., Clarke, E. D., Ferguson, J. J. A., Burrows, T. L., Wood, L. G., & Collins, C. E. (2025) · Molecular Nutrition & Food Research · doi:10.1002/mnfr.70271 · Cited by 4
Updates on Mediterranean diet and health status: active ingredients and pharmacological mechanisms
Schwingshackl, L., Morze, J., Wallerer, S., & HOFFMANN, G. E. (2026) · British Journal of Pharmacology · doi:10.1111/bph.70441 · Cited by 6
Gut microbiota and metabolic disease risk in youth
Xie, Q. Y., Hamilton, J. K., & Danska, J. S. (2026) · Cell Reports Medicine · doi:10.1016/j.xcrm.2025.102571 · Cited by 6
Microbiota-derived metabolites as nutritional signals in insulin resistance and obesity
Gupta, R., Saini, P., Srivastava, V., Ittishree, Manikandan, P., Singh, R., & Zargar, A. A. (2026) · Clinical Nutrition ESPEN · doi:10.1016/j.clnesp.2026.103279 · Cited by 4
The Gut Microbiota as a Mediator Linking the MIND Diet to Alzheimer’s Disease
Ramezani, F., Herfeh, S. S., & Burke, E. (2026) · Nutrients · doi:10.3390/nu18091445 · Cited by 4
The gut–bone axis: microbial metabolism and nutritional interventions for bone health
Rodriguez-Bryant, A., Papageorgiou, M., Horcajada, M.-N., Biver, E., Ferrari, S., & Bonnet, N. (2026) · Gut Microbes · doi:10.1080/19490976.2026.2675093 · Cited by 6
Zapico, A., Arboleya, S., Salazar, N., Perillán, C., Ruiz-Saavedra, S., Reyes‐Gavilán, C. G. D. L., Gueimonde, M., & González, S. (2023) · Nutrients · doi:10.3390/nu15163537 · Cited by 5
Cianciosi, D., Díaz, Y. A., Grosso, G., Quiles, J. L., Giampieri, F., & Battino, M. A. (2023) · Current Opinion in Food Science · doi:10.1016/j.cofs.2023.101109 · Cited by 4
Yang, Y., Wang, X., & Yang, W. (2024) · Journal of Dairy Science · doi:10.3168/jds.2024-25585 · Cited by 4
Dicks, L. M. T. (2025) · International Journal of Molecular Sciences · doi:10.3390/ijms26189052 · Cited by 5
Mediterranean Diet—A Healthy Dietary Pattern and Lifestyle for Strong Immunity
Petkoska, A. T., & Trajkovska‐Broach, A. (2021) · Infosys science foundation series · doi:10.1007/978-981-16-2450-6_13 · Cited by 6
Peanut supplementation affects compositions and functions of gut microbiome in Ugandan children
Wang, J.-S., Xue, K. S., Li, Z., Ssempebwa, J. C., Maina, G. W., Musinguzi, G., Rhoads, J., Hoisington, D. A., & Tang, L. (2024) · Food & Function · doi:10.1039/d3fo04645a · Cited by 4
Ilari, S., Nucera, S., Morabito, L., Caminiti, R., Mazza, V., Ritorto, G., Ussia, S., Passacatini, L. C., Macrì, R., Scarano, F., et al. (2024) · Nutrients · doi:10.3390/nu16213591 · Cited by 4
Charneca, S., Hernando, A. J. B., Almada-Correia, I., Pereira, J. P., Vieira, A. A., Sousa, J., Almeida, A. S., Motta, C., Barreto, G., Eklund, K. K., et al. (2025) · Nutrition Journal · doi:10.1186/s12937-025-01089-6 · Cited by 5
Gut microbiota dysbiosis: the hidden roles in human aging and age-related diseases
Zhan, Y., Su, W., & Liu, X. (2025) · Oral Science and Homeostatic Medicine · doi:10.26599/oshm.2025.9610012 · Cited by 4
Mechanisms of Gut Microbiota Modulation by Food, Probiotics, Prebiotics and More
Molinero, N., Sabater, C., Calvete‐Torre, I., Delgado, S., Ruas‐Madiedo, P., Ruíz, L., & Margollés, A. (2021) · Elsevier eBooks · doi:10.1016/b978-0-12-819265-8.00095-4 · Cited by 4
Elsner, F., Matthiessen, L. E., Średnicka-Tober, D., Marx, W., O'Neil, A. E., Welch, A. A., Hayhoe, R. P. G., Higgs, S., van Vliet, M., Morphew-Lu, E., et al. (2022) · International Journal of Environmental Research and Public Health · doi:10.3390/ijerph20010669 · Cited by 4
Modulating the gut microbiome with dietary interventions to reduce cardiometabolic disease risk
Liuzzo, G., & Galiuto, L. (2021) · European Heart Journal · doi:10.1093/eurheartj/ehab261 · Cited by 4
Creedon, A. C., Bernard, H., Amati, F., Segata, N., Wallace, S. M., Arrè, A., Smith, H., Platts, A., Bulsiewicz, W. J., Bermingham, K. M., et al. (2024) · medRxiv · doi:10.1101/2024.07.02.24309816 · Cited by 4
Koutelidakis, A. Ε., Elmaliklis, I.-N., & Konteles, S. J. (2021) · Current Nutrition & Food Science · doi:10.2174/1573401317666210902122957 · Cited by 3
Myhrstad, M. C. W., Ruud, E., Gaundal, L., Gjøvaag, T. F., Rud, I., Retterstøl, K., Ulven, S. M., Holven, K. B., Koehler, K., & Telle‐Hansen, V. H. (2024) · Frontiers in Nutrition · doi:10.3389/fnut.2024.1438876 · Cited by 3
Metadata
- Authors
- Meslier, V., Laiola, M., Roager, H. M., De Filippis, F., Roume, H., Quinquis, B., Giacco, R., Mennella, I., Ferracane, R., Pons, N., Pasolli, E., Rivellese, A., Dragsted, L. O., Vitaglione, P., Ehrlich, S. D., & Ercolini, D.
- Affiliations
- Université Paris-Saclay (FR)
- University of Naples Federico II (IT)
- University of Copenhagen (DK)
- Department of Agricultural Sciences, University of Naples Federico II, Portici, Italy
- Université Paris-Saclay, INRAE, MGP, Jouy-en-Josas, France
- Institute of Food Science (IT)
- Federico II University Hospital (IT)
- Corresponding author
- Ercolini, Danilo
- ORCID
- Venue
- Gut
- Publisher
- BMJ
- Published
- 2020-02-19
- Volume
- 69
- Issue
- 7
- Pages
- 1258-1268
- ISSN
- 0017-5749 (ISSN-L)
- 1468-3288
- PMC
- PMC7306983
- OpenAlex
- W3007138124
- Cited by
- 583
- References
- 69
- Citations by year
- 2026: 67 · 2025: 116 · 2024: 118 · 2023: 87 · 2022: 85 · 2021: 73 · 2020: 36
- FWCI
- 23.17
- Type
- journal article
- Language
- en
- Open access
- hybrid
- doi.org
- Licence
- Locations
- Gut (publishedVersion, cc-by-nc)
- PubMed Central (publishedVersion, cc-by-nc)
- PubMed (publishedVersion)
- Research at the University of Copenhagen (University of Copenhagen) (publishedVersion, cc-by-nc)
- HighWire Press Open Archive (submittedVersion)
- INFM-OAR (INFN Catania) (submittedVersion, cc-by-nc)
- Funders
- Agence Nationale de la Recherche (ANR-11-DPBS-0001, ANR-15-HDIM-0002)
- Agria Djurförsäkring
- Topics
- Life Sciences › Biochemistry, Genetics and Molecular Biology › Molecular Biology › Gut microbiota and health
- Health Sciences › Medicine › Public Health, Environmental and Occupational Health › Nutritional Studies and Diet
- Life Sciences › Biochemistry, Genetics and Molecular Biology › Genetics › Nutrition, Genetics, and Disease
- Keywords
- Mediterranean diet, overweight, obesity, serum cholesterol, gut microbiota, metabolome, isocaloric diet, dietary adherence, Faecalibacterium prausnitzii, butyrate metabolism, bile acids, urolithins, insulin sensitivity, systemic inflammation, dietary fiber, L-carnitine, metabolic health
- MeSH terms
- Gastrointestinal Microbiome, Adult, Energy Intake, Cholesterol, Female, Humans, Male, Obesity, Diet, Mediterranean, Overweight, Metabolome
About these checks
Registry, retraction, Cites and statistics results are computed, not judged, with one exception: a printed reference that no index lists is read once by a model before it counts as a citation error. Claims are extracted by a model and kept only when their quote appears verbatim in the text; each cited source is then checked, with a model’s help, for whether it says what the claim relies on. Those verdicts can be wrong — read the claim’s quote and the cited source before relying on one.
Statistics and arithmetic are recomputed, not judged.
Confidence bands are shown only for fields calibrated on our annotated test set. None is calibrated yet, so no band is shown.
What counts as a claim ›How we measure confidence ›How we check this ›
Are you an author, or do you see a problem with this page? Request a review
