

The DOI matches its Crossref record; 12 of the 12 references it cites were found in a registry or an index.
Transcript length bias in RNA-seq data confounds systems biology
Open accessAbstract
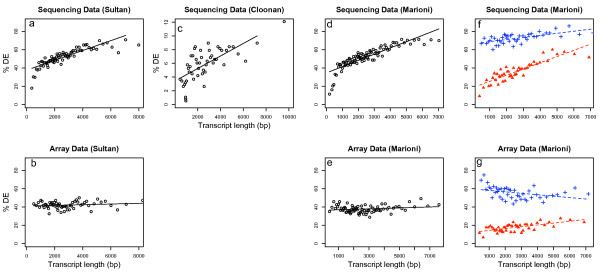
BACKGROUND: Several recent studies have demonstrated the effectiveness of deep sequencing for transcriptome analysis (RNA-seq) in mammals. As RNA-seq becomes more affordable, whole genome transcriptional profiling is likely to become the platform of choice for species with good genomic sequences. As yet, a rigorous analysis methodology has not been developed and we are still in the stages of exploring the features of the data. RESULTS: We investigated the effect of transcript length bias in RNA-seq data using three different published data sets. For standard analyses using aggregated tag counts for each gene, the ability to call differentially expressed genes between samples is strongly associated with the length of the transcript. CONCLUSION: Transcript length bias for calling differentially expressed genes is a general feature of current protocols for RNA-seq technology. This has implications for the ranking of differentially expressed genes, and in particular may introduce bias in gene set testing for pathway analysis and other multi-gene systems biology analyses. REVIEWERS: This article was reviewed by Rohan Williams (nominated by Gavin Huttley), Nicole Cloonan (nominated by Mark Ragan) and James Bullard (nominated by Sandrine Dudoit).
Overview
The claims and statistics of this paper haven’t been checked yet.
Run the check — free, no account needed. It reads the open-access text and checks the sources it cites.
Integrity signals
Registry
Cites
Statistics
Figures
Verification
Claims the paper makes
The claims and statistics of this paper haven’t been checked yet.
Run the check — free, no account needed. It reads the open-access text and checks the sources it cites.
Claims other papers make about this one
Each is checked against this paper’s own text: does it say what the citing paper says it does?
In the citing paper
“It should be noted that these estimates apply to the average gene expression level, but as dynamic ranges in RNA-seq data are large, the probability that highly expressed genes will be detected as differentially expressed is greater than that for low-count genes [192].”
From A survey of best practices for RNA-seq data analysis (2016) · cites this paper as [192]
Self-check
Percentages, sums and reported differences re-computed from the paper’s own numbers.
The self-check needs the paper’s full text.
Citations
Cites
Systematic and integrative analysis of large gene lists using DAVID bioinformatics resources
Huang, D. W., Sherman, B. T., & Lempicki, R. A. (2009) · Nature Protocols · doi:10.1038/nprot.2008.211 · Cited by 35,890 · cited 1×
“In each analysis we only used genes found on both platforms and then performed a pathway analysis using the DAVID software [7,8].”
MethodHuang, D. W., Sherman, B. T., & Lempicki, R. A. (2009) · Nucleic Acids Research · doi:10.1093/nar/gkn923 · Cited by 14,108 · cited 1×
“In each analysis we only used genes found on both platforms and then performed a pathway analysis using the DAVID software [7,8].”
MethodSmyth, G. K. (2004) · Statistical Applications in Genetics and Molecular Biology · doi:10.2202/1544-6115.1027 · Cited by 11,829
Exploration, normalization, and summaries of high density oligonucleotide array probe level data
Irizarry, R. A. (2003) · Biostatistics · doi:10.1093/biostatistics/4.2.249 · Cited by 10,603 · cited 1×
“array algorithm [9] but this suggestion requires further exploration and analysis.”
MethodAlternative isoform regulation in human tissue transcriptomes
Wang, E. T., Sandberg, R., Luo, S., Khrebtukova, I., Zhang, L., Mayr, C., Kingsmore, S. F., Schroth, G. P., & Burge, C. B. (2008) · Nature · doi:10.1038/nature07509 · Cited by 5,181
The Significance of Digital Gene Expression ProfilesPreprint
Audic, S., & Claverie, J. (1997) · Genome Research · doi:10.1101/gr.7.10.986 · Cited by 2,787 · cited 1×
“They then used a method based on the proportion of counts from each library proposed by Audic and Claverie [11] to determine the significant of differential expression.”
MethodRNA-seq: An assessment of technical reproducibility and comparison with gene expression arrays
Marioni, J. C., Mason, C. E., Mane, S. M., Stephens, M., & Gilad, Y. (2008) · Genome Research · doi:10.1101/gr.079558.108 · Cited by 2,771 · cited 7×
“For the data from Marioni et al (2008) genes were matched between the RNA-seq platform and the microarray platform.”
BackgroundMethodInfluentialSultan, M., Schulz, M. H., Richard, H., Magen, A., Klingenhoff, A., Scherf, M., Seifert, M., Borodina, T., Soldatov, A., Parkhomchuk, D., et al. (2008) · Science · doi:10.1126/science.1160342 · Cited by 1,293 · cited 3×
“The first data set compares sequencing from the Illumina Genome Analyzer with Illumina microarrays and looks for differential expression between a human embryonic kidney and B cell line [4].”
BackgroundMethodStem cell transcriptome profiling via massive-scale mRNA sequencing
Cloonan, N., Forrest, A. R. R., Kolle, G., Gardiner, B. B. A., Faulkner, G. J., Brown, M. K., Taylor, D. F., Steptoe, A. L., Wani, S., Bethel, G., et al. (2008) · Nature Methods · doi:10.1038/nmeth.1223 · Cited by 1,035 · cited 4×
“…a predictable consequence of the sampling process and cannot be corrected by dividing by length of the transcript (e.g. the statistical methods in Cloonan et al (2008) or Sultan et al. Differential expression as a function of transcript lengthFigu 1 Differential expression as a function of…”
MethodInfluentialStochastic Models Inspired by Hybridization Theory for Short Oligonucleotide Arrays
Wu, Z. J., & Irizarry, R. A. (2005) · Journal of Computational Biology · doi:10.1089/cmb.2005.12.882 · Cited by 266 · cited 1×
“By contrast, intensity measurements from microarrays are proportional only to the expression level of the transcript plus any features intrinsic to the probe itself such as GC content [2,3].”
Background
Cited by
Sorted by citations
Items 201–300 of 497
Li, Q., Schissler, A. G., Gardeux, V., Achour, I., Kenost, C., Berghout, J., Li, H., Zhang, H. H., & Lussier, Y. A. (2017) · BMC Medical Genomics · doi:10.1186/s12920-017-0263-4 · Cited by 30
Bias and Correction in RNA-seq Data for Marine Species
Song, K., Li, L., & Zhang, G. (2017) · Marine Biotechnology · doi:10.1007/s10126-017-9773-5 · Cited by 26
“Oshlack and Wakefield (2009) identified transcript length biases in RNA-seq data.”
Flimma: a federated and privacy-aware tool for differential gene expression analysis
Zolotareva, O. I., Nasirigerdeh, R., Matschinske, J., Torkzadehmahani, R., Bakhtiari, M., Frisch, T., Späth, J., Blumenthal, D. B., Abbasinejad, A., Tieri, P., et al. (2021) · Genome biology · doi:10.1186/s13059-021-02553-2 · Cited by 31
“count-based measurement, and their results subject to platform-specific biases [1, 2].”
BackgroundTrakhtenberg, E. F., Pita‐Thomas, W., Fernandez, S. G., Patel, K. H., Venugopalan, P., Shechter, J. M., Morkin, M. I., Galvão, J., Liu, X., Dombrowski, S. M., et al. (2016) · Developmental Neurobiology · doi:10.1002/dneu.22391 · Cited by 28
A Joint Bayesian Model for Integrating Microarray and RNA Sequencing Transcriptomic Data
Ma, T., Liang, F., Oesterreich, S., & Tseng, G. C. (2017) · Journal of Computational Biology · doi:10.1089/cmb.2017.0056 · Cited by 28
“Due to the random RNA fragmentation and sampling nature in RNA-seq, transcript length bias is inherent to the RNA-seq studies where short transcripts with less mapped reads are usually at a statistical disadvantage relative to long transcripts in the same sample (Oshlack et al., 2009).”
BackgroundBioinformatic analysis of bacteria and host cell dual RNA-sequencing experiments
Marsh, J. W., Hayward, R. J., Shetty, A. C., Mahurkar, A., Humphrys, M. S., & Myers, G. S. A. (2017) · Briefings in Bioinformatics · doi:10.1093/bib/bbx043 · Cited by 29
Comparative evaluation of gene set analysis approaches for RNA-Seq data
Rahmatallah, Y., Emmert‐Streib, F., & Glazko, G. V. (2014) · BMC Bioinformatics · doi:10.1186/s12859-014-0397-8 · Cited by 29
“Oshlack A, Wakefield MJ: Transcript length bias in RNA-seq data confounds systems biology.”
BackgroundPredicting Response to Histone Deacetylase Inhibitors Using High-Throughput Genomics
Geeleher, P., Loboda, A. P., Lenkala, D., Wang, F., LaCroix, B. L., Karovic, S., Wang, J., Nebozhyn, M., Chisamore, M. J., Hardwick, J. S., et al. (2015) · JNCI Journal of the National Cancer Institute · doi:10.1093/jnci/djv247 · Cited by 26
“Significance was estimated using a robust (24,25) permutation-based approach.”
MethodEndocrine regulation of predator-induced phenotypic plasticity
Dennis, S. R., LeBlanc, G. A., & Beckerman, A. P. (2014) · Oecologia · doi:10.1007/s00442-014-3102-8 · Cited by 26
“…transcripts of interest, and matching amplification efficiencies, amplicon length and GC content, whole-transcript suffers from inherent biases in sequencing due to transcript length (Oshlack and Wakefield 2009), composition and overrepresentation of highly abundant transcripts (Young et al. 2010).”
BackgroundTranscriptome dynamics-based operon prediction in prokaryotes
Fortino, V., Smolander, O., Auvinen, P., Tagliaferri, R., & Greco, D. (2014) · BMC Bioinformatics · doi:10.1186/1471-2105-15-145 · Cited by 27
“In order to evaluate the performance of our method, we tested it on different RNA-seq datasets [14,15,35] of four different species of bacteria (see Tables 1 and 2).”
MethodResultInfluentialUsing singscore to predict mutation status in acute myeloid leukemia from transcriptomic signatures
Bhuva, D. D., Foroutan, M., Xie, Y., Lyu, R., Cursons, J., & Davis, M. J. (2019) · F1000Research · doi:10.12688/f1000research.19236.2 · Cited by 28
Massively parallel characterization of engineered transcript isoforms using direct RNA sequencing
Tarnowski, M. J., & Gorochowski, T. E. (2022) · Nature Communications · doi:10.1038/s41467-022-28074-5 · Cited by 26
Mamo, S., Rizos, D. V., & Lonergan, P. (2012) · Animal Reproduction Science · doi:10.1016/j.anireprosci.2012.08.011 · Cited by 26
Differential gene expression analysis using coexpression and RNA-Seq data
Yang, E.-W., Girke, T., & Jiang, T. (2013) · Bioinformatics · doi:10.1093/bioinformatics/btt363 · Cited by 27
miRNA-Seq normalization comparisons need improvement
Zhou, X., Oshlack, A., & Robinson, M. D. (2013) · RNA · doi:10.1261/rna.037895.112 · Cited by 26
Self-citationTranscriptomic Profiling Using Next Generation Sequencing - Advances, Advantages, and Challenges
Anamika, K., Verma, S. P., Jere, A., & Desai, A. (2016) · InTech eBooks · doi:10.5772/61789 · Cited by 32
Ballerini, E. S., Kramer, E. M., & Hodges, S. A. (2019) · BMC Genomics · doi:10.1186/s12864-019-6002-9 · Cited by 26
“Gene ontology (GO) enrichment Tests for GO enrichment were conducted using the R package goseq which considers gene length bias when determining significance of GO over-representation [16, 30].”
MethodRNA-Seq and find: entering the RNA deep field
Roberts, A., & Pachter, L. S. (2011) · Genome Medicine · doi:10.1186/gm290 · Cited by 25
“However, this advantage of RNA-Seq has also been its Achilles heel: transcriptomes are dominated by few highly abundant transcripts, and the frequent sampling of such transcripts in proportion to their abundances and lengths reduces the power to detect transcripts that are rare or short [4].”
BackgroundLee, H., Chu, K., Moon, E., & Quan, F. (2021) · Journal of Cancer · doi:10.7150/jca.60027 · Cited by 25
“In comparison to the standard RNAseq, MACE is a more powerful method for analyzing differential gene expressions and less susceptible to transcript length and degradation bias [22].”
MethodCharacterization of FUS Mutations in Amyotrophic Lateral Sclerosis Using RNA-Seq
van Blitterswijk, M., Wang, E. T., Friedman, B. A., Keagle, P. J., Lowe, P., LeClerc, A. L., van den Berg, L. H., Housman, D. E., Veldink, J. H., & Landers, J. E. (2013) · PLoS ONE · doi:10.1371/journal.pone.0060788 · Cited by 26
“For RNASeq data a potential length-dependent bias has to be considered as well [18].”
Gaio, D., DeMaere, M. Z., Anantanawat, K., Chapman, T. A., Djordjevic, S. P., & Darling, A. E. (2021) · Microbial Genomics · doi:10.1099/mgen.0.000501 · Cited by 27
Comparative Analysis of Single-Cell RNA Sequencing Platforms and Methods
Ashton, J. M., Rehrauer, H., Myers, J. R., Myers, J., Zanche, M., Balys, M., Foox, J., Mason, C. E., Steen, R. G., Kuentzel, M. L., et al. (2021) · Journal of Biomolecular Techniques JBT · doi:10.7171/3fc1f5fe.3eccea01 · Cited by 24
Cell types differ in global coordination of splicing and proportion of highly expressed genes
Trakhtenberg, E. F., Pho, N. H., Holton, K. M., Chittenden, T. W., Goldberg, J. L., & Dong, L. (2016) · Scientific Reports · doi:10.1038/srep32249 · Cited by 24
Stahl, F., Hitzmann, B., Mutz, K.-O., Landgrebe, D., Lübbecke, M., Kasper, C., Walter, J., & Scheper, T. H. (2011) · Springer eBooks · doi:10.1007/10_2011_102 · Cited by 25
Identification and characterization of microRNA sequences from bovine mammary epithelial cells
Bu, D., Nan, X., WANG, F.-Y., Loor, J. J., & Wang, J. (2015) · Journal of Dairy Science · doi:10.3168/jds.2014-8217 · Cited by 23
Eilertsen, I. A., Moosavi, S. H., Strømme, J. M., Nesbakken, A., Johannessen, B., Lothe, R. A., & Sveen, A. (2019) · Cancer Letters · doi:10.1016/j.canlet.2019.10.040 · Cited by 23
Rodríguez-Esteban, G., González-Sastre, A., Rojo-Laguna, J. I., Saló, E., & Abril, J. F. (2015) · BMC Genomics · doi:10.1186/s12864-015-1533-1 · Cited by 23
“Up to eight versions of the transcriptome for this organism have been published to date, making use of different RNA-Seq technologies [10-16], including one meta-assembly which slightly improves each one separately [17].”
BackgroundInfluentialYoon, S., & Nam, D. (2017) · BMC Genomics · doi:10.1186/s12864-017-3809-0 · Cited by 23
“Previous studies have reported a bias in differential analysis of RNA-seq count data regarding gene length (or read count) and its effect on GO analysis [15, 16].”
BackgroundInfluentialRNA-seq Using Next Generation Sequencing
Corney, D. C. (2013) · Materials and Methods · doi:10.13070/mm.en.3.203 · Cited by 25
On Differential Gene expression Using RNA-Seq Data
Lee, J. H., Ji, Y., Liang, S., Cai, G., & Müller, P. (2011) · Cancer Informatics · doi:10.4137/cin.s7473 · Cited by 22
An integrative method to normalize RNA-Seq data
Filloux, C., Meersseman, C., Philippe, R., Forestier, L., Klopp, C., Rocha, D., Maftah, A. A., & Daniel, P. T. (2014) · BMC Bioinformatics · doi:10.1186/1471-2105-15-188 · Cited by 24
“In the second one, size classes are built irrespective of the number of genes per class [4], leading to an increasing dispersion for the classes of higher sizes (mainly due to lower number of genes).”
BackgroundTranscriptome size matters for single-cell RNA-seq normalization and bulk deconvolution
Lu, S., Yang, J., Yan, L., Liu, J., Wang, J. J., Jain, R., & Yu, J. (2025) · Nature Communications · doi:10.1038/s41467-025-56623-1 · Cited by 21
Semiparametric maximum likelihood inference for truncated or biased-sampling data
Ning, J., Qin, J., & Shen, Y. (2015) · Statistica Sinica · doi:10.5705/ss.2014.094 · Cited by 21
GScluster: network-weighted gene-set clustering analysis
Yoon, S., Kim, J., Kim, S., Baik, B., Chi, S.-M., Kim, S., & Nam, D. (2019) · BMC Genomics · doi:10.1186/s12864-019-5738-6 · Cited by 20
Evidence classification of high-throughput protocols and confidence integration in RegulonDB
Weiss, V., Medina-Rivera, A., Huerta, A. M., Santos-Zavaleta, A., Salgado, H., Morett, E., & Collado‐Vides, J. (2013) · Database · doi:10.1093/database/bas059 · Cited by 20
“Such non-uniform read distributions occur during the random hexamer priming and PCR amplification step, due to positional nucleotide biases, GC content (31,52), and transcript length biases (53,54).”
BackgroundSilveira, G. O., Amaral, M. S., Coelho, H. S., Maciel, L. F., Pereira, A. S. A., Olberg, G. G. D. O., Miyasato, P. A., Nakano, E., & Verjovski‐Almeida, S. (2021) · Scientific Reports · doi:10.1038/s41598-021-96055-7 · Cited by 19
Coates, B. S., Walden, K. K. O., Lata, D., Vellichirammal, N. N., Mitchell, R. F., Andersson, M. N., McKay, R., Lorenzen, M. D., Grubbs, N., Wang, Y.-H., et al. (2023) · BMC Genomics · doi:10.1186/s12864-022-08990-y · Cited by 19
“Gene Ontology (GO) enrichment analyses were performed on the differentially-expressed genes using the R Bioconductor package goseq [203], which takes length bias into account when performing analysis [57].”
MethodRNA-seq Using Next Generation Sequencing
Corney, D. C. (2012) · Materials and Methods · doi:10.13070/mm.en.2.203 · Cited by 21
Sequencing transcriptomes in toto
Kassahn, K. S., Waddell, N., & Grimmond, S. M. (2011) · Integrative Biology · doi:10.1039/c0ib00062k · Cited by 21
Schmitz, U., Naderi‐Meshkin, H., Gupta, S. K., Wolkenhauer, O., & Vera, J. (2015) · Briefings in Bioinformatics · doi:10.1093/bib/bbv061 · Cited by 20
Strategies for Taxonomic and Functional Annotation of Metagenomes
Bengtsson‐Palme, J. (2017) · Elsevier eBooks · doi:10.1016/b978-0-08-102268-9.00003-3 · Cited by 20
CNVkit-RNA: Copy number inference from RNA-Sequencing dataPreprint
Talevich, E., & Shain, A. H. (2018) · bioRxiv (Cold Spring Harbor Laboratory) · doi:10.1101/408534 · Cited by 19
Deep learning explains the biology of branched glycans from single-cell sequencing data
Qin, R., Mahal, L. K., & Bojar, D. (2022) · iScience · doi:10.1016/j.isci.2022.105163 · Cited by 19
“Traditionally, these were identified by differential expression analysis (DEA), which is (i) prone to information loss due to arbitrariness regarding p-value and fold change thresholds (Bui et al., 2020; Yang et al., 2019) and (ii) biased towards highly expressed genes (Oshlack and Wakefield, 2009).”
Data Mining of Microarray Datasets in Translational Neuroscience
O’Connor, L. M., O’Connor, B. A., Zeng, J., & Lo, C. H. (2023) · Brain Sciences · doi:10.3390/brainsci13091318 · Cited by 20
Comparative studies of differential gene calling using RNA-Seq data
Zheng, X., & Moriyama, E. N. (2013) · BMC Bioinformatics · doi:10.1186/1471-2105-14-s13-s7 · Cited by 19
“, using RPKM (reads per kilobase of exon model per million mapped reads) [3], the length bias may still persist in differential gene-calling [4].”
BackgroundMethodPractical aspects of NGS-based pathways analysis for personalized cancer science and medicine
Kotelnikova, E. A., Pyatnitskiy, M. A., Paleeva, A. G., Kremenetskaya, O. S., & Vinogradov, D. V. (2016) · Oncotarget · doi:10.18632/oncotarget.9370 · Cited by 19
“A similar effect is present in the analysis of differential expression of RNASeq data: longer transcripts generate a greater number of reads and are more likely to be detected as differentially expressed compared with their short counterparts [179].”
BackgroundTong, W., Kwon, S., Lee, J., Choi, I., Park, Y., Choi, S. H., Jin, K., Kim, B. W., & Lee, J. K. (2015) · Gene · doi:10.1016/j.gene.2015.01.028 · Cited by 19
Classification of RNA-seq Data
Tan, K. M., Petersen, A. J., & Witten, D. (2014) · Springer eBooks · doi:10.1007/978-3-319-07212-8_11 · Cited by 18
The Role of Spike-In Standards in the Normalization of RNA-seq
Risso, D., Ngai, J., Speed, T. P., & Dudoit, S. (2014) · Springer eBooks · doi:10.1007/978-3-319-07212-8_9 · Cited by 18
Statistical Issues in the Analysis of ChIP-Seq and RNA-Seq Data
Ghosh, D., & Qin, Z. S. (2010) · Genes · doi:10.3390/genes1020317 · Cited by 18
“This is investigated nicely by Oshlack and Wakefield [104] and Young et al.”
MethodInfluentialMilc, J. A., Bagnaresi, P., Aragona, M., Valente, M. T., Biselli, C., Infantino, A., Francia, E., & Pecchioni, N. (2019) · Functional & Integrative Genomics · doi:10.1007/s10142-019-00685-0 · Cited by 18
RNA-Seq is not required to determine stable reference genes for qPCR normalization
Sampathkumar, N. K., Sundaram, V. K., Danthi, P. S., Barakat, R., Solomon, S., Mondal, M., Carre, I., Jalkh, T. E., Padilla-Ferrer, A., Grenier, J., et al. (2022) · PLoS Computational Biology · doi:10.1371/journal.pcbi.1009868 · Cited by 17
Next-Generation Sequencing in Medicinal Plants: Recent Progress, Opportunities, and Challenges
Singh, D., Mathur, S., Prasad, M., & Ranjan, R. (2024) · Journal of Plant Growth Regulation · doi:10.1007/s00344-024-11238-6 · Cited by 17
“…for mapping cDNA reads to the genome and eliminating low-quality sequences in addition to storage space (Jiang and Wong 2009; Marioni et al. 2008; Oshlack and Wakefield 2009). cDNA reads with repeated sequences and homopoly-mers at the 5 ′ and 3 ′ ends can complicate 5 ′ RACE (rapid…”
Normalization of RNA-Seq data using adaptive trimmed mean with multi-reference
Singh, V., Kirtipal, N., Song, B., & Lee, S. (2024) · Briefings in Bioinformatics · doi:10.1093/bib/bbae241 · Cited by 19
“The raw read counts have a different source of systematic variation, which includes differences between samples, such as library size [4] or differences within samples, gene length [5] and guanine–cytosine (GC)content[6].”
BackgroundLenz, M., Schuldt, B. M., Müller, F.-J., & Schuppert, A. (2013) · PLoS ONE · doi:10.1371/journal.pone.0077627 · Cited by 17
“Processing pipelines and normalization for next-generation sequencing data is an active field of development and all count based methods introduce bias through low counts and different transcript lengths [45] PhysioSpace”
MethodDeep Sequencing of Cardiac MicroRNA-mRNA Interactomes in Clinical and Experimental Cardiomyopathy
Matkovich, S. J., & Dorn, G. W. (2015) · Methods in molecular biology · doi:10.1007/978-1-4939-2572-8_3 · Cited by 17
“The calculation of gene expression values (with or without provision for determining isoform fractions and/or new alternatively-spliced transcripts) and the use of normalization procedures to compensate for differences library sequencing depth and/or gene length [37,38] has been the subject of much discussion.”
BackgroundSholder, G., Lanz, T. A., Moccia, R., Quan, J., Aparicio-Prat, E., Stanton, R. V., & Xi, H. S. (2020) · BMC Genomics · doi:10.1186/s12864-020-6478-3 · Cited by 16
Karlebach, G., Hansen, P., Veiga, D. F. T., Steinhaus, R., Daniš, D., Li, S., Anczuków, O., & Robinson, P. N. (2020) · Genome biology · doi:10.1186/s13059-020-02072-6 · Cited by 19
“Moreover, variation of gene expression can be affected by expression level [14], and similarly, variation of isoform expression is affected by isoform level.”
BackgroundCalla, B., Blahut‐Beatty, L., Koziol, L., Simmonds, D. H., & Clough, S. J. (2013) · Molecular Plant Pathology · doi:10.1111/mpp.12113 · Cited by 17
“Oshlack and Wakefield (2009) hypothesized that the ability of RNA-seq to detect a differentially regulated transcript depends on the length of the transcript, because this method, which uses RNA fragmentation, will give rise to more reads mapping to a longer transcript than to a shorter one.”
BackgroundLi, J., Varghese, R. S., & Ressom, H. W. (2024) · Methods in molecular biology · doi:10.1007/978-1-0716-3918-4_18 · Cited by 18
RNA Pol IV induces antagonistic parent-of-origin effects on Arabidopsis endosperm
Satyaki, P. R. V., & Gehring, M. A. (2022) · PLoS Biology · doi:10.1371/journal.pbio.3001602 · Cited by 16
“Longer genes have higher sRNA read counts (S8C Fig), and, thus, differences in these genes are more likely be called as statistically significant by DESeq2 [40].”
Klevebring, D., Bjursell, M. K., Emanuelsson, O., & Lundeberg, J. (2010) · PLoS ONE · doi:10.1371/journal.pone.0009762 · Cited by 16
RNA-Seq for Plant Pathogenic Bacteria
Kimbrel, J. A., Di, Y., Cumbie, J. S., & Chang, J. H. (2011) · Genes · doi:10.3390/genes2040689 · Cited by 16
“We note, however, that in the original study, the problem of overdispersion was not well understood and some of the data examples that were characterized did not include biological replicates [65].”
BackgroundResultALPHARMA BEEF CATTLE NUTRITION SYMPOSIUM: Nutrition and the genome1
Neibergs, H. L., & Johnson, K. (2011) · Journal of Animal Science · doi:10.2527/jas.2011-4582 · Cited by 15
Taylor, A., Steinberg, J., Andrews, T. S., & Webber, C. (2014) · Bioinformatics · doi:10.1093/bioinformatics/btu669 · Cited by 14
“Sometimes, experimental biases influence seed-gene selection; for example, when using RNA-sequencing to call differentially expressed genes, there is a length bias towards longer transcripts (Oshlack and Wakefield, 2009).”
BackgroundPires, J. G., da Silva, G. F., Weyssow, T., Conforte, A. J., Pagnoncelli, D., da Silva, F. A. B., & Carels, N. (2021) · Frontiers in Genetics · doi:10.3389/fgene.2021.624259 · Cited by 13
“Normalization of raw read counts account for (i) within-sample effects induced by factors such as coding sequence size (Oshlack and Wakefield, 2009), GC-content (Risso et al., 2011), (ii) between-sample effects such as sequencing depth (total number of molecules sequenced) (Robinson and Oshlack,…”
BackgroundNext generation quantitative genetics in plants
Jiménez‐Gómez, J. M. (2011) · Frontiers in Plant Science · doi:10.3389/fpls.2011.00077 · Cited by 16
“However, these expression units show biases depending on the length, number, abundance of the transcripts present in the samples, or because of technical replication (Oshlack and Wakefield, 2009; Bullard et al., 2010b; Mcintyre et al., 2011).”
BackgroundYuan, Y., Tian, L., Lu, D., & Xu, S. (2015) · Scientific Reports · doi:10.1038/srep07960 · Cited by 14
Skinkyté-Juskiené, R., Kogelman, L. J. A., & Kadarmideen, H. N. (2018) · Current Genomics · doi:10.2174/1389202918666171005095059 · Cited by 15
“p3, was created and used to perform Gene Ontology (GO) and Kyoto Encyclopedia of Genes and Genomes (KEGG) pathway analysis [23], taking length bias into account [24].”
Clustering high-throughput sequencing data with Poisson mixture models
Rau, A., Celeux, G., Martin‐Magniette, M., & Maugis-Rabusseau, C. (2011) · HAL · Cited by 14
MGMR: leveraging RNA-Seq population data to optimize expression estimation
Rozov, R., Halperin, E., & Ron Shamir, A. (2012) · BMC Bioinformatics · doi:10.1186/1471-2105-13-s6-s2 · Cited by 13
“Unfortunately, with any new technology come its limitations, and several studies have pointed out that RNASeq is not immune to bias [4-6].”
BackgroundChaw, R. C., Arensburger, P., Clarke, T. H., Ayoub, N. A., & Hayashi, C. Y. (2016) · Insect Molecular Biology · doi:10.1111/imb.12260 · Cited by 13
“However, normalizing with RPKM can result in greater read count variance between replicates for shorter contigs, and may not be appropriate for comparing gene expression amongst different samples (Oshlack & Wakefield, 2009; Wagner et al., 2012).”
BackgroundAllam, M., Spillings, B. L., Abdalla, H., Mapiye, D. S., Koekemoer, L. L., & Christoffels, A. G. (2016) · Malaria Journal · doi:10.1186/s12936-016-1591-0 · Cited by 13
A Unified Model for Joint Normalization and Differential Gene Expression Detection in RNA-Seq Data
Liu, K., Ye, J., Yang, Y., Shen, L., & Jiang, H. (2018) · IEEE Transactions on Computational Biology and Bioinformatics · doi:10.1109/tcbb.2018.2790918 · Cited by 13
“, TPM (transcript permillion) [13], and RPKM/FPKM (reads/fragments per kilobase of exon per million mapped reads) [1], [2], also correct for difference in gene length within a sample [14].”
A practical introduction to holo-omics
Odriozola, I., Rasmussen, J. A., Gilbert, M. T. P., Limborg, M. T., & Alberdi, A. (2024) · Cell Reports Methods · doi:10.1016/j.crmeth.2024.100820 · Cited by 14
“77 However, inflating the influ-ence of small values through standardization may also increase the influence of the measurement error, which is usually relatively larger for less abundant features.”
BackgroundChen, L. (2012) · Statistics in Biosciences · doi:10.1007/s12561-012-9064-7 · Cited by 14
“Oshlack and Wakefield [35] also observed that the power of differentially expressed gene identification is strongly associated with transcript length, which could affect the downstream pathway analysis.”
BackgroundGene set analysis controlling for length bias in RNA-seq experiments
Ren, X., Hu, Q., Liu, S., Wang, J., & Miecznikowski, J. C. (2017) · BioData Mining · doi:10.1186/s13040-017-0125-9 · Cited by 12
Ranathunge, C., Wheeler, G. L., Chimahusky, M. E., Ng, M. M. K., Morrison, J. I., Baldwin, B. S., Perkins, A., & Welch, M. E. (2018) · Molecular Ecology · doi:10.1111/mec.14522 · Cited by 12
“It has been reported that the detection of differentially expressed genes could be biased by transcript length in RNA-Seq experiments (Oshlack & Wakefield, 2009).”
BackgroundRNA-seq profiling of skin in temperate and tropical cattle
Morenikeji, O. B., Ajayi, O. O., PETERS, S. O., Mujibi, F. D. N., Donato, M. D., Thomas, B. N., & Imumorin, I. G. (2020) · Journal of Animal Science and Technology · doi:10.5187/jast.2020.62.2.141 · Cited by 12
“Differential gene expression analysis Differential gene expression was determined based on the number of reads that aligned to a gene and the length of transcripts [26].”
RNA Sequencing and Quantitation Using the Helicos Genetic Analysis System
Raz, T., Causey, M., Jones, D. R., Kieu, A., Letovsky, S., Lipson, D., Thayer, E. C., Thompson, J. F., & Milos, P. M. (2011) · Methods in molecular biology · doi:10.1007/978-1-61779-089-8_3 · Cited by 12
BayCount: A Bayesian decomposition method for inferring tumor heterogeneity using RNA-Seq counts
Xie, F., Zhou, M., & Xu, Y. (2018) · The Annals of Applied Statistics · doi:10.1214/17-aoas1123 · Cited by 10
Meyer, C. A., Tang, Q., & Liu, X. S. (2012) · Molecular Endocrinology · doi:10.1210/me.2012-1150 · Cited by 11
“Interestingly, this choice has a strong influence on the results, because longer or more abundant transcripts are more likely to be detected as differentially expressed, especially at low sequencing depth (1, 2).”
BackgroundZhao, H., Zhang, G., Pang, L., Lan, Y., Wang, L., Yu, F., Hu, J. R., Li, F., Zhao, T., Xiao, Y., et al. (2016) · Biochimica et Biophysica Acta (BBA) - General Subjects · doi:10.1016/j.bbagen.2016.04.008 · Cited by 11
Gowtham, Y. K., Saski, C. A., & Harcum, S. W. (2017) · Biotechnology Progress · doi:10.1002/btpr.2462 · Cited by 13
“The goseq software accounts for selection bias for long and overexpressed gene sequences by calculating the Probability Weighting Function (PWF).(61) For GO analysis, goseq uses two vectors—one containing all the measured genes and the other containing the differentially expressed genes.”
MethodMembrane gene ontology bias in sequencing and microarray obtained by housekeeping-gene analysis
Zhang, Y., Akintola, O. S., Liu, K. J. A., & Sun, B. (2015) · Gene · doi:10.1016/j.gene.2015.09.041 · Cited by 11
Functional Implications of RNA Splicing for Human Long Intergenic Noncoding RNAs
Chen, F., Pan, C.-L., & Lin, H. (2014) · Evolutionary Bioinformatics · doi:10.4137/ebo.s20772 · Cited by 11
RNA‐Seq Library Construction Methods for Transcriptome Analysis
Bivens, N. J., & Zhou, M. (2016) · Current Protocols in Plant Biology · doi:10.1002/cppb.20019 · Cited by 11
Harrison, J. G., Randolph, G. D., & Buerkle, C. A. (2021) · mSystems · doi:10.1128/msystems.00294-21 · Cited by 12
Using singscore to predict mutations in acute myeloid leukemia from transcriptomic signatures
Bhuva, D. D., Foroutan, M., Xie, Y., Lyu, R., Cursons, J., & Davis, M. J. (2019) · F1000Research · doi:10.12688/f1000research.19236.1 · Cited by 11
DFI: gene feature discovery in RNA-seq experiments from multiple sources
Özer, H. G., Parvin, J. D., & Huang, K. (2012) · BMC Genomics · doi:10.1186/1471-2164-13-s8-s11 · Cited by 11
Transcriptomic analysis of genes: expression and regulation
Horta, M. A. C., Pimenta, R. J. G., Almeida, D. A., Rosolen, R. R., Aono, A. H., Filho, J. A. F., de Oliveira, F. A., Niederauer, G. F., Ferreira, R. C. U., Bajay, S. K., et al. (2022) · Elsevier eBooks · doi:10.1016/b978-0-323-91810-7.00017-0 · Cited by 10
Xu, Z., Platig, J., Lee, S., Boueiz, A. R., Chase, R., Jain, D. S., Gregory, A., Suryadevara, R., Berman, S., Bowler, R. P., et al. (2021) · Genomics · doi:10.1016/j.ygeno.2021.11.004 · Cited by 10
“Transcript length bias in RNA-seq data analysis can arise when statistical power to detect differential expression is greater for longer isoforms, due to the fact that read counts are proportional to not only expression levels but also transcript lengths [38].”
BackgroundNagata, H., Ono, A., Tonosaki, K., Kawakatsu, T., Sato, Y., Yano, K., Kishima, Y., & Kinoshita, T. (2022) · The Plant Journal · doi:10.1111/tpj.15698 · Cited by 10
“…a custom microarray designed to detect transcripts generated from repetitive sequences in rice (Ishiguro et al., 2014), aiming to bypass the limitations associated with short-read sequencing of TEs (Oshlack & Wakefield, 2009), especially for short and high-copy- number elements such as MITEs.”
BackgroundMethodTranscriptomic profiling of trigeminal nucleus caudalis and spinal cord dorsal horn
Kogelman, L. J. A., Elgaard-Christensen, R., Olesen, J., Jansen‐Olesen, I., & Hansen, T. F. (2018) · Brain Research · doi:10.1016/j.brainres.2018.04.037 · Cited by 10
Gildea, M. A., Dwyer, Z. W., & Pleiss, J. A. (2019) · Methods · doi:10.1016/j.ymeth.2019.05.013 · Cited by 10
“Whereas high confidence events that are changed between two samples can often be identified from these data, these events are much more likely to be drawn from highly expressed transcripts because of the lower variance associated with their measurements, introducing selection biases which can dramatically influence th…”
BackgroundRodríguez-López, M. L., Martínez‐Magaña, J. J., Cabrera‐Mendoza, B., Mendoza, A. D. G., García‐Dolores, F., López‐Armenta, M., Flores, G., Vázquez‐Roque, R. A., & Nicolini, H. (2019) · American Journal of Medical Genetics Part B Neuropsychiatric Genetics · doi:10.1002/ajmg.b.32752 · Cited by 10
Young, M. D., McCarthy, D. J., Wakefield, M. J., Smyth, G. K., Oshlack, A., & Robinson, M. D. (2011) · Springer eBooks · doi:10.1007/978-1-4614-0782-9_10 · Cited by 12
Self-citationvan Lingen, H. J., Diez, M. S., & Saccenti, E. (2024) · Biochimica et Biophysica Acta (BBA) - Gene Regulatory Mechanisms · doi:10.1016/j.bbagrm.2024.195058 · Cited by 14
Broumand, A., & Hu, T. (2015) · IEEE Global Conference on Signal and Information Processing · doi:10.1109/globalsip.2015.7418377 · Cited by 8
“Since the number of reads obtained from a gene increases with its transcript length, longer transcripts are more likely to be identified as significantly DE genes [13], [14].”
BackgroundApplication of miRNA-seq in neuropsychiatry: A methodological perspective
Pérez-Rodríguez, D., López-Fernández, H., & Agís‐Balboa, R. C. (2021) · Computers in Biology and Medicine · doi:10.1016/j.compbiomed.2021.104603 · Cited by 10
Metadata
- Authors
- Oshlack, A., & Wakefield, M. J.
- Affiliations
- Walter and Eliza Hall Institute of Medical Research (AU)
- Corresponding author
- Oshlack, Alicia
- Venue
- Biology Direct
- Published
- 2009
- Volume
- 4
- Issue
- 1
- Pages
- 14
- ISSN
- 1745-6150 (ISSN-L)
- PMC
- PMC2678084
- OpenAlex
- W2114504176
- Cited by
- 497
- References
- 12
- Citations by year
- 2026: 6 · 2025: 8 · 2024: 16 · 2023: 14 · 2022: 24 · 2021: 35 · 2020: 12 · 2019: 29 · 2018: 30 · 2017: 36 · 2016: 33 · 2015: 39 · 2014: 39 · 2013: 37 · 2012: 44
- FWCI
- 18.63
- Type
- journal article
- Language
- en
- Open access
- gold
- doi.org
- Licence
- cc-by
- Locations
- Biology Direct (publishedVersion, cc-by)
- PubMed Central (publishedVersion, cc-by)
- PubMed (publishedVersion)
- Minerva Access (University of Melbourne) (submittedVersion, cc-by)
- DOAJ (DOAJ: Directory of Open Access Journals) (submittedVersion)
- Topics
- Life Sciences › Biochemistry, Genetics and Molecular Biology › Molecular Biology › Genomics and Phylogenetic Studies
- Life Sciences › Biochemistry, Genetics and Molecular Biology › Molecular Biology › Gene expression and cancer classification
- Life Sciences › Biochemistry, Genetics and Molecular Biology › Molecular Biology › Bioinformatics and Genomic Networks
- Keywords
- RNA-seq, differentially expressed genes, gene expression profiling, pathway analysis, systems biology
- MeSH terms
- Base Sequence, Humans, RNA, Messenger, Transcription, Genetic, Bias, Oligonucleotide Array Sequence Analysis, Gene Expression Profiling, Systems Biology
About these checks
Registry, retraction, Cites and statistics results are computed, not judged, with one exception: a printed reference that no index lists is read once by a model before it counts as a citation error. Claims are extracted by a model and kept only when their quote appears verbatim in the text; each cited source is then checked, with a model’s help, for whether it says what the claim relies on. Those verdicts can be wrong — read the claim’s quote and the cited source before relying on one.
Statistics and arithmetic are recomputed, not judged.
Confidence bands are shown only for fields calibrated on our annotated test set. None is calibrated yet, so no band is shown.
What counts as a claim ›How we measure confidence ›How we check this ›
Are you an author, or do you see a problem with this page? Request a review
