

The DOI matches its Crossref record; 12 of the 12 references it cites were found in a registry or an index.
Transcript length bias in RNA-seq data confounds systems biology
Open accessAbstract
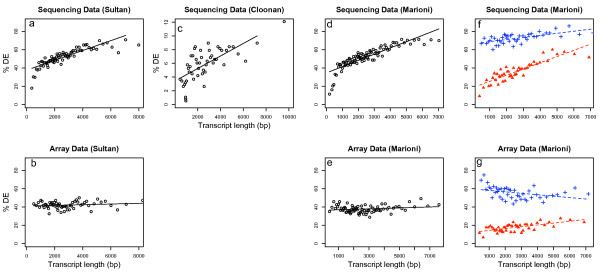
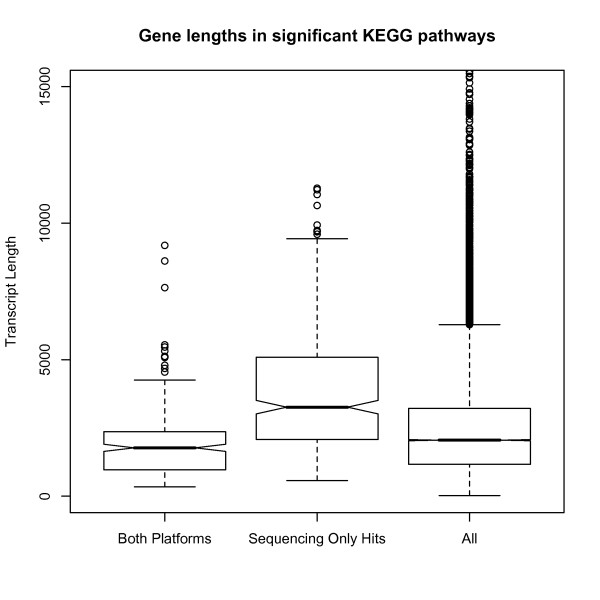
BACKGROUND: Several recent studies have demonstrated the effectiveness of deep sequencing for transcriptome analysis (RNA-seq) in mammals. As RNA-seq becomes more affordable, whole genome transcriptional profiling is likely to become the platform of choice for species with good genomic sequences. As yet, a rigorous analysis methodology has not been developed and we are still in the stages of exploring the features of the data. RESULTS: We investigated the effect of transcript length bias in RNA-seq data using three different published data sets. For standard analyses using aggregated tag counts for each gene, the ability to call differentially expressed genes between samples is strongly associated with the length of the transcript. CONCLUSION: Transcript length bias for calling differentially expressed genes is a general feature of current protocols for RNA-seq technology. This has implications for the ranking of differentially expressed genes, and in particular may introduce bias in gene set testing for pathway analysis and other multi-gene systems biology analyses. REVIEWERS: This article was reviewed by Rohan Williams (nominated by Gavin Huttley), Nicole Cloonan (nominated by Mark Ragan) and James Bullard (nominated by Sandrine Dudoit).
Overview
The claims and statistics of this paper haven’t been checked yet.
Run the check — free, no account needed. It reads the open-access text and checks the sources it cites.
Integrity signals
Registry
Cites
Statistics
Figures
Verification
Claims the paper makes
The claims and statistics of this paper haven’t been checked yet.
Run the check — free, no account needed. It reads the open-access text and checks the sources it cites.
Claims other papers make about this one
Each is checked against this paper’s own text: does it say what the citing paper says it does?
In the citing paper
“It should be noted that these estimates apply to the average gene expression level, but as dynamic ranges in RNA-seq data are large, the probability that highly expressed genes will be detected as differentially expressed is greater than that for low-count genes [192].”
From A survey of best practices for RNA-seq data analysis (2016) · cites this paper as [192]
Self-check
Percentages, sums and reported differences re-computed from the paper’s own numbers.
The self-check needs the paper’s full text.
Citations
Cites
Systematic and integrative analysis of large gene lists using DAVID bioinformatics resources
Huang, D. W., Sherman, B. T., & Lempicki, R. A. (2009) · Nature Protocols · doi:10.1038/nprot.2008.211 · Cited by 35,890 · cited 1×
“In each analysis we only used genes found on both platforms and then performed a pathway analysis using the DAVID software [7,8].”
MethodHuang, D. W., Sherman, B. T., & Lempicki, R. A. (2009) · Nucleic Acids Research · doi:10.1093/nar/gkn923 · Cited by 14,108 · cited 1×
“In each analysis we only used genes found on both platforms and then performed a pathway analysis using the DAVID software [7,8].”
MethodSmyth, G. K. (2004) · Statistical Applications in Genetics and Molecular Biology · doi:10.2202/1544-6115.1027 · Cited by 11,829
Exploration, normalization, and summaries of high density oligonucleotide array probe level data
Irizarry, R. A. (2003) · Biostatistics · doi:10.1093/biostatistics/4.2.249 · Cited by 10,603 · cited 1×
“array algorithm [9] but this suggestion requires further exploration and analysis.”
MethodAlternative isoform regulation in human tissue transcriptomes
Wang, E. T., Sandberg, R., Luo, S., Khrebtukova, I., Zhang, L., Mayr, C., Kingsmore, S. F., Schroth, G. P., & Burge, C. B. (2008) · Nature · doi:10.1038/nature07509 · Cited by 5,181
The Significance of Digital Gene Expression ProfilesPreprint
Audic, S., & Claverie, J. (1997) · Genome Research · doi:10.1101/gr.7.10.986 · Cited by 2,787 · cited 1×
“They then used a method based on the proportion of counts from each library proposed by Audic and Claverie [11] to determine the significant of differential expression.”
MethodRNA-seq: An assessment of technical reproducibility and comparison with gene expression arrays
Marioni, J. C., Mason, C. E., Mane, S. M., Stephens, M., & Gilad, Y. (2008) · Genome Research · doi:10.1101/gr.079558.108 · Cited by 2,771 · cited 7×
“For the data from Marioni et al (2008) genes were matched between the RNA-seq platform and the microarray platform.”
BackgroundMethodInfluentialSultan, M., Schulz, M. H., Richard, H., Magen, A., Klingenhoff, A., Scherf, M., Seifert, M., Borodina, T., Soldatov, A., Parkhomchuk, D., et al. (2008) · Science · doi:10.1126/science.1160342 · Cited by 1,293 · cited 3×
“The first data set compares sequencing from the Illumina Genome Analyzer with Illumina microarrays and looks for differential expression between a human embryonic kidney and B cell line [4].”
BackgroundMethodStem cell transcriptome profiling via massive-scale mRNA sequencing
Cloonan, N., Forrest, A. R. R., Kolle, G., Gardiner, B. B. A., Faulkner, G. J., Brown, M. K., Taylor, D. F., Steptoe, A. L., Wani, S., Bethel, G., et al. (2008) · Nature Methods · doi:10.1038/nmeth.1223 · Cited by 1,035 · cited 4×
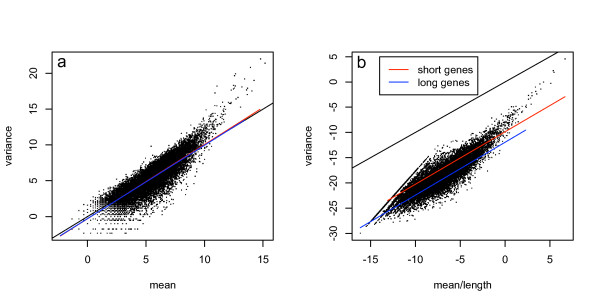
“…a predictable consequence of the sampling process and cannot be corrected by dividing by length of the transcript (e.g. the statistical methods in Cloonan et al (2008) or Sultan et al. Differential expression as a function of transcript lengthFigu 1 Differential expression as a function of…”
MethodInfluentialStochastic Models Inspired by Hybridization Theory for Short Oligonucleotide Arrays
Wu, Z. J., & Irizarry, R. A. (2005) · Journal of Computational Biology · doi:10.1089/cmb.2005.12.882 · Cited by 266 · cited 1×
“By contrast, intensity measurements from microarrays are proportional only to the expression level of the transcript plus any features intrinsic to the probe itself such as GC content [2,3].”
Background
Cited by
Sorted by citations
Items 401–497 of 497
An in silico assessment of alternatively spliced isoforms in the mouse brain using RNA-Seq
Bottomly, D. (2009) · doi:10.6083/m4wd3xjh · Cited by 1
Statistical methods for transcriptomics: From microarrays to RNA-seq
Campos, S. T. (2014) · RiuNet (Universitat Politècnica de València) · doi:10.4995/thesis/10251/48485 · Cited by 1
Kaever, A. (2014) · eDiss (Georg-August-Universität Göttingen) · doi:10.53846/goediss-4813 · Cited by 1
Klevebring, D. (2013) · Springer eBooks · doi:10.1007/978-1-4419-9863-7_101543 · Cited by 1
“However, it can lead to severe effects when, for example, gene set enrichment is performed (Oshlack and Wakefield, 2009).”
BackgroundAntibiotic resistance in the environment: a contribution from metagenomic studies
Bengtsson‐Palme, J. (2016) · Gothenburg University Publications Electronic Archive (Gothenburg University) · Cited by 1
Cherukumalli, N. (2016) · doi:10.18297/etd/2423 · Cited by 1
Guardia, G. D. A. (2016) · Digital Library of Theses and Dissertations (Universidade de São Paulo) · doi:10.11606/t.95.2016.tde-28102016-101702 · Cited by 1
O’Loughlin, A. (2011) · Maynooth University ePrints and eTheses Archive (Maynooth University) · Cited by 1
Assessment of supervised classification methods for the analysis of RNA-seq data
Abuelqumsan, M. (2018) · doi:10.70675/05c649d2zcd6az4432z9e71z2a8a5e89b902 · Cited by 1
RNA-SEQUENCING APPLICATIONS: GENE EXPRESSION QUANTIFICATION AND METHYLATOR PHENOTYPE IDENTIFICATION
Cai, G. (2013) · Digital Commons-TMC (Texas Medical Center)
Complexity of familial amyotrophic lateral sclerosis
van Blitterswijk, M. (2012) · Utrecht University Repository (Utrecht University)
Konkin, D. J. F. (2013) · University Library - University of Saskatchewan (University of Saskatchewan)
Gene Expression Analysis Using RNA-Seq from Organisms Lacking Substantial Genomic Resources
Shen, Y., Garcia, T., & Ronald, B. (2011) · InTech eBooks · doi:10.5772/19790
“One issue deserving special attention is the diminished statistical power one accepts when using RPKM to detect differential expression of longer transcripts (Oshlack and Wakefield, 2009).”
BackgroundTranscriptional regulation of mosquito oogenesis
Jennings, P. D. (2011) · doi:10.31274/etd-180810-1475
Recent Advances in Sequencing Technology
Thompson, J. F., Ozsolak, F., & Milos, P. M. (2012) · Soft and biological matter · doi:10.1007/978-94-007-1226-3_11
“Frequently, the raw expression levels are corrected for length but these corrections are imperfect for many reasons [40] and can lead to analysis issues [41].”
BackgroundData integration for robust network-based disease gene prediction
Östlund, G. (2013) · KTH Publication Database DiVA (KTH Royal Institute of Technology)
Pollo, S. M. J. (2014) · ERA: Education and Research Archive (University of Alberta) · doi:10.7939/r34s1d
Long intergenic non-coding RNA detection benefited from integrative modeling of (Epi)genomic data
Lv, J., Liu, H., & Wu, Q. (2013) · International Conference on Fuzzy Systems and Knowledge Discovery (FSKD) · doi:10.1109/fskd.2013.6816292
NEW APPROACHES IN UNDERSTANDING DRUG METABOLISM
Hart, S. N. (2011) · KU ScholarWorks (University of Kansas)
Accurate Estimation of Isoform and Gene Expression Levels from Next Generation Sequencing Data
Nicolae, M. (2011) · OpenCommons - UConn (University of Connecticut)
Analysis of genomic data as an approach to understanding migration in song birds
Boss, J. (2015) · Figshare
Data- and knowledge-based modeling of gene regulatory networks: an update
Linde, J., Schulze, S., Henkel, S., & Guthke, R. (2015) · EXCLI journal · doi:10.17179/excli2015-168 · Cited by 59
“Pathogen-host GRNs Next Generation Sequencing techniques paved the way for advanced genomic and transcriptomic studies of interacting species, in particular for metagenomic and infection research (Pallen et al., 2010). Dual RNA-Seq is an approach, where transcriptomes of two or more species are sequenced together. Wes…”
BackgroundMaretty, L., Sibbesen, J. A., & Krogh, A. (2014)
Cloud-scale RNA-sequencing differential
Langmead, B., Hansen, K. D., & Leek, J. T. (2010)
Biases in differential expression analysis of RNA-seq data: A matter of replicate typePreprint
Yoon, S., & Nam, D. (2015) · arXiv (Cornell University) · doi:10.48550/arxiv.1508.03719
Methods for accurate analysis of high-throughput transcriptome data.
Howard, B. E. (2011) · NCSU Libraries Repository (North Carolina State University Libraries)
Study of the role of SETD2 mutations in clear cell renal cell carninoma (ccRCC)
de Almeida, C. F. (2013) · Portuguese National Funding Agency for Science, Research and Technology (RCAAP Project by FCT)
Transcriptome variation in breast cancer
Seiler, M. (2012) · Rutgers University Community Repository (Rutgers University) · doi:10.7282/t36q1w0b
High-throughput RNA sequencing: a step forward in transcriptome analysis
Okonechnikov, K. (2016) · Universitätsbibliothek der FU Berlin Hochschulschriftenstelle u. Dokumentenserver · doi:10.17169/refubium-13309
Simultaneous inference for RNA-Seq data
Risso, D. (2012) · Padua Research Archive (University of Padova)
Correction of the Bias Derived from the Number of Exons in Exon-Level Enrichment Analysis
Horyu, D., & Hayashi, T. (2016) · Japanese Journal of Biometrics · doi:10.5691/jjb.36.63
Yang, Y. (2015) · eScholarship (California Digital Library)
Genomic analysis of embryonic heart development in the mouse
Vrljicak, P. (2010) · cIRcle (University of British Columbia) · doi:10.14288/1.0071332
Walsh, S. W., Mehta, J. P., McGettigan, P., Browne, J. A., Forde, N., Alibrahim, R. M., Mulligan, F. J., Loftus, B., Crowe, M. A., Matthews, D., et al. (2012)
An Overview And Comparison of Tools for RNA‐Seq Assembly
Loganantharaj, R., & Randall, T. A. (2016) · doi:10.1002/9781119272182.ch12
Risso, D. (2012)
THE NUANCES OF STATISTICALLY ANALYZING NEXT-GENERATION SEQUENCING DATA
Srivastava, S., & Doerge, R. W. (2012) · Conference on Applied Statistics in Agriculture · doi:10.4148/2475-7772.1038
FUNCTIONAL DIVERGENCE OF DUPLICATED GENES IN THE SOYBEAN GENOME
Auer, P. L., & Doerge, R. W. (2010) · Conference on Applied Statistics in Agriculture · doi:10.4148/2475-7772.1065
“Differences in gene length also complicate analyses of gene sets (Oshlack and Wakefield, 2009).”
BackgroundInvestigation of the role of bovine mammary stem cells in the lactation cycle
Bowman, S. R. A. (2017) · The Sydney eScholarship Repository (The University of Sydney)
Functional Interpretation of High-Throughput Sequencing Data.
Lee, C. K. (2016) · Deep Blue (University of Michigan)
A Birth and Death Model for RNA-Seq Data Analysis
Yan, Z. (2016)
An Overview of RNA-seq Data Analysis
Ferdous, T., & Ullah, M. O. (2017) · Journal of Biology and Life Science · doi:10.5296/jbls.v8i2.11255
Statistical power of gene-set enrichment analysis is a function of gene set correlation structurePreprint
Swanson, D. M. (2017) · bioRxiv (Cold Spring Harbor Laboratory) · doi:10.1101/186288
Practical Data Processing Approach for RNA Sequencing of Microorganisms
Kumagai, T., & Machida, M. (2017) · InTech eBooks · doi:10.5772/intechopen.69157
“Oshlack and Wakefield showed that the power of a t-test of the count data, regardless of whether it is divided by the length of the transcript, is proportional to the square root of the length of the transcript [26].”
BackgroundTrufen, C. E. M. (2018) · Digital Library of Theses and Dissertations (Universidade de São Paulo) · doi:10.11606/d.95.2018.tde-16032018-144403
Sample size calculations and normalization methods for RNA-seq data.
Li, X. (2017) · doi:10.18297/etd/2856
“In addition, it is known that long transcripts will have more reads mapping to it than a shorter transcript of similar expression level within the same sample [62].”
BackgroundMethodNucleic Acids: RNA Identification and Quantification Via Next-Generation Sequencing
Buschmann, D., Kirchner, B., Mussack, V., & Pfaffl, M. W. (2018) · Elsevier eBooks · doi:10.1016/b978-0-12-409547-2.14269-6
Lin, Z. (2016) · ERA: Education and Research Archive (University of Alberta) · doi:10.7939/r3901zw84
Supplementary Methods and Results
Pohl, K., Hayes, E., Keenan, J., Henry, M. A., Meleady, P., Molloy, K., Jundi, B., Bergin, D. A., McCarthy, C., McElvaney, O. J., et al. (2015)
Differential Expression With RNA-Seq Data
Ayala, G., & Gramage, E. G. (2019) · Elsevier eBooks · doi:10.1016/b978-0-08-100596-5.22906-5
Combined Statistics for Differential Expression Analysis of RNA-Sequencing Data
Fanidis, D., & Moulos, P. (2019) · IEEE International Conference on Bioinformatics and Bioengineering (BIBE) · doi:10.1109/bibe.2019.00038
“Last but not least, more studies on the development of PANDORA – like approaches are needed so as to shed light into the unexplored field of DEA combinatorial methods capabilities.”
BackgroundInfluentialDifferential Expression From Microarray and RNA-seq Experiments
Delord, M. (2018) · Elsevier eBooks · doi:10.1016/b978-0-12-809633-8.20211-2
Moreno, N., Howard, L. B., Relyea, S., Dunnigan, J. L., Boyer, M., Kardos, M. D., Glaberman, S. R., Luikart, G., & Chiari, Y. (2021) · doi:10.22541/au.161142130.04599849/v1
Inference of Computational Models of Alternative Polyadenylation and Splicing
Leung, M. K. K. (2018) · TSpace (University of Toronto)
Ogbonna, A. C., Ramu, P., Esuma, W., Nandudu, L., Morales, N., Powell, A. F., Kawuki, R., Bauchet, G. J., Jannink, J., & Mueller, L. A. (2021) · bioRxiv (Cold Spring Harbor Laboratory) · doi:10.1101/2021.09.23.461500
Brown, L. L. (2013) · Summit (Simon Fraser University)
Robinson, P. N., & Bauer, S. (2011) · Chapman & Hall/CRC mathematical and computational biology series · doi:10.1201/b10967-28
Bleidorn, C. (2017) · Springer eBooks · doi:10.1007/978-3-319-54064-1_4
Valenza-Troubat, N. (2021) · Open Access Victoria University of Wellington | Te Herenga Waka (Figshare) · doi:10.26686/wgtn.16698571
Excess ribosomal protein production unbalances translation in Fragile X SyndromePreprint
Seo, S. S., Louros, S. R., Anstey, N. J., Gonzalez‐Lozano, M. A., Harper, C. B., Verity, N., Dando, O., Thomson, S. R., Darnell, J. C., Kind, P. C., et al. (2022) · bioRxiv (Cold Spring Harbor Laboratory) · doi:10.1101/2022.04.07.487442
Evans, D. L. (2021) · bioRxiv (Cold Spring Harbor Laboratory) · doi:10.22541/au.162740437.78291655/v1
Applications of Genomics in Weed Science
Jugulam, M., Gaines, T. A., Tranel, P. J., Fleming, M. B., Patterson, E. L., Küpper, A., Ravet, K., Giacomini, D. A., González, S., & Beffa, R. (2017) · CRC Press eBooks · doi:10.1201/9781315121031-12
Dick, G. J. (2018) · doi:10.1002/9781118708231.ch9
Using genome-wide expression compendia to study microorganisms
Lee, A. J., Reiter, T. E., Doing, G., Oh, J., Hogan, D. A., & Greene, C. S. (2022) · Computational and Structural Biotechnology Journal · doi:10.1016/j.csbj.2022.08.012 · Cited by 1
“length [53], allowing for between sample and gene comparisons.”
BackgroundAlonso-Pernas, P., & Boland, W. (2022) · bioRxiv (Cold Spring Harbor Laboratory) · doi:10.1101/2022.12.01.518689
“Differential gene expression analysis between pocket and hindgut wall libraries was carried out using the R package edgeR (Robinson et al. 2010), using TMM (trimmed mean of M-values) normalized values of read CPM (counts per million) per contig (Oshlack & Wakefield 2009).”
MethodSarmah, D. T., Kumar, S., Chatterjee, S., & Bairagi, N. (2023) · Elsevier eBooks · doi:10.1016/b978-0-323-85713-0.00015-3
Rigor and reproducibility of RNA sequencing analyses
Buschmann, D., Driedonks, T. A. P., Huang, Y., Tosar, J. P., Turchinovich, A. A., & Witwer, K. W. (2024) · Elsevier eBooks · doi:10.1016/b978-0-12-817218-6.00009-7
Functional characterization of long non-coding RNAs in Schistosoma mansoni
Silveira, G. O. (2022) · Digital Library of Theses and Dissertations (Universidade de São Paulo) · doi:10.11606/t.46.2022.tde-07112023-145651
Gustafsson, J., Robinson, J. L., Nielsen, J., & Pachter, L. S. (2021) · Figshare · doi:10.6084/m9.figshare.14752256
A Haloarchaeal Transcriptional Regulator That Represses the Expression of CRISPR-Associated Genes
Turgeman-Grott, I., Shalev, Y., Shemesh, N., Levy, R., Eini, I., Pasmanik‐Chor, M., & Gophna, U. (2024) · Microorganisms · doi:10.3390/microorganisms12091772
“1_ASM540632v1/, accessed on 15 May 2019), followed by RPKM normalization [37].”
MethodIntegrative Bioinformatics: Databases, Web Portals, and Tools
Settino, M., & Cannataro, M. (2024) · Elsevier eBooks · doi:10.1016/b978-0-323-95502-7.00132-9
The offonome reveals on and off states of gene expression near the detection limit of RNA-seq
Choi, W.-Y., Zhao, X., Holt, J. R., Jain, R., Jo, H., Hoadley, K. A., Hayes, D. N., & Choi, H. Y. (2025) · Scientific Reports · doi:10.1038/s41598-025-27185-5
“Transcript coverage reflected transcript architecture (exons and introns), while also accommodating additional variation arising from technical or biological factors including GC content and RNA integrity 9,11–13 (Fig.”
Houmam, S., Siodłak, D., Seshadri, M., Hallum, G. B., Pezant, N. P., Stanford, D. R., Salinas-Salinas, C., Thomason, Y. M., Montgomery, C. G., & Rice, H. C. (2025) · bioRxiv (Cold Spring Harbor Laboratory) · doi:10.1101/2025.11.25.690528
“Since these features result in low read counts in RNAseq 32,33 , which is typically 3’-biased and inefficient at detecting, short, GC-rich sequences, we then employed a more targeted approach.”
Additional file 3 of Baiting out a full length sequence from unmapped RNA-seq data
Li, D., Huang, Q., Huang, L., Wen, J., Luo, J., Li, Q., Peng, Y., & Zhang, Y. (2021) · Figshare · doi:10.6084/m9.figshare.17088302
Gustafsson, J., Robinson, J. L., Nielsen, J., & Pachter, L. (2021) · Figshare · doi:10.6084/m9.figshare.14752250
Additional file 1 of Baiting out a full length sequence from unmapped RNA-seq data
Li, D., Huang, Q., Huang, L., Wen, J., Luo, J., Li, Q., Peng, Y., & Zhang, Y. (2021) · Figshare · doi:10.6084/m9.figshare.17088296
Additional file 2 of Baiting out a full length sequence from unmapped RNA-seq data
Li, D., Huang, Q., Huang, L., Wen, J., Luo, J., Li, Q., Peng, Y., & Zhang, Y. (2021) · Figshare · doi:10.6084/m9.figshare.17088299
Gustafsson, J., Robinson, J. L., Nielsen, J., & Pachter, L. (2021) · Figshare · doi:10.6084/m9.figshare.14752259
Vagne, C. (2014) · theses.fr (ABES) · doi:10.70675/4b74cdafz5fa2z4ca1zbda0z1f3dcab738a6
Garavillon‐Tournayre, M. (2017) · theses.fr (ABES) · doi:10.70675/cad6da70z6483z4e3fz9a13z6e3cd2431b02
Intégration de données hétérogènes complexes à partir de tableaux de tailles déséquilibrées
Imbert, A. (2018) · theses.fr (ABES) · doi:10.70675/eeb1ba35z69dfz4343z947ez23e378ba8ad2
Caractérisation de la reprogrammation de l'expression des gènes chez les blés allopyloïdes
Chalabi, S. (2014) · theses.fr (ABES) · doi:10.70675/bee96c14z587dz44d5zad96z53a7d6126cec
Andre, D., Fabrizius, A., Hagmaier, M., Waisman, A., Reifenberg, K., Burmester, T., Reuss, S., & Hankeln, T. (2026) · Neuroscience · doi:10.1016/j.neuroscience.2026.07.062
Wang, A., Guo, Y., Zhu, J., Sun, Y., Huang, Z., Lin, T., Liang, C., Xu, C., Qiang, X., He, J., et al. (2026) · Frontiers in Cellular and Infection Microbiology · doi:10.3389/fcimb.2026.1919001
“Statistically signi fi cant GO terms were de fi ned as those with a false discovery rate (FDR)-adjusted P -value < 0.05 (Oshlack and Wake fi eld, 2009; Young et al., 2010).”
InfluentialCalla, B., Yeats, M. S., & Johnson, K. M. (2026) · SSRN Electronic Journal · doi:10.2139/ssrn.7387970
Pigani, E., Simoens, K., Bernardi, D., Campese, L., Iudicone, D., Azaele, S., & Suweis, S. S. (2026) · Proceedings of the National Academy of Sciences · doi:10.1073/pnas.2615743123
Analysis of Genome-Wide Gene Expression Data from Microarrays and Sequencing
Nazor, K. L., Thiagarajan, R. D., & Laurent, L. C. (2012) · Elsevier eBooks · doi:10.1016/b978-0-12-385473-5.00017-5
Algorithms for Transcriptome Quantification and Reconstruction from RNA-Seq Data
Mangul, S. (2022) · Digital Archive @ GSU · doi:10.57709/3489378
Metadata
- Authors
- Oshlack, A., & Wakefield, M. J.
- Affiliations
- Walter and Eliza Hall Institute of Medical Research (AU)
- Corresponding author
- Oshlack, Alicia
- Venue
- Biology Direct
- Published
- 2009
- Volume
- 4
- Issue
- 1
- Pages
- 14
- ISSN
- 1745-6150 (ISSN-L)
- PMC
- PMC2678084
- OpenAlex
- W2114504176
- Cited by
- 497
- References
- 12
- Citations by year
- 2026: 6 · 2025: 8 · 2024: 16 · 2023: 14 · 2022: 24 · 2021: 35 · 2020: 12 · 2019: 29 · 2018: 30 · 2017: 36 · 2016: 33 · 2015: 39 · 2014: 39 · 2013: 37 · 2012: 44
- FWCI
- 18.63
- Type
- journal article
- Language
- en
- Open access
- gold
- doi.org
- Licence
- cc-by
- Locations
- Biology Direct (publishedVersion, cc-by)
- PubMed Central (publishedVersion, cc-by)
- PubMed (publishedVersion)
- Minerva Access (University of Melbourne) (submittedVersion, cc-by)
- DOAJ (DOAJ: Directory of Open Access Journals) (submittedVersion)
- Topics
- Life Sciences › Biochemistry, Genetics and Molecular Biology › Molecular Biology › Genomics and Phylogenetic Studies
- Life Sciences › Biochemistry, Genetics and Molecular Biology › Molecular Biology › Gene expression and cancer classification
- Life Sciences › Biochemistry, Genetics and Molecular Biology › Molecular Biology › Bioinformatics and Genomic Networks
- Keywords
- RNA-seq, differentially expressed genes, gene expression profiling, pathway analysis, systems biology
- MeSH terms
- Base Sequence, Humans, RNA, Messenger, Transcription, Genetic, Bias, Oligonucleotide Array Sequence Analysis, Gene Expression Profiling, Systems Biology
About these checks
Registry, retraction, Cites and statistics results are computed, not judged, with one exception: a printed reference that no index lists is read once by a model before it counts as a citation error. Claims are extracted by a model and kept only when their quote appears verbatim in the text; each cited source is then checked, with a model’s help, for whether it says what the claim relies on. Those verdicts can be wrong — read the claim’s quote and the cited source before relying on one.
Statistics and arithmetic are recomputed, not judged.
Confidence bands are shown only for fields calibrated on our annotated test set. None is calibrated yet, so no band is shown.
What counts as a claim ›How we measure confidence ›How we check this ›
Are you an author, or do you see a problem with this page? Request a review
