

The DOI matches its Crossref record; 12 of the 12 references it cites were found in a registry or an index.
Transcript length bias in RNA-seq data confounds systems biology
Open accessAbstract
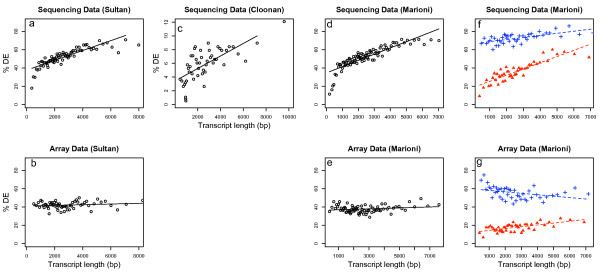
BACKGROUND: Several recent studies have demonstrated the effectiveness of deep sequencing for transcriptome analysis (RNA-seq) in mammals. As RNA-seq becomes more affordable, whole genome transcriptional profiling is likely to become the platform of choice for species with good genomic sequences. As yet, a rigorous analysis methodology has not been developed and we are still in the stages of exploring the features of the data. RESULTS: We investigated the effect of transcript length bias in RNA-seq data using three different published data sets. For standard analyses using aggregated tag counts for each gene, the ability to call differentially expressed genes between samples is strongly associated with the length of the transcript. CONCLUSION: Transcript length bias for calling differentially expressed genes is a general feature of current protocols for RNA-seq technology. This has implications for the ranking of differentially expressed genes, and in particular may introduce bias in gene set testing for pathway analysis and other multi-gene systems biology analyses. REVIEWERS: This article was reviewed by Rohan Williams (nominated by Gavin Huttley), Nicole Cloonan (nominated by Mark Ragan) and James Bullard (nominated by Sandrine Dudoit).
Overview
The claims and statistics of this paper haven’t been checked yet.
Run the check — free, no account needed. It reads the open-access text and checks the sources it cites.
Integrity signals
Registry
Cites
Statistics
Figures
Verification
Claims the paper makes
The claims and statistics of this paper haven’t been checked yet.
Run the check — free, no account needed. It reads the open-access text and checks the sources it cites.
Claims other papers make about this one
Each is checked against this paper’s own text: does it say what the citing paper says it does?
In the citing paper
“It should be noted that these estimates apply to the average gene expression level, but as dynamic ranges in RNA-seq data are large, the probability that highly expressed genes will be detected as differentially expressed is greater than that for low-count genes [192].”
From A survey of best practices for RNA-seq data analysis (2016) · cites this paper as [192]
Self-check
Percentages, sums and reported differences re-computed from the paper’s own numbers.
The self-check needs the paper’s full text.
Citations
Cites
Systematic and integrative analysis of large gene lists using DAVID bioinformatics resources
Huang, D. W., Sherman, B. T., & Lempicki, R. A. (2009) · Nature Protocols · doi:10.1038/nprot.2008.211 · Cited by 35,890 · cited 1×
“In each analysis we only used genes found on both platforms and then performed a pathway analysis using the DAVID software [7,8].”
MethodHuang, D. W., Sherman, B. T., & Lempicki, R. A. (2009) · Nucleic Acids Research · doi:10.1093/nar/gkn923 · Cited by 14,108 · cited 1×
“In each analysis we only used genes found on both platforms and then performed a pathway analysis using the DAVID software [7,8].”
MethodSmyth, G. K. (2004) · Statistical Applications in Genetics and Molecular Biology · doi:10.2202/1544-6115.1027 · Cited by 11,829
Exploration, normalization, and summaries of high density oligonucleotide array probe level data
Irizarry, R. A. (2003) · Biostatistics · doi:10.1093/biostatistics/4.2.249 · Cited by 10,603 · cited 1×
“array algorithm [9] but this suggestion requires further exploration and analysis.”
MethodAlternative isoform regulation in human tissue transcriptomes
Wang, E. T., Sandberg, R., Luo, S., Khrebtukova, I., Zhang, L., Mayr, C., Kingsmore, S. F., Schroth, G. P., & Burge, C. B. (2008) · Nature · doi:10.1038/nature07509 · Cited by 5,181
The Significance of Digital Gene Expression ProfilesPreprint
Audic, S., & Claverie, J. (1997) · Genome Research · doi:10.1101/gr.7.10.986 · Cited by 2,787 · cited 1×
“They then used a method based on the proportion of counts from each library proposed by Audic and Claverie [11] to determine the significant of differential expression.”
MethodRNA-seq: An assessment of technical reproducibility and comparison with gene expression arrays
Marioni, J. C., Mason, C. E., Mane, S. M., Stephens, M., & Gilad, Y. (2008) · Genome Research · doi:10.1101/gr.079558.108 · Cited by 2,771 · cited 7×
“For the data from Marioni et al (2008) genes were matched between the RNA-seq platform and the microarray platform.”
BackgroundMethodInfluentialSultan, M., Schulz, M. H., Richard, H., Magen, A., Klingenhoff, A., Scherf, M., Seifert, M., Borodina, T., Soldatov, A., Parkhomchuk, D., et al. (2008) · Science · doi:10.1126/science.1160342 · Cited by 1,293 · cited 3×
“The first data set compares sequencing from the Illumina Genome Analyzer with Illumina microarrays and looks for differential expression between a human embryonic kidney and B cell line [4].”
BackgroundMethodStem cell transcriptome profiling via massive-scale mRNA sequencing
Cloonan, N., Forrest, A. R. R., Kolle, G., Gardiner, B. B. A., Faulkner, G. J., Brown, M. K., Taylor, D. F., Steptoe, A. L., Wani, S., Bethel, G., et al. (2008) · Nature Methods · doi:10.1038/nmeth.1223 · Cited by 1,035 · cited 4×
“…a predictable consequence of the sampling process and cannot be corrected by dividing by length of the transcript (e.g. the statistical methods in Cloonan et al (2008) or Sultan et al. Differential expression as a function of transcript lengthFigu 1 Differential expression as a function of…”
MethodInfluentialStochastic Models Inspired by Hybridization Theory for Short Oligonucleotide Arrays
Wu, Z. J., & Irizarry, R. A. (2005) · Journal of Computational Biology · doi:10.1089/cmb.2005.12.882 · Cited by 266 · cited 1×
“By contrast, intensity measurements from microarrays are proportional only to the expression level of the transcript plus any features intrinsic to the probe itself such as GC content [2,3].”
Background
Cited by
Sorted by citations
Items 301–400 of 497
Jensen, T. L., Frasketi, M., Conway, K., Villarroel, L., Hill, H., Krampis, K., & Goll, J. B. (2017) · F1000Research · doi:10.12688/f1000research.13049.1 · Cited by 9
CCPLS reveals cell-type-specific spatial dependence of transcriptomes in single cells
Tsuchiya, T., Hori, H., & Ozaki, H. (2022) · Bioinformatics · doi:10.1093/bioinformatics/btac599 · Cited by 10
“Note that we did not perform experiments in count scale, which was originally un-recommended in the literature (Oshlack and Wakefield, 2009; Van Verk et al., 2013), and instead simulated scaled data.”
MethodJensen, T. L., Frasketi, M., Conway, K., Villarroel, L., Hill, H., Krampis, K., & Goll, J. B. (2018) · F1000Research · doi:10.12688/f1000research.13049.2 · Cited by 9
“…statistical methods that model read count variability using a discrete negative binomial distribution and share information across genes 32 , the use of moderated log 2 counts per million for multivariate analyses, and adjustment for gene length bias 38 as part of pathway enrichment analysis 39 .”
Mangul, S., Caciula, A., Glebova, O., Măndoiu, I., & Zelikovsky, A. (2012) · In Silico Biology · doi:10.3233/isb-2012-0459 · Cited by 9
“biases, similar to the transcript-length bias noted in [12], which further complicates the design of unbiased differ-”
MethodHoward, J., Ashwell, M. S., Baynes, R. E., Brooks, J. D., Yeatts, J. L., & Maltecca, C. (2017) · Scientific Reports · doi:10.1038/s41598-017-01526-5 · Cited by 9
Ma, T., Liang, F., & Tseng, G. C. (2016) · Journal of the Royal Statistical Society Series C (Applied Statistics) · doi:10.1111/rssc.12199 · Cited by 9
“Analysis of RNA-seq data needs to address such a read count bias considering that many important disease markers are of short length or low expression (Oshlack and Wakefield, 2009).”
BackgroundWhole blood RNA extraction efficiency contributes to variability in RNA sequencing data sets
Wilfinger, W. W., Eghbalnia, H. R., Mackey, K., Miller, R. G., & Chomczyński, P. (2023) · PLoS ONE · doi:10.1371/journal.pone.0291209 · Cited by 8
Gao, S., Wang, Y., Wang, J., & Dong, Y. (2024) · BMC Genomics · doi:10.1186/s12864-024-10855-5 · Cited by 8
“However, DEA tends to favor highly expressed genes [18–20].”
BackgroundIntegrated systems‐genetic analyses reveal a network target for delaying glioma progression
Laaniste, L., Srivastava, P. K., Stylianou, J., Syed, N., Cases‐Cunillera, S., Shkura, K., Zeng, Q., Rackham, O. J. L., Langley, S. R., Delahaye‐Duriez, A., et al. (2019) · Annals of Clinical and Translational Neurology · doi:10.1002/acn3.50850 · Cited by 8
“23 The genes with very low expression were removed and the gene expression was corrected for batch effects.”
BackgroundGustafsson, J., Robinson, J. L., Nielsen, J., & Pachter, L. S. (2021) · Genome biology · doi:10.1186/s13059-021-02386-z · Cited by 7
Ortega, J. G., Raubenheimer, D., Tyagi, S., Mirth, C. K., & Piper, M. D. W. (2023) · PLoS Genetics · doi:10.1371/journal.pgen.1010635 · Cited by 8
“Although we showed exome matching to be biologically effective, its current implementation does not incorporate weightings for the substantial differences we know to exist in genes’ sizes and their degree of expression [23].”
Differential Expression Analysis in RNA-Seq by a Naive Bayes Classifier with Local Normalization
Dou, Y., Guo, X., Yuan, L., Holding, D. R., & Zhang, C. (2015) · BioMed Research International · doi:10.1155/2015/789516 · Cited by 8
“It has been accepted for inclusion in Agronomy & Horticulture -- Faculty Publications by an authorized administrator of DigitalCommons@University of Nebraska - Lincoln.”
Estimation of data-specific constitutive exons with RNA-Seq data
Patrick, E., Buckley, M., & Yang, J. Y. H. (2013) · BMC Bioinformatics · doi:10.1186/1471-2105-14-31 · Cited by 8
“This is an issue as the number of reads summarised for a gene can affect the sensitivity of tests for differential expression [25].”
BackgroundA Review on The Processing and Analysis of Next-generation RNA-seq Data*
Wang, X., Wang, X., Wang, L., Feng, Z., & Zhang, X. (2010) · PROGRESS IN BIOCHEMISTRY AND BIOPHYSICS · doi:10.3724/sp.j.1206.2009.00151 · Cited by 9
Insights into the next generation of cancer stem cell research
Daniel, V. B. (2014) · Frontiers in bioscience · doi:10.2741/4264 · Cited by 9
“gene length (25, 29) and first-strand synthesis efficiency/errors (26, 30).”
BackgroundMethodWei, Z., Liu, X., Zhou, Z., & Xu, J. (2019) · Genes & Genomics · doi:10.1007/s13258-019-00799-6 · Cited by 8
Differential gene expression in a tripartite interaction:Drosophila,Spiroplasmaand parasitic wasps
Higareda‐Alvear, V. M., Mateos, M., Cortez, D., Tamborindeguy, C., & Martínez‐Romero, E. (2021) · PeerJ · doi:10.7717/peerj.11020 · Cited by 8
Ceschin, D. G. (2017) · International Journal of Environment and Health · doi:10.1504/ijenvh.2017.086180 · Cited by 6
LOESS correction for length variation in gene set-based genomic sequence analysis
Aboukhalil, A., & Bulyk, M. L. (2012) · Bioinformatics · doi:10.1093/bioinformatics/bts155 · Cited by 7
“…on its transcript abundance and length (Cloonan et al., 2008; Gao et al., 2011; Lee et al., 2011; Mortazavi et al., 2008), transcript length may confound gene expression analysis (Oshlack and Wakefield, 2009), with a bias for calling a higher proportion of long transcripts as expressed more highly.”
BackgroundPrediction of fine-tuned promoter activity from DNA sequence
Siwo, G., Rider, A. K., Tan, A., Pinapati, R. S., Emrich, S., Chawla, N. V., & Ferdig, M. T. (2016) · F1000Research · doi:10.12688/f1000research.7485.1 · Cited by 7
“In addition, microarray and RNA-seq can be affected by systematic biases arising from sequence dependent hybridization kinetics [31] and sequence dependent read-depth coverage [32], respectively.”
BackgroundFrom STRs to SNPs via ddRAD ‐seq: Geographic assignment of confiscated tortoises at reduced costs
Biello, R., Zampiglia, M., Fuselli, S., Fabbri, G., Bisconti, R., Chiocchio, A., Mazzotti, S., Trucchi, E., Canestrelli, D., & Bertorelle, G. (2022) · Evolutionary Applications · doi:10.1111/eva.13431 · Cited by 7
Using Genomic Tools to Study Regulatory Evolution
Gilad, Y. (2012) · Methods in molecular biology · doi:10.1007/978-1-61779-585-5_14 · Cited by 8
“Power to detect differentially expressed genes—Another important property of RNAseq data is that the number of sequence reads that map to a particular gene tends to be roughly proportional to the expression level of the gene multiplied by the gene’s length (14).”
BackgroundBeyond library size: a field guide to NGS normalizationPreprint
Aleksic, J., Carl, S. H., & Frye, M. (2014) · bioRxiv (Cold Spring Harbor Laboratory) · doi:10.1101/006403 · Cited by 7
“This is important when comparing conditions within a species [4, 22], but really becomes essential in cross-species comparisons, where homologues may have different lengths and can therefore end up with very different read counts.”
BackgroundSun, C., Wang, R., Li, J., Li, X., Song, B., Edwards, D., & Wu, J. (2024) · Journal of Integrative Agriculture · doi:10.1016/j.jia.2024.11.026 · Cited by 6
Ogbonna, A. C., Ramu, P., Esuma, W., Nandudu, L., Morales, N., Powell, A. F., Kawuki, R., Bauchet, G. J., Jannink, J., & Mueller, L. A. (2021) · Scientific Reports · doi:10.1038/s41598-021-02794-y · Cited by 6
Gene Expression Profiling of Mouse Embryos with Microarrays
Sharov, A. A., Piao, Y., & Ko, M. S. H. (2010) · Methods in enzymology on CD-ROM/Methods in enzymology · doi:10.1016/s0076-6879(10)77025-7 · Cited by 6
Chips and tags suggest plant-environment interactions differ for two alpine Pachycladon species
Voelckel, C., Gruenheit, N., Biggs, P. J., Deusch, O., & Lockhart, P. J. (2012) · BMC Genomics · doi:10.1186/1471-2164-13-322 · Cited by 6
“For example, the statistics needed to analyse RNA-seq experiments are known to introduce a length bias, with longer genes having a higher probability of being inferred to be differentially expressed [46].”
BackgroundScreening the Molecular Framework Underlying Local Dendritic mRNA Translation
Namjoshi, S. V., & Raab‐Graham, K. F. (2017) · Frontiers in Molecular Neuroscience · doi:10.3389/fnmol.2017.00045 · Cited by 7
“Although RPKM can be used for within library comparisons, it is not appropriate for comparisons between libraries because of inconsistent average RPKM (Oshlack and Wakefield, 2009).”
MethodSystems Genetics of Complex Diseases Using RNA-Sequencing Methods
Mazzoni, G., Kogelman, L. J. A., Suravajhala, P., & Kadarmideen, H. N. (2015) · International Journal of Bioscience Biochemistry and Bioinformatics · doi:10.17706/ijbbb.2015.5.4.264-279 · Cited by 8
“Consequently, those genes have also a higher change of being detected as “differentially expressed” due to a higher statistical power [44].”
BackgroundWu, H., Qin, Z. S., & Zhu, Y. (2012) · Statistics in Biosciences · doi:10.1007/s12561-012-9070-9 · Cited by 5
“Oshlack and Wakefield [15] mentioned that transcript length can be a source of bias and needs to be corrected, and Hansen and Dudoit [5] pointed out that when random hexamer priming is used, the resulting sequence coverage is not uniform.”
BackgroundA Survey of Bioinformatics-Based Tools in RNA-Sequencing (RNA-Seq) Data Analysis
Gaur, P., & Chaturvedi, A. (2017) · Translational medicine research · doi:10.1007/978-94-024-1045-7_10 · Cited by 6
Keady, S. M. (2011) · Maynooth University ePrints and eTheses Archive (Maynooth University) · Cited by 6
Wünsch, M., Sauer, C., Callahan, P. M., Hinske, L. C., & Boulesteix, A. (2024) · Wiley Interdisciplinary Reviews Computational Statistics · doi:10.1002/wics.1643 · Cited by 5
“…the circumstance that for RNA-Seq data, the probability of detecting a gene set as differentially enriched increases as the gene set members increase in transcript length, even if they remain constant in their level of differential expression between both conditions (Oshlack & Wakefield, 2009).”
BackgroundHe, J., Ganesamoorthy, D., Chang, J. J. ‐., Zhang, J., Trevor, S. L., GIBBONS, K. S., McPherson, S. J., Kling, J. C., Schlapbach, L. J., Blumenthal, A., et al. (2025) · BMC Infectious Diseases · doi:10.1186/s12879-025-11078-z · Cited by 8
“While the gene expression biases of Illumina cDNA sequencing have been widely studied [22], it remains unclear which biases are present in quantification of Nanopore direct RNA-seq, and whether Nanopore direct RNA-seq can be used in place of Illumina short-read sequencing in transcriptional…”
Host-Based Diagnostics for Detection and Prognosis of Infectious Diseases
Yang, W. E., Woods, C. W., & Tsalik, E. L. (2015) · Methods in microbiology · doi:10.1016/bs.mim.2015.06.001 · Cited by 6
Oh, S. A., Yang, I., Hahn, Y., Kang, Y., Chung, S., & Jeong, S. (2015) · Scientific Reports · doi:10.1038/srep11879 · Cited by 5
The Analyses of Global Gene Expression and Transcription Factor Regulation
Durán, R. C., Menon, S., & Wu, J. (2015) · Translational bioinformatics · doi:10.1007/978-94-017-7450-5_1 · Cited by 6
Massively Parallel Sequencing Technology in Pathogenic Microbes
Tripathy, S., & Jiang, R. H. Y. (2011) · Methods in molecular biology · doi:10.1007/978-1-61779-501-5_17 · Cited by 5
Wong, W., Ng, H. K., Tantoso, E., Soong, R. C. T., & Eisenhaber, F. (2018) · Biology Direct · doi:10.1186/s13062-018-0204-y · Cited by 4
“Two miRNA sequencing datasets composed of technical replicates were being examined; The choice of miRNA is deliberate to avoid both transcript length bias [9] and abundance quantification [21] as confounding factors.”
BackgroundInfluentialEmpirical Bayes analysis of RNA sequencing experiments with auxiliary information
Liang, K. (2019) · The Annals of Applied Statistics · doi:10.1214/19-aoas1270 · Cited by 5
“In RNA-seq, the longer genes tend to have a higher number of observed counts and better power to detect differential expression (Oshlack and Wakefield, 2009).”
BackgroundBaiting out a full length sequence from unmapped RNA-seq data
Li, D., Huang, Q., Huang, L., Wen, J., Luo, J., Li, Q., Peng, Y., & Zhang, Y. (2021) · BMC Genomics · doi:10.1186/s12864-021-08146-4 · Cited by 5
“Moreover, researchers find that longer transcripts produce more reads relative to shorter transcripts of similar expression levels in high-throughput sequencing [19].”
BackgroundLithio, A., & Nettleton, D. S. (2015) · Journal of Agricultural Biological and Environmental Statistics · doi:10.1007/s13253-015-0232-3 · Cited by 5
“Furthermore, biases introduced by the GC content and length of each feature have been well documented, but are not typically consistent across datasets (Oshlack et al. 2009; Benjamini and Speed 2012).”
A Framework for the RNA-Seq Based Classification and Prediction of Disease
Iqbal, N., & Kumar, P. (2020) · Lecture notes in electrical engineering · doi:10.1007/978-981-15-1420-3_8 · Cited by 5
“The longer transcript has great potential for the detection of differential expression by the use of three published RNA-Seq high throughput data [7].”
MethodTorang, A., Gupta, P., & Klinke, D. J. (2019) · bioRxiv (Cold Spring Harbor Laboratory) · doi:10.1101/623082 · Cited by 5
Ortega, J. G., Tyagi, S., Mirth, C. K., & Piper, M. D. W. (2021) · bioRxiv (Cold Spring Harbor Laboratory) · doi:10.1101/2021.11.03.467059 · Cited by 5
“Although we showed exome matching to be biologically effective, its current implementation does not incorporate weightings for the substantial differences we know to exist in genes’ sizes and their degree of expression (Oshlack and Wakefield, 2009).”
MethodSafety profile of sikamat virus and its oncolytic potential in leukemic cells and cancer stem cells
Siew, Z. Y., Ong, G. K., Wong, S. T., Leong, P. P., Tan, B. S., Leong, C.-O., Chupri, J., Fang, C.-M., & Voon, K. (2025) · Scientific Reports · doi:10.1038/s41598-025-96061-z · Cited by 5
Integration of epigenetic, transcriptomic and proteomic data
Zenere, A. (2023) · Linköping studies in science and technology. Dissertations · doi:10.3384/9789180750691 · Cited by 5
Bayesian Hierarchical Model for Differential Gene Expression Using RNA-Seq Data
Lee, J. H., Ji, Y., Liang, S., Cai, G., & Müller, P. (2013) · Statistics in Biosciences · doi:10.1007/s12561-013-9096-7 · Cited by 4
“In addition, Bullard et al. [5] and Oshlack and Wakefield [24] pointed out additional biases that are introduced in these preprocessing steps.”
BackgroundStatistical modeling for differential transcriptome analysis using RNA-Seq technology
Miecznikowski, J. C., Liu, S., & Ren, X. (2012) · Journal of Solid Tumors · doi:10.5430/jst.v2n5p33 · Cited by 4
“However, (cid:1877) (cid:1861)(cid:1862) is biased towards longer transcripts because they generate more short reads given the same expression level [51] .”
BackgroundMazzoni, G., & Kadarmideen, H. N. (2016) · Springer eBooks · doi:10.1007/978-3-319-43332-5_3 · Cited by 4
“Thus, it is likely to have a higher level of expression rather than shorter transcripts due to this technical problem and not due to a real activation or inactivation of the transcription (Zheng et al. 2011; Oshlack and Wakefield 2009).”
BackgroundXiao, P., Goodarzi, P., Pezeshki, A., & Hagen, D. E. (2022) · Journal of Animal Science · doi:10.1093/jas/skac156 · Cited by 4
“Motif enrichment analysis of RNA-binding proteins To identify the RNA-binding proteins (RBP) enriched in transcripts which leads to differential ASE between L0 and other groups, we both collected known motifs of RBP and performed motif scan by RBPmap web server (Paz et al., 2014).”
MethodGhosh, A., & Som, A. (2023) · Differentiation · doi:10.1016/j.diff.2023.11.001 · Cited by 4
A Workflow Guide to RNA-seq Analysis of Chaperone Function and Beyond
Lang, B. J., Holton, K. M., Gong, J., & Calderwood, S. K. (2017) · Methods in molecular biology · doi:10.1007/978-1-4939-7477-1_18 · Cited by 4
Linheiro, R. S., & Archer, J. P. (2021) · PLoS Computational Biology · doi:10.1371/journal.pcbi.1009631 · Cited by 6
“Given that the lengths of transcribed genes are largely expected to be within the range of 300 to 5000 nt [72], such an increase in means, relative to the medians is more likely to be an indication of contig overextension rather than contig correctness.”
BackgroundNamous, H., Braz, C. U., Wang, Y., & Khatib, H. (2022) · Frontiers in Genome Editing · doi:10.3389/fgeed.2022.844904 · Cited by 4
“Indeed, the power to detect a transcript depends on its length and abundance in the sequencing library (Oshlack and Wakefield, 2009; Sims et al., 2014).”
BackgroundInterindividual variation in epigenomic phenomena in humans
French, H. J., Attenborough, R., Hardy, K., Shannon, M. F., & Williams, R. B. H. (2009) · Mammalian Genome · doi:10.1007/s00335-009-9219-0 · Cited by 4
“…et al. 2009) although recent analyses from RNA-Seq (high-throughput-sequencing-based trans-criptomics) indicate that such systematic biases, distinct from those in expression microarray data, are clearly present and can influence downstream biological interpretation (Oshlack and Wakefield 2009).”
Wang, D., Zhao, J., Chen, Q., Han, Y., Liu, Y., Zhang, Y., Liu, C., Hou, W., Yu, Y., Shi, L. M., et al. (2026) · Nature Communications · doi:10.1038/s41467-026-76380-z · Cited by 3
“This reduces the statistical power of quanti fi cation and increases susceptibility to bias, which are consistent with previous observations 17,31 .”
The problem of selection bias in studies of pre-mRNA splicing
Dwyer, Z. W., & Pleiss, J. A. (2023) · Nature Communications · doi:10.1038/s41467-023-37650-2 · Cited by 3
Detection of alternative splicing: deep sequencing or deep learning?
Hackl, L. M., Neuhaus, F., Ameling, S., Völker, U., Baumbach, J., & Tsoy, O. V. (2025) · Briefings in Bioinformatics · doi:10.1093/bib/bbaf705 · Cited by 2
“Furthermore, longer transcripts will be detected better than shorter ones as they generate more fragments and are better covered [17].”
Wan, D., Cheng, A., Wang, Y., Zhong, G., Li, W. V., & Fan, H. (2024) · BMC Genomics · doi:10.1186/s12864-024-10714-3 · Cited by 3
Baer, L., Barthelson, K., Postlethwait, J. H., Adelson, D. L., Pederson, S., & Lardelli, M. T. (2024) · PLoS Computational Biology · doi:10.1371/journal.pcbi.1011868 · Cited by 3
“However, in RNA-seq data, selection bias attributed to transcript length [40] violates the assumptions behind a hypergeometric distribution.”
BackgroundGrouped False-Discovery Rate for Removing the Gene-set-Level Bias of RNA-seq
Yang, T. Y., & Jeong, S. (2013) · Evolutionary Bioinformatics · doi:10.4137/ebo.s13099 · Cited by 3
Transcript Profiling in Arabidopsis with Genome Tiling Microarrays
Coman, D., Gruissem, W., & Hennig, L. (2013) · Methods in molecular biology · doi:10.1007/978-1-62703-607-8_3 · Cited by 3
Zhao, S., Zhang, L., & Liu, X. (2022) · Computers in Biology and Medicine · doi:10.1016/j.compbiomed.2022.105578 · Cited by 3
Differential gene expression analysis using coexpression and RNA-Seq data
Yang, E.-W., Girkes, T., & Jaing, T. (2013) · IEEE International Conference on Computational Advances in Bio and Medical Sciences · doi:10.1109/iccabs.2013.6629222 · Cited by 3
“It is known that the selection bias on DE genes, if uncorrected, may lead to biased downstream analyses (Oshlack and Wakefield, 2009; Oshlack et al., 2010; Young et al., 2010).”
BackgroundMethodInfluentialTranscriptomic Data Normalization
Vafaee, F., Dashti, H., & Alinejad‐Rokny, H. (2018) · Elsevier eBooks · doi:10.1016/b978-0-12-809633-8.20209-4 · Cited by 3
GeneRAIN: multifaceted representation of genes via deep learning of gene expression networks
Su, Z., Fang, M., Smolnikov, A., Dinger, M. E., Oates, E. C., & Vafaee, F. (2025) · Genome biology · doi:10.1186/s13059-025-03749-6 · Cited by 3
“It should be noted that prior to applying our z-score normalization, we normalized each sample by its Library size to have a total read count of 10 million (“Methods”), similar to the library-size scaling step of traditional techniques like TPM/FPKM normalization [27, 28].”
Houmam, S., Siodłak, D., Seshadri, M., Hallum, G. B., Pezant, N. P., Stanford, D. R., Salinas-Salinas, C., Thomason, Y. M., Santín-Márquez, R., Stout, M. B., et al. (2026) · Brain Research · doi:10.1016/j.brainres.2026.150463 · Cited by 2
Lee, G., Lee, H., & Jeong, R. (2024) · The Plant Pathology Journal · doi:10.5423/ppj.oa.06.2024.0088 · Cited by 2
“In RNA-Seq data, transcript length biases may arise due to random RNA fragmentation and the inherent sampling nature (Oshlack and Wakefield, 2009).”
Optimization Techniques For Next-Generation Sequencing Data Analysis
Caciula, A. (2022) · doi:10.57709/5825568 · Cited by 2
Applications of Genomics in Weed Science
Jugulam, M., Gaines, T. A., Tranel, P. J., Fleming, M. B., Patterson, E. L., Küpper, A., Ravet, K., Giacomini, D. A., González, S., & Beffa, R. (2017) · CRC Press eBooks · doi:10.1201/9781315121031-11 · Cited by 2
Transcriptomics Using Axolotls
Voss, S. R., Athippozhy, A., & Woodcock, M. R. (2015) · Methods in molecular biology · doi:10.1007/978-1-4939-2495-0_24 · Cited by 2
Controlling the false-discovery rate by procedures adapted to the length bias of RNA-Seq
Yang, T. Y., & Jeong, S. (2017) · Journal of the Korean Statistical Society · doi:10.1016/j.jkss.2017.08.001 · Cited by 2
Helicos Single‐Molecule Sequencing for Accurate Tag‐Based RNA Quantitation
Thompson, J. F., Raz, T., & Milos, P. M. (2011) · doi:10.1002/9783527644582.ch22 · Cited by 2
Flimma: a federated and privacy-preserving tool for differential gene expression analysisPreprint
Zolotareva, O. I., Nasirigerdeh, R., Matschinske, J., Torkzadehmahani, R., Frisch, T., Späth, J., Blumenthal, D. B., Abbasinejad, A., Tieri, P., Wenke, N. K., et al. (2020) · arXiv (Cornell University) · doi:10.48550/arxiv.2010.16403 · Cited by 2
“count-based measurement, and their results subject to platform-specific biases [1,2].”
BackgroundHuerlimann, R., Cowley, J. A., Wade, N. M., Wang, Y., Kasinadhuni, N., Chan, C. K., Jabbari, J. S., Siemering, K. R., Gordon, L., Tinning, M., et al. (2021) · bioRxiv (Cold Spring Harbor Laboratory) · doi:10.1101/2021.11.11.468259 · Cited by 2
3’ RNA sequencing does not increase power or reduce costs for gene expression analysisPreprint
Crow, T. M., Gill, J. A., Whitehead, A., & Runcie, D. E. (2022) · bioRxiv (Cold Spring Harbor Laboratory) · doi:10.1101/2022.04.13.488225 · Cited by 2
“The main advantage of 3’ libraries is that they are not subject to the length bias of WT, which can impact downstream analysis such as gene set enrichment [17, 1, 18, 19].”
BackgroundTo make a short story long: simultaneous short and long RNA profiling on Nanopore devicesPreprint
Mackenzie, M. E., Tigert, S. L., Lovato, D. M., Mir, H., Zahedi, K. A., Barone, S., Brooks, M., Soleimani, M., & Argyropoulos, C. (2022) · bioRxiv (Cold Spring Harbor Laboratory) · doi:10.1101/2022.12.16.520507 · Cited by 2
Thieffry, A. (2014) · Epsilon Archive for Student Projects (University of Southampton) · Cited by 2
Plasticité phénotypique et moléculaire de deux clones d'eucalyptus sous contrainte hydrique au champ
Villar, É. (2011) · theses.fr (ABES) · doi:10.70675/52657987zfd09z428dz9e36z619c173798ea · Cited by 2
Estimation of Gene Expression at Isoform Level from mRNA-Seq Data by Bayesian Hierarchical Modeling
Bhattacharjee, M., Gupta, R., & Davuluri, R. V. (2012) · Frontiers in Genetics · doi:10.3389/fgene.2012.00239 · Cited by 1
An Integrated Approach to Plant Biology via Multi-Analogous Methods
Jan, S., & Ahmad, P. (2019) · Elsevier eBooks · doi:10.1016/b978-0-12-814872-3.00002-3 · Cited by 1
Chiari, Y., Howard, L., Moreno, N., Relyea, S., Dunnigan, J. L., Boyer, M. C., Kardos, M. D., Glaberman, S. R., & Luikart, G. (2023) · Molecular Ecology Resources · doi:10.1111/1755-0998.13757 · Cited by 1
Dowell, J. A., Bowsher, A. W., Jamshad, A., Shah, R., Burke, J. M., Donovan, L. A., & Mason, C. M. (2024) · American Journal of Botany · doi:10.1002/ajb2.16420 · Cited by 1
Strategies for taxonomic and functional annotation of metagenomes
Abramova, A., & Bengtsson‐Palme, J. (2024) · Elsevier eBooks · doi:10.1016/b978-0-323-91631-8.00002-0 · Cited by 1
Omics Era in Stem Cell Research: Data Integration of Multi-regulatory Layers
Sevilla, A., Trinité, B., & Lemischka, I. R. (2012) · Springer eBooks · doi:10.1007/978-94-007-4330-4_7 · Cited by 1
“This is a common problem with RNA-seq technologies [20].”
BackgroundCOMPARATIVE STUDIES OF DIFFERENTIAL GENE CALLING METHODS FOR RNA-SEQ DATA
Zheng, X. (2012) · Lincoln (University of Nebraska) · Cited by 1
Detecting differentially expressed genes by smoothing effect of gene length on variance estimation
Tang, J., & Wang, F. (2015) · Journal of Bioinformatics and Computational Biology · doi:10.1142/s0219720015420044 · Cited by 1
Computational Analysis of RNA-Seq Data from Airway Epithelial Cells for Studying Lung Disease
Jackson, N. D., Ringel, L., & Seibold, M. A. (2018) · Methods in molecular biology · doi:10.1007/978-1-4939-8570-8_15 · Cited by 1
En masse evaluation of RNA guides (EMERGe) for ADARs
Salvador, P. J., Dugan, N. M., Ouye, R., & Beal, P. A. (2025) · Methods in enzymology on CD-ROM/Methods in enzymology · doi:10.1016/bs.mie.2024.11.030 · Cited by 1
Bioinformatics Analysis of Pancreas Cancer Genome in High-Throughput Genomic Technologies
Pau, E. C. D. S., Real, F. X., & Valencia, A. (2014) · Elsevier eBooks · doi:10.1016/b978-0-12-408103-1.00005-4 · Cited by 2
A Hierarchical Bayesian Model for RNA-Seq Data
Risso, D., Sales, G., Romualdi, C., & Chiogna, M. (2012) · Contributions to statistics · doi:10.1007/978-88-470-2871-5_17 · Cited by 1
Statistical Analyses of Next Generation Sequencing Data: An Overview
Mitra, R., Gill, R. S., Datta, S., & Datta, S. (2014) · Springer eBooks · doi:10.1007/978-3-319-07212-8_1 · Cited by 1
RNA-Seq Data Analysis in Prokaryotes: A Review for Non-experts
Cubillos, A. E. R., Perlaza-Jiménez, L., & Giraldo, A. J. B. (2014) · Acta Biológica Colombiana · doi:10.15446/abc.v19n2.41010 · Cited by 2
Zhou, Y. G., Xu, C., Zhang, J., & Deng, H. (2016) · Translational bioinformatics · doi:10.1007/978-94-017-7543-4_3 · Cited by 1
Differential expression and feature selection in the analysis of multiple omics studies
Ma, T. (2018) · D-Scholarship@Pitt (University of Pittsburgh) · Cited by 1
Circular RNAs in Human Health and Disease
Grouse, L., Curry‐Hyde, A., Chen, B. J., & Janitz, M. (2019) · Springer eBooks · doi:10.1007/978-981-13-8958-0_5 · Cited by 1
RNA-Sequencing Analysis Pipeline for Prognostic Marker Identification in Cancer
Shukla, S. K., & Khadirnaikar, S. (2020) · Methods in molecular biology · doi:10.1007/978-1-0716-0759-6_8 · Cited by 1
An Overview of Gene Regulation
Harrison, A., & Shanahan, H. P. (2013) · Springer eBooks · doi:10.1007/978-3-642-41281-3_2 · Cited by 1
Analysis of RNA Transcripts by High‐Throughput RNA Sequencing
Ribeca, P., Lacroix, V., Sammeth, M., & Guigó, R. (2012) · doi:10.1002/9783527636778.ch50 · Cited by 1
Metadata
- Authors
- Oshlack, A., & Wakefield, M. J.
- Affiliations
- Walter and Eliza Hall Institute of Medical Research (AU)
- Corresponding author
- Oshlack, Alicia
- Venue
- Biology Direct
- Published
- 2009
- Volume
- 4
- Issue
- 1
- Pages
- 14
- ISSN
- 1745-6150 (ISSN-L)
- PMC
- PMC2678084
- OpenAlex
- W2114504176
- Cited by
- 497
- References
- 12
- Citations by year
- 2026: 6 · 2025: 8 · 2024: 16 · 2023: 14 · 2022: 24 · 2021: 35 · 2020: 12 · 2019: 29 · 2018: 30 · 2017: 36 · 2016: 33 · 2015: 39 · 2014: 39 · 2013: 37 · 2012: 44
- FWCI
- 18.63
- Type
- journal article
- Language
- en
- Open access
- gold
- doi.org
- Licence
- cc-by
- Locations
- Biology Direct (publishedVersion, cc-by)
- PubMed Central (publishedVersion, cc-by)
- PubMed (publishedVersion)
- Minerva Access (University of Melbourne) (submittedVersion, cc-by)
- DOAJ (DOAJ: Directory of Open Access Journals) (submittedVersion)
- Topics
- Life Sciences › Biochemistry, Genetics and Molecular Biology › Molecular Biology › Genomics and Phylogenetic Studies
- Life Sciences › Biochemistry, Genetics and Molecular Biology › Molecular Biology › Gene expression and cancer classification
- Life Sciences › Biochemistry, Genetics and Molecular Biology › Molecular Biology › Bioinformatics and Genomic Networks
- Keywords
- RNA-seq, differentially expressed genes, gene expression profiling, pathway analysis, systems biology
- MeSH terms
- Base Sequence, Humans, RNA, Messenger, Transcription, Genetic, Bias, Oligonucleotide Array Sequence Analysis, Gene Expression Profiling, Systems Biology
About these checks
Registry, retraction, Cites and statistics results are computed, not judged, with one exception: a printed reference that no index lists is read once by a model before it counts as a citation error. Claims are extracted by a model and kept only when their quote appears verbatim in the text; each cited source is then checked, with a model’s help, for whether it says what the claim relies on. Those verdicts can be wrong — read the claim’s quote and the cited source before relying on one.
Statistics and arithmetic are recomputed, not judged.
Confidence bands are shown only for fields calibrated on our annotated test set. None is calibrated yet, so no band is shown.
What counts as a claim ›How we measure confidence ›How we check this ›
Are you an author, or do you see a problem with this page? Request a review
