

The DOI matches its Crossref record; 12 of the 12 references it cites were found in a registry or an index.
Transcript length bias in RNA-seq data confounds systems biology
Open accessAbstract
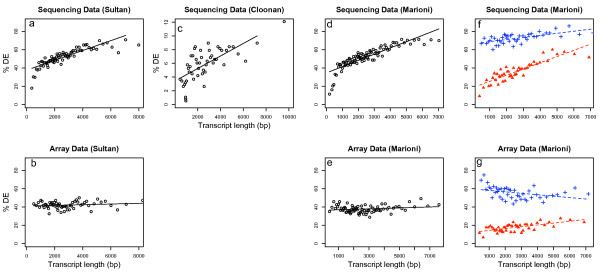
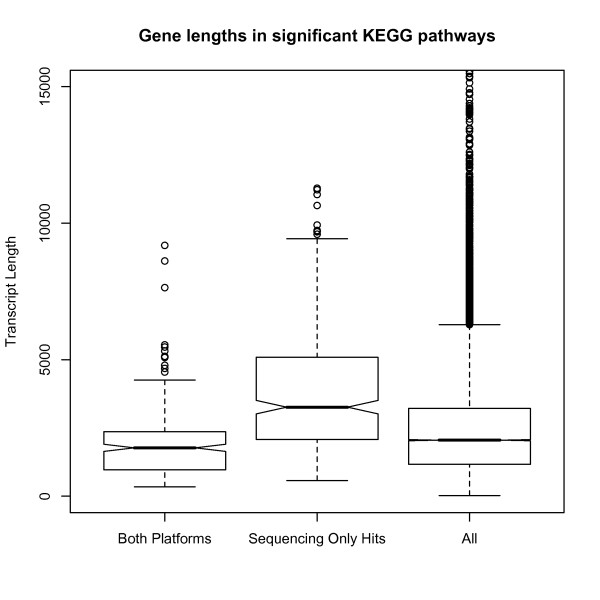
BACKGROUND: Several recent studies have demonstrated the effectiveness of deep sequencing for transcriptome analysis (RNA-seq) in mammals. As RNA-seq becomes more affordable, whole genome transcriptional profiling is likely to become the platform of choice for species with good genomic sequences. As yet, a rigorous analysis methodology has not been developed and we are still in the stages of exploring the features of the data. RESULTS: We investigated the effect of transcript length bias in RNA-seq data using three different published data sets. For standard analyses using aggregated tag counts for each gene, the ability to call differentially expressed genes between samples is strongly associated with the length of the transcript. CONCLUSION: Transcript length bias for calling differentially expressed genes is a general feature of current protocols for RNA-seq technology. This has implications for the ranking of differentially expressed genes, and in particular may introduce bias in gene set testing for pathway analysis and other multi-gene systems biology analyses. REVIEWERS: This article was reviewed by Rohan Williams (nominated by Gavin Huttley), Nicole Cloonan (nominated by Mark Ragan) and James Bullard (nominated by Sandrine Dudoit).
Overview
The claims and statistics of this paper haven’t been checked yet.
Run the check — free, no account needed. It reads the open-access text and checks the sources it cites.
Integrity signals
Registry
Cites
Statistics
Figures
Verification
Claims the paper makes
The claims and statistics of this paper haven’t been checked yet.
Run the check — free, no account needed. It reads the open-access text and checks the sources it cites.
Claims other papers make about this one
Each is checked against this paper’s own text: does it say what the citing paper says it does?
In the citing paper
“It should be noted that these estimates apply to the average gene expression level, but as dynamic ranges in RNA-seq data are large, the probability that highly expressed genes will be detected as differentially expressed is greater than that for low-count genes [192].”
From A survey of best practices for RNA-seq data analysis (2016) · cites this paper as [192]
Self-check
Percentages, sums and reported differences re-computed from the paper’s own numbers.
The self-check needs the paper’s full text.
Citations
Cites
Systematic and integrative analysis of large gene lists using DAVID bioinformatics resources
Huang, D. W., Sherman, B. T., & Lempicki, R. A. (2009) · Nature Protocols · doi:10.1038/nprot.2008.211 · Cited by 35,890 · cited 1×
“In each analysis we only used genes found on both platforms and then performed a pathway analysis using the DAVID software [7,8].”
MethodHuang, D. W., Sherman, B. T., & Lempicki, R. A. (2009) · Nucleic Acids Research · doi:10.1093/nar/gkn923 · Cited by 14,108 · cited 1×
“In each analysis we only used genes found on both platforms and then performed a pathway analysis using the DAVID software [7,8].”
MethodSmyth, G. K. (2004) · Statistical Applications in Genetics and Molecular Biology · doi:10.2202/1544-6115.1027 · Cited by 11,829
Exploration, normalization, and summaries of high density oligonucleotide array probe level data
Irizarry, R. A. (2003) · Biostatistics · doi:10.1093/biostatistics/4.2.249 · Cited by 10,603 · cited 1×
“array algorithm [9] but this suggestion requires further exploration and analysis.”
MethodAlternative isoform regulation in human tissue transcriptomes
Wang, E. T., Sandberg, R., Luo, S., Khrebtukova, I., Zhang, L., Mayr, C., Kingsmore, S. F., Schroth, G. P., & Burge, C. B. (2008) · Nature · doi:10.1038/nature07509 · Cited by 5,181
The Significance of Digital Gene Expression ProfilesPreprint
Audic, S., & Claverie, J. (1997) · Genome Research · doi:10.1101/gr.7.10.986 · Cited by 2,787 · cited 1×
“They then used a method based on the proportion of counts from each library proposed by Audic and Claverie [11] to determine the significant of differential expression.”
MethodRNA-seq: An assessment of technical reproducibility and comparison with gene expression arrays
Marioni, J. C., Mason, C. E., Mane, S. M., Stephens, M., & Gilad, Y. (2008) · Genome Research · doi:10.1101/gr.079558.108 · Cited by 2,771 · cited 7×
“For the data from Marioni et al (2008) genes were matched between the RNA-seq platform and the microarray platform.”
BackgroundMethodInfluentialSultan, M., Schulz, M. H., Richard, H., Magen, A., Klingenhoff, A., Scherf, M., Seifert, M., Borodina, T., Soldatov, A., Parkhomchuk, D., et al. (2008) · Science · doi:10.1126/science.1160342 · Cited by 1,293 · cited 3×
“The first data set compares sequencing from the Illumina Genome Analyzer with Illumina microarrays and looks for differential expression between a human embryonic kidney and B cell line [4].”
BackgroundMethodStem cell transcriptome profiling via massive-scale mRNA sequencing
Cloonan, N., Forrest, A. R. R., Kolle, G., Gardiner, B. B. A., Faulkner, G. J., Brown, M. K., Taylor, D. F., Steptoe, A. L., Wani, S., Bethel, G., et al. (2008) · Nature Methods · doi:10.1038/nmeth.1223 · Cited by 1,035 · cited 4×
“…a predictable consequence of the sampling process and cannot be corrected by dividing by length of the transcript (e.g. the statistical methods in Cloonan et al (2008) or Sultan et al. Differential expression as a function of transcript lengthFigu 1 Differential expression as a function of…”
MethodInfluentialStochastic Models Inspired by Hybridization Theory for Short Oligonucleotide Arrays
Wu, Z. J., & Irizarry, R. A. (2005) · Journal of Computational Biology · doi:10.1089/cmb.2005.12.882 · Cited by 266 · cited 1×
“By contrast, intensity measurements from microarrays are proportional only to the expression level of the transcript plus any features intrinsic to the probe itself such as GC content [2,3].”
Background
Cited by
Sorted by citations
Items 101–200 of 497
Fiorilli, V., Vallino, M., Biselli, C., Faccio, A., Bagnaresi, P., & Bonfante, P. (2015) · Frontiers in Plant Science · doi:10.3389/fpls.2015.00636 · Cited by 91
“The GOSEQ Bioconductor package was used to account for RNA length bias typical of RNA-seq approaches (Oshlack and Wakefield, 2009).”
MethodProtocol Dependence of Sequencing-Based Gene Expression Measurements
Raz, T., Kapranov, P., Lipson, D., Letovsky, S., Milos, P. M., & Thompson, J. F. (2011) · PLoS ONE · doi:10.1371/journal.pone.0019287 · Cited by 91
“For example, it has been previously noted [31] that differential expression differences are length dependent when determined via RNA Seq though not with microarrays.”
BackgroundIlut, D. C., Coate, J. E., Luciano, A. K., Owens, T. G., May, G. D., Farmer, A. D., & Doyle, J. J. (2012) · American Journal of Botany · doi:10.3732/ajb.1100312 · Cited by 91
Sugino, K., Clark, E., Schulmann, A., Shima, Y., Wang, L., Hunt, D. L., Hooks, B. M., Tränkner, D., Chandrashekar, J., Picard, S., et al. (2019) · eLife · doi:10.7554/elife.38619 · Cited by 89
Co-expression analysis of high-throughput transcriptome sequencing data with Poisson mixture models
Rau, A., Maugis-Rabusseau, C., Martin‐Magniette, M., & Celeux, G. (2015) · Bioinformatics · doi:10.1093/bioinformatics/btu845 · Cited by 96
“Finally, sequencing depth (i.e. the library size) and coverage vary between experiments, and read counts are known to be correlated with gene length (Łabaj et al. , 2011; Oshlack and Wakefield, 2009).”
BackgroundPyicos: a versatile toolkit for the analysis of high-throughput sequencing data
Althammer, S., González‐Vallinas, J., Ballaré, C., Beato, M., & Eyras, E. (2011) · Bioinformatics · doi:10.1093/bioinformatics/btr570 · Cited by 90
“However, they have been observed to produce length biases in the determination of DE genes (Oshlack and Wakefield, 2009).”
BackgroundLi, X., Brock, G. N., Rouchka, E. C., Cooper, N. G. F., Wu, D., O’Toole, T. E., Gill, R. S., Eteleeb, A. M., O’Brien, L., & Rai, S. N. (2017) · PLoS ONE · doi:10.1371/journal.pone.0176185 · Cited by 89
“TC, FPKM, RPKM and FQ are not suggested for use in DEG analysis due to multiple issues such as lowly expressed gene issue for TC, length correction bias for FPKM and RPKM, and potentially increasing the intra-condition variation by forcing all the samples to have identical distributions for FQ [18,20,22,23].”
BackgroundMethodTransformation and model choice for RNA-seq co-expression analysis
Rau, A., & Maugis-Rabusseau, C. (2016) · Briefings in Bioinformatics · doi:10.1093/bib/bbw128 · Cited by 85
“gene length) and read counts [8]; and (3) variable sequencing depth (i.”
BackgroundAnalysis of Whole Transcriptome Sequencing Data: Workflow and Software
Yang, I. S., & Kim, S. (2015) · Genomics & Informatics · doi:10.5808/gi.2015.13.4.119 · Cited by 84
“The above programs adopt one or more of the several available normalization methods (total count, upper quartile, median, DESeq normalization, trimmed mean of M values, quantile and RPKM normalization) to correct biases that may appear between samples (sequencing depth [33]) or within sample (gene length [46] and GC c…”
BackgroundPathways to understanding the extended phenotype of parasites in their hosts
Hughes, D. P. (2012) · Journal of Experimental Biology · doi:10.1242/jeb.077461 · Cited by 82
“Variation in transcript length between different genes can bias estimates of differential expression (Oshlack and Wakefield, 2009); for two genes that show the same fold change, the longer gene will be more statistically significant as it is supported by more reads.”
BackgroundArtifacts and biases of the reverse transcription reaction in RNA sequencing
Verwilt, J., Mestdagh, P., & Vandesompele, J. (2023) · RNA · doi:10.1261/rna.079623.123 · Cited by 84
Loraine, A. E., Blakley, I., Jagadeesan, S., Harper, J. F., Miller, G., & Firon, N. (2015) · Methods in molecular biology · doi:10.1007/978-1-4939-2444-8_24 · Cited by 78
Aghababazadeh, F. A., Li, Q., & Fridley, B. L. (2018) · PLoS ONE · doi:10.1371/journal.pone.0206312 · Cited by 83
Alonso‐Hearn, M., Canive, M., Vázquez, C. B., Torremocha, R., Balseiro, A., Amado, J., Varela-Martínez, E., Ramos, R., Jugo, B. M., & Casais, R. (2019) · Scientific Reports · doi:10.1038/s41598-019-51328-0 · Cited by 75
Application of next generation qPCR and sequencing platforms to mRNA biomarker analysis
Devonshire, A. S., Sanders, R., Wilkes, T. M., Taylor, M. S., Foy, C. A., & Huggett, J. F. (2012) · Methods · doi:10.1016/j.ymeth.2012.07.021 · Cited by 75
AGRONOMICS1: A New Resource for Arabidopsis Transcriptome Profiling
Rehrauer, H., Aquino, C., Gruissem, W., Henz, S. R., Hilson, P., Laubinger, S., Naouar, N., Patrignani, A., Rombauts, S., Shu, H., et al. (2009) · PLANT PHYSIOLOGY · doi:10.1104/pp.109.150185 · Cited by 72
Wilson, C. M., Rodríguez, M., Johnson, C. M., Martin, S., Chu, T., Wolfinger, R. D., Hauser, L., Land, M., Klingeman, D. M., Syed, M. H., et al. (2013) · Biotechnology for Biofuels · doi:10.1186/1754-6834-6-179 · Cited by 75
“In RNA-seq analyses distinct biases relate to the depth of sequencing, the length and GC content of genes, and mapping approach [39-42].”
Differential gene expression according to race and host plant in the pea aphid
Eyres, I., Jaquiéry, J., Sugio, A., Duvaux, L., Gharbi, K., Zhou, J., Legeai, F., Nelson, M., Simon, J., Smadja, C. M., et al. (2016) · Molecular Ecology · doi:10.1111/mec.13771 · Cited by 73
Differential expression analysis for RNAseq using Poisson mixed models
Sun, S., Hood, M. M., Scott, L. J., Peng, Q., Mukherjee, S., Tung, J., & Zhou, X. (2017) · Nucleic Acids Research · doi:10.1093/nar/gkx204 · Cited by 75
“However, gene length will affect the power of DE analysis across different genes: genes with longer length tend to have a larger number of mapped reads and more accurate expression measurements, and as a consequence, DE analysis on these genes tends to have higher statistical power (2,70,133).”
BackgroundWang, Z., Lyu, Z., Pan, L., Zeng, G., & Randhawa, P. S. (2019) · BMC Medical Genomics · doi:10.1186/s12920-019-0538-z · Cited by 70
Walsh, S. W., Mehta, J. P., McGettigan, P., Browne, J. A., Forde, N., Alibrahim, R. M., Mulligan, F. J., Loftus, B., Crowe, M. A., Matthews, D., et al. (2012) · Physiological Genomics · doi:10.1152/physiolgenomics.00178.2011 · Cited by 69
Determinants of expression variability
Alemu, E. Y., Carl, J. W., Bravo, H. C., & Hannenhalli, S. S. (2014) · Nucleic Acids Research · doi:10.1093/nar/gkt1364 · Cited by 70
“The overall increase in EV with the length and number of exons in a gene may suggest accumulated variability in processing long and multi-exonic transcripts, consistent with previously reported length bias in detection of differentially expressed genes (26).”
Biselli, C., Bagnaresi, P., Faccioli, P., Hu, X., Balcerzak, M., Mattera, M. G., Yan, Z., Ouellet, T., Cattivelli, L., & Valè, G. (2018) · Frontiers in Plant Science · doi:10.3389/fpls.2018.00037 · Cited by 64
“GOseq corrects for RNA length bias typical of RNA-Seq approaches (Oshlack and Wakefield, 2009).”
Review Application of RNA-seq to reveal the transcript profile in bacteria
Pinto, A. C., Melo-Barbosa, H. P., Miyoshi, A., Silva, A., & Azevedo, V. (2011) · Genetics and Molecular Research · doi:10.4238/vol10-3gmr1554 · Cited by 65
“For more detail, the following references can be consulted: Oshlack and Wakefield, 2009; Philippe et al., 2009; Bullard et al., 2010; Roberts et al., 2011.”
BackgroundRopka‐Molik, K., Żukowski, K., Eckert, R., Gurgul, A., Piórkowska, K., & Oczkowicz, M. (2014) · Animal Genetics · doi:10.1111/age.12184 · Cited by 65
“It may have been sequence-specific biases introduced during preparation of the library (Hansen et al. 2010) or sequence-specific biases associated with some fragments preference for sequencing (Oshlack & Wakefield 2009; Li et al. 2010; Pickreli et al. 2010) that led to uneven coverage.”
BackgroundSingle‐molecule direct RNA sequencing without cDNA synthesis
Ozsolak, F., & Milos, P. M. (2011) · Wiley Interdisciplinary Reviews - RNA · doi:10.1002/wrna.84 · Cited by 63
Bowman, M. J., Park, W., Bauer, P. J., Udall, J. A., Page, J. T., Raney, J. A., Scheffler, B. E., Jones, D. C., & Campbell, B. T. (2013) · PLoS ONE · doi:10.1371/journal.pone.0082634 · Cited by 62
“Very low read counts may exceed the level of accurate detection by the RT-qPCR or by other statistical methods [70–72].”
MethodCutoffs and k-mers: implications from a transcriptome study in allopolyploid plants
Gruenheit, N., Deusch, O., Eßer, C., Becker, M., Voelckel, C., & Lockhart, P. J. (2012) · BMC Genomics · doi:10.1186/1471-2164-13-92 · Cited by 62
“Such fragmented sequences are less useful for differential expression analyses as the statistical power is less for smaller sequences [48].”
BackgroundRecurrent functional misinterpretation of RNA-seq data caused by sample-specific gene length bias
Mandelboum, S., Manber, Z., Elroy‐Stein, O., & Elkon, R. (2019) · PLoS Biology · doi:10.1371/journal.pbio.3000481 · Cited by 60
“A well-known consequence of the fact that longer genes tend to get more counts than equally expressed shorter genes is overrepresentation of long genes among the ones that pass statistical tests for differential expression (termed “length bias”), because of the increased statistical power [12,13].”
BackgroundŻywicki, M., Bąkowska‐Żywicka, K., & Polacek, N. (2012) · Nucleic Acids Research · doi:10.1093/nar/gks020 · Cited by 61
“During this procedure, a preference for short molecules is observed (46).”
BackgroundMäder, U., Nicolas, P., Richard, H., Bessières, P., & Aymerich, S. (2010) · Current Opinion in Biotechnology · doi:10.1016/j.copbio.2010.10.003 · Cited by 62
Amplification-free digital gene expression profiling from minute cell quantities
Ozsolak, F., Ting, D. T., Wittner, B. S., Brannigan, B. W., Paul, S., Bardeesy, N. M., Ramaswamy, S., Milos, P. M., & Haber, D. A. (2010) · Nature Methods · doi:10.1038/nmeth.1480 · Cited by 59
A comparison of analog and Next-Generation transcriptomic tools for mammalian studies
Roy, N. C., Altermann, E., Park, Z. A., & McNabb, W. C. (2011) · Briefings in Functional Genomics · doi:10.1093/bfgp/elr005 · Cited by 58
“This means that longer genes have higher transcript counts and so, relative to shorter genes, are more likely to be found to be differentially expressed, particularly if the gene is also a lowly expressed one [67, 87].”
BackgroundHuggett, S. B., & Stallings, M. C. (2019) · Addiction Biology · doi:10.1111/adb.12719 · Cited by 56
Statistical methods on detecting differentially expressed genes for RNA-seq data
Chen, Z., Liu, J., Ng, H. K. T., Nadarajah, S., Kaufman, H. L., Yang, J. Y., & Deng, Y. (2011) · BMC Systems Biology · doi:10.1186/1752-0509-5-s3-s1 · Cited by 58
“Since it is usually more difficult to detect DEGs with low expression level for RNA-seq data [14], it is desirable to find powerful statistical tests for detecting low expression DEGs.”
BackgroundResultEmpirical bayes analysis of sequencing-based transcriptional profiling without replicates
Wu, Z. J., Jenkins, B. D., Rynearson, T. A., Dyhrman, S. T., Saito, M. A., Mercier, M. L., & Whitney, L. P. (2010) · BMC Bioinformatics · doi:10.1186/1471-2105-11-564 · Cited by 57
“For example, whole transcript analysis produces data with transcript length bias [1].”
BackgroundThe reproducibility of biomedical research: Sleepers awake!
Bustin, S. A. (2014) · Biomolecular Detection and Quantification · doi:10.1016/j.bdq.2015.01.002 · Cited by 61
Dual RNA-seq of the plant pathogen Phytophthora ramorum and its tanoak host
Hayden, K. J., Garbelotto, M. M., Knaus, B. J., Cronn, R., Rai, H., & Wright, J. W. (2014) · Tree Genetics & Genomes · doi:10.1007/s11295-014-0698-0 · Cited by 59
“Second, full-quantile normalization for transcript-level GC-content and length biases was performed within lanes using the R package EDASeq (Risso et al. 2011).”
MethodInfluentialDigital gene expression for non-model organismsPreprint
Hong, L. Z., Li, J., Schmidt‐Küntzel, A., Warren, W. C., & Barsh, G. S. (2011) · Genome Research · doi:10.1101/gr.122135.111 · Cited by 55
“Our results illustrate various strategies for making tag to gene assignments, and reveal gene expression signatures that provide new biologic insight into pigment patterning in a non-model organism.”
BackgroundRobust transcriptional signatures for low-input RNA samples based on relative expression orderings
Liu, H., Li, Y., He, J., Guan, Q., Chen, R., Yan, H., Zheng, W., Song, K., Cai, H., Guo, Y., et al. (2017) · BMC Genomics · doi:10.1186/s12864-017-4280-7 · Cited by 54
Statistical and Bioinformatics Analysis of Data from Bulk and Single-Cell RNA Sequencing Experiments
Yu, X., Aghababazadeh, F. A., Chen, Y. A., & Fridley, B. L. (2020) · Methods in molecular biology · doi:10.1007/978-1-0716-0849-4_9 · Cited by 55
“However, it has been shown that scaling by gene length cannot entirely remove the positive association between gene size and read counts, and can introduce new biases to the estimates of differential expression [45, 60].”
BackgroundExcess ribosomal protein production unbalances translation in a model of Fragile X Syndrome
Seo, S. S., Louros, S. R., Anstey, N. J., Gonzalez‐Lozano, M. A., Harper, C. B., Verity, N., Dando, O., Thomson, S. R., Darnell, J. C., Kind, P. C., et al. (2022) · Nature Communications · doi:10.1038/s41467-022-30979-0 · Cited by 54
Maden, S. K., Kwon, S. H., Huuki-Myers, L. A., Collado‐Torres, L., Hicks, S. C., & Maynard, K. R. (2023) · Genome biology · doi:10.1186/s13059-023-03123-4 · Cited by 58
Jarid2 regulates hematopoietic stem cell function by acting with polycomb repressive complex 2
Kinkel, S., Galeev, R., Flensburg, C., Keniry, A., Breslin, K. A., Gilan, O., Lee, S. C.-W., Liu, J. J., Chen, K., Gearing, L. J., et al. (2015) · Blood · doi:10.1182/blood-2014-10-603969 · Cited by 54
“Although 14 genes were significantly upregulated in both comparisons, a simple overlap test is biased as a result of each knockdown being compared with the same control samples and because highly expressed genes have increased power to detect differential expression.(42) Therefore, to study the correlation between the…”
ResultSelf-citationUncovering RNA Editing Sites in Long Non-Coding RNAs
Picardi, E., D’Erchia, A. M., Gallo, A., Montalvo, A., & Pesole, G. (2014) · Frontiers in Bioengineering and Biotechnology · doi:10.3389/fbioe.2014.00064 · Cited by 54
“Indeed, low quality reads lead to numerous non-canonical RNA editing sites while very short reads ( 50 nucleotides) are prone to misalignments (Oshlack and Wakefield, 2009).”
High-Resolution Transcriptome Analysis with Long-Read RNA Sequencing
Cho, H., Davis, J. R., Li, X., Smith, K. S., Battle, A. J., & Montgomery, S. B. (2014) · PLoS ONE · doi:10.1371/journal.pone.0108095 · Cited by 53
“countered with appropriate normalization methods [13,14], the inability of short reads to effectively disambiguate fragments from”
MethodLi, M., Sun, W., Wang, F., Wu, X., & Wang, J. (2021) · New Phytologist · doi:10.1111/nph.17621 · Cited by 49
Kogelman, L. J. A., Christensen, R. E., Pedersen, S. H., Bertalan, M., Hansen, T. F., Jansen‐Olesen, I., & Olesen, J. (2017) · Neuroscience · doi:10.1016/j.neuroscience.2017.03.027 · Cited by 52
“GOseq corrects for the transcript length bias, as it has been shown that there is a higher probability of detecting genes to be DE in case they are longer and in consequence have more reads (Oshlack and Wakefield, 2009).”
BackgroundConstruction and Optimization of a Large Gene Coexpression Network in Maize Using RNA-Seq Data
Huang, J., Vendramin, S., Shi, L., & McGinnis, K. M. (2017) · PLANT PHYSIOLOGY · doi:10.1104/pp.17.00825 · Cited by 51
Length bias correction for RNA-seq data in gene set analyses
Gao, L., Fang, Z., Zhang, K., Zhi, D., & Cui, X. (2011) · Bioinformatics · doi:10.1093/bioinformatics/btr005 · Cited by 50
“As pointed out previously (Bullard et al., 2010; Oshlack and Wakefield, 2009), the percentage of differentially expressed genes identified by this statistic has a positive correlation with the transcript length.”
BackgroundMethodInfluentialTraditional versus 3′ RNA-seq in a non-model species
Tandonnet, S., & Torres, T. T. (2016) · Genomics Data · doi:10.1016/j.gdata.2016.11.002 · Cited by 50
RNA-Seq Reveals Novel Transcriptional Reorganization in Human Alcoholic Brain
Farris, S. P., & Dayne Mayfield, R. (2014) · International Review of Neurobiology · doi:10.1016/b978-0-12-801105-8.00011-4 · Cited by 49
“Transcript length and guanine–cytosine content (GC content) are two particular characteristics that may influence the quan- tification of RNA-Seq data (Oshlack & Wakefield, 2009; Pickrell et al., 2010).”
Tyakht, A., Ilina, E. N., Alexeev, D. G., Ischenko, D. S., Gorbachev, A. Y., Semashko, T. A., Larin, A. K., Selezneva, O. V., Kostryukova, E., Karalkin, P. A., et al. (2014) · BMC Genomics · doi:10.1186/1471-2164-15-1108 · Cited by 53
“RNA-Seq analysis is inherently biased against profiling of short genes [12] could also contribute to these differences; however, the RPKM values for these snoRNA genes were not outlying (Additional file 10: Figure S2).”
O’Loughlin, A., Lynn, D. J., McGee, M., Doyle, S., McCabe, M. S., & Earley, B. (2012) · BMC Genomics · doi:10.1186/1471-2164-13-250 · Cited by 49
“Differential expression in RNA-seq data was calculated based on the number of reads aligning to a gene, thus there was greater statistical power to detect longer genes as significantly differentially expressed than shorter genes [27].”
MethodSebastiani, M. S., Bagnaresi, P., Sestili, S., Biselli, C., Zechini, A., Orrù, L., Cattivelli, L., & Ficcadenti, N. (2017) · Frontiers in Plant Science · doi:10.3389/fpls.2017.00362 · Cited by 49
“The goseq bioconductor package (Robinson and Oshlack, 2010) was used to account for RNA length bias typical of RNA-Seq approaches (Oshlack and Wakefield, 2009).”
MethodTorang, A., Gupta, P., & Klinke, D. J. (2019) · BMC Bioinformatics · doi:10.1186/s12859-019-2994-z · Cited by 63
Zarka, M., Étienne, F., Bourmaud, M., Szondi, D. C., Schwartz, J., Kampmann, K., Hélary, C., Rannou, F., Haÿ, E., & Cohen-Solal, M. E. (2021) · Laboratory Investigation · doi:10.1038/s41374-021-00668-5 · Cited by 52
Dong, X., Tian, L., Gouil, Q. A., Kariyawasam, H., Su, S., Paoli‐Iseppi, R. D., Prawer, Y. D. J., Clark, M. B., Breslin, K. A., Iminitoff, M., et al. (2021) · NAR Genomics and Bioinformatics · doi:10.1093/nargab/lqab028 · Cited by 43
“As a consequence, DGE analyses are biased towards the detection of genes (or transcripts) that are relatively long (42).”
BackgroundSpatial Transcriptomics: Molecular Maps of the Mammalian Brain
Ortiz, C., Carlén, M., & Meletis, K. (2021) · Annual Review of Neuroscience · doi:10.1146/annurev-neuro-100520-082639 · Cited by 48
Zeevi, D., Sharon, E., Lotan‐Pompan, M., Lubling, Y., Shipony, Z., Raveh-Sadka, T., Keren, L., Levo, M., Weinberger, A., & Segal, E. (2011) · Genome Research · doi:10.1101/gr.119669.110 · Cited by 47
Wolfien, M., Rimmbach, C., Schmitz, U., Jung, J., Krebs, S., Steinhoff, G., David, R., & Wolkenhauer, O. (2016) · BMC Bioinformatics · doi:10.1186/s12859-015-0873-9 · Cited by 49
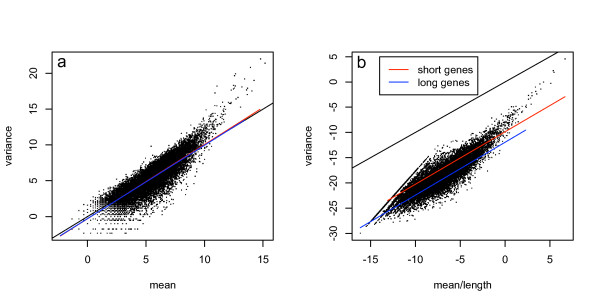
“Especially when using Cufflinks, it has been shown that DE analysis attempting to correct for differences in gene length have the tendency of introducing a bias in the per gene variances, in particular for lowly expressed genes [52].”
MethodSiebert, S., Robinson, M. D., Tintori, S., Goetz, F., Helm, R. R., Smith, S. A., Shaner, N. C., Haddock, S. H. D., & Dunn, C. W. (2011) · PLoS ONE · doi:10.1371/journal.pone.0022953 · Cited by 45
“The number of mRNA-Seq reads is therefore related to gene length as well as expression [24].”
BackgroundExpressionPlot: a web-based framework for analysis of RNA-Seq and microarray gene expression data
Friedman, B. A., & Maniatis, T. (2011) · Genome biology · doi:10.1186/gb-2011-12-7-r69 · Cited by 45
“Action buttons allow for the export of the table into other software, such as R or OpenOffice (or Excel), for automatic conversion of the genes into other IDs (such as Ensembl or Entrez), and for the automatic generation of expression-controlled background sets of similarly expressed but unchanged genes (in terms of e…”
MethodBaldoni, E., Bagnaresi, P., Locatelli, F., Mattana, M., & Genga, A. (2016) · Rice · doi:10.1186/s12284-016-0098-1 · Cited by 44
“The goseq bioconductor package (Robinson and Oshlack 2010) was used to account for the RNA length bias that is typical of RNA-Seq approaches (Oshlack and Wakefield 2009).”
MethodSingh, G., Armaleo, D., Grande, F. D., & Schmitt, I. (2021) · Biomolecules · doi:10.3390/biom11101445 · Cited by 45
Post-translational buffering leads to convergent protein expression levels between primates
Wang, S. H., Hsiao, C. J., Khan, Z., & Pritchard, J. K. (2018) · Genome biology · doi:10.1186/s13059-018-1451-z · Cited by 42
Challenges in detecting and quantifying intron retention from next generation sequencing data
Broséus, L., & Ritchie, W. (2020) · Computational and Structural Biotechnology Journal · doi:10.1016/j.csbj.2020.02.010 · Cited by 43
“Most computational approaches however will introduce a selection bias as only introns with sufficient coverage can be detected and the statistical power required to detect differences between conditions increases with coverage depth and the read count [48,49].”
BackgroundFanidis, D., & Moulos, P. (2020) · Briefings in Bioinformatics · doi:10.1093/bib/bbaa156 · Cited by 41
Swindell, W. R., Xing, X., Voorhees, J. J., Elder, J. T., Johnston, A., & Gudjonsson, J. E. (2014) · Physiological Genomics · doi:10.1152/physiolgenomics.00022.2014 · Cited by 42
Raman, A. T., Pohodich, A. E., Wan, Y., Yalamanchili, H. K., Lowry, W. E., Zoghbi, H. Y., & Liu, Z. (2018) · Nature Communications · doi:10.1038/s41467-018-05627-1 · Cited by 42
Statistical Analyses of Next Generation Sequence Data: A Partial Overview
Datta, S., Datta, S., Kim, S., Chakraborty, S., & Gill, R. S. (2010) · Journal of Proteomics & Bioinformatics · doi:10.4172/jpb.1000138 · Cited by 41
Inference of the human polyadenylation code
Leung, M. K. K., Delong, A., & Frey, B. J. (2018) · Bioinformatics · doi:10.1093/bioinformatics/bty211 · Cited by 44
“For example, normalized read counts are often used, but quantification can be affected by factors such as sequencing biases, transcript length and RNA decay (Gallego Romero et al., 2014; Oshlack and Wakefield, 2009).”
BackgroundQuantitative Transcriptomics using Designed Primer-based Amplification
Bhargava, V., Ko, P., Willems, E., Mercola, M. A., & Subramaniam, S. (2013) · Scientific Reports · doi:10.1038/srep01740 · Cited by 40
Smart Approach for the Design of Highly Selective Aptamer-Based Biosensors
Douaki, A., Garoli, D., Inam, A. K. M. S., Angeli, M. A. C., Cantarella, G., Rocchia, W., Wang, J., Petti, L., & Lugli, P. (2022) · Biosensors · doi:10.3390/bios12080574 · Cited by 40
Hart, C. E., Lipson, D., Ozsolak, F., Raz, T., Steinmann, K. E., Thompson, J. F., & Milos, P. M. (2010) · Methods in enzymology on CD-ROM/Methods in enzymology · doi:10.1016/s0076-6879(10)72002-4 · Cited by 45
S-MART, A Software Toolbox to Aid RNA-seq Data Analysis
Zytnicki, M., & Quesneville, H. (2011) · PLoS ONE · doi:10.1371/journal.pone.0025988 · Cited by 39
“Oshlack and Wakefield have also shown that this method is biased because the longest genes tend to be more significantly differentially expressed, simply as a result of matching more reads, thereby increasing the power of the test [14].”
MethodLength Bias Correction in Gene Ontology Enrichment Analysis Using Logistic Regression
Mi, G., Di, Y., Emerson, S., Cumbie, J. S., & Chang, J. H. (2012) · PLoS ONE · doi:10.1371/journal.pone.0046128 · Cited by 39
“This assumption is not statistically verifiable, but both [9] and [10] cited evidence from microarray studies to support this assumption.”
BackgroundResultRobinson, D. G., Wang, J. Y., & Storey, J. D. (2015) · Nucleic Acids Research · doi:10.1093/nar/gkv636 · Cited by 38
“However, ranking by statistical significance has been noted to lead to a confounding effect in RNA-Seq, where highly-expressed or high-depth gene sets are spuriously marked as significant (26,27).”
BackgroundGaric, A., Berres, M. E., & Smith, S. M. (2014) · Alcoholism Clinical and Experimental Research · doi:10.1111/acer.12457 · Cited by 38
“However, RPKM introduces significant bias in pergene variances (Oshlack and Wakefield, 2009), and this bias is exceptional, especially for low-abundance transcripts, prompting the recommendation to abandon RPKM normalization altogether (Dillies et al., 2013).”
BackgroundXu, T., Guo, X., Wang, H., Hao, F., Du, X., Gao, X., & Liu, D. (2013) · Gene · doi:10.1016/j.gene.2013.01.068 · Cited by 39
Cavaiuolo, M., Cocetta, G., Spadafora, N. D., Müller, C. T., Rogers, H. J., & Ferrante, A. (2017) · PLoS ONE · doi:10.1371/journal.pone.0178119 · Cited by 37
Boneva, S., Schlecht, A., Böhringer, D., Mittelviefhaus, H., Reinhard, T., Agostini, H. T., Auw‐Haedrich, C., Schlunck, G., Wolf, J., & Lange, C. (2020) · Laboratory Investigation · doi:10.1038/s41374-020-0446-z · Cited by 36
Rallapalli, G., Kemen, E. M., Robert‐Seilaniantz, A., Segonzac, C., Etherington, G., Sohn, K. H., MacLean, D., & Jones, J. D. G. (2014) · BMC Genomics · doi:10.1186/1471-2164-15-341 · Cited by 34
“NGS transcriptome sequencing methods are broadly referred to as RNA-seq methods and have also been used for differential gene expression analysis [18].”
BackgroundInfluentialTorres-Oliva, M., Almudí, I., McGregor, A. P., & Posnien, N. (2016) · BMC Genomics · doi:10.1186/s12864-016-2646-x · Cited by 35
“to appear as differentially expressed if RPKM values are used to assess the statistical significance [35, 37, 47–49].”
BackgroundMoreno, C. M., Lin, Y., Davies, S. W., Monbureau, E., Cassar, N., & Marchetti, A. (2017) · Polar Biology · doi:10.1007/s00300-017-2228-7 · Cited by 35
“RPKM takes into consideration two biases from Illumina sequencing runs: library size and gene length; however, it has been shown that normalizing gene expression by gene length can introduce a bias toward less expressed genes (Oshlack and Wakefield 2009).”
Cornman, R. S., Bennett, A. K., Murray, K. D., Evans, J. D., Elsik, C. G., & Aronstein, K. (2012) · BMC Genomics · doi:10.1186/1471-2164-13-285 · Cited by 34
Farris, S., Wang, Y., Ward, J. M., & Dudek, S. M. (2017) · Frontiers in Molecular Neuroscience · doi:10.3389/fnmol.2017.00185 · Cited by 33
“, 2015), transcript length (Oshlack and Wakefield, 2009) and GC nucleotide content (Lahens et al.”
BackgroundDifferential transcript usage analysis of bulk and single-cell RNA-seq data with DTUrtle
Tekath, T., & Dugas, M. (2021) · Bioinformatics · doi:10.1093/bioinformatics/btab629 · Cited by 32
“A more DTU relevant bias is resulting from a varying length of the single annotated transcripts (Oshlack and Wakefield, 2009).”
BackgroundEstimation of Alternative Splicing isoform Frequencies from RNA-Seq Data
Nicolae, M., Mangul, S., Măndoiu, I., & Zelikovsky, A. (2010) · Lecture notes in computer science · doi:10.1007/978-3-642-15294-8_17 · Cited by 38
A survey of statistical software for analysing RNA-seq data
Gao, D., Kim, J., Kim, H., Phang, T. L., Selby, H. M., Tan, A. C., & Tong, T. (2010) · Human Genomics · doi:10.1186/1479-7364-5-1-56 · Cited by 32
“It was noticed that the observed number of reads for a gene depends on the expression level and the length of the gene, and also on the RNA composition of the sample.(6,7) The purpose of the normalisation is to minimise the influences of gene length and total sample RNA composition so that the normalised read counts r…”
BackgroundDifferential expression analysis for paired RNA-seq data
Chung, L. M., Ferguson, J. P., Zheng, W., Qian, F., Bruno, V. M., Montgomery, R. R., & Zhao, H. (2013) · BMC Bioinformatics · doi:10.1186/1471-2105-14-110 · Cited by 32
“On the other hand, the gene sets detected by the existing approaches show a bias towards longer transcripts, as has been noted in the literature before [48,49].”
BackgroundJellyfish Bioactive Compounds: Methods for Wet-Lab Work
Frazão, B., & Antunes, A. (2016) · Marine Drugs · doi:10.3390/md14040075 · Cited by 36
“In the work of Tulin et al. [109], the RNAseq Library was prepared with the ScriptSeq™ v2 kit using Phusion High Fidelity polymerase with bar-coded illumina-compatible primers.”
BackgroundInfluentialHow does normalization impact RNA-seq disease diagnosis?
Han, H., & Men, K. (2018) · Journal of Biomedical Informatics · doi:10.1016/j.jbi.2018.07.016 · Cited by 32
Bi, Y., & Davuluri, R. V. (2013) · BMC Bioinformatics · doi:10.1186/1471-2105-14-262 · Cited by 30
“For example, it has been empirically observed that quantification of expression depends on the length of the biological features under study (genes, transcripts, or exons), as longer features tend to have more significant statistics than shorter ones [45].”
BackgroundWesołowski, S., Birtwistle, M. R., & Rempała, G. A. (2013) · Biosensors · doi:10.3390/bios3030238 · Cited by 30
“This is consistent with the well-known fact that there is a length bias for detecting differential expression in RNA-seq experiments [22,23], which could possibly interfere with the information sharing across transcripts in the EBArrays model.”
BackgroundDeep sequencing transcriptional fingerprinting of rice kernels for dissecting grain quality traits
Biselli, C., Bagnaresi, P., Cavalluzzo, D., Urso, S., Desiderio, F., Orasen, G., Gianinetti, A., Righettini, F., Gennaro, M. C., Perrini, R., et al. (2015) · BMC Genomics · doi:10.1186/s12864-015-2321-7 · Cited by 30
“The goseq bioconductor package was employed since it was developed to account for RNA length bias typical of RNA-Seq approaches [105, 106].”
MethodTranscriptomics for Clinical and Experimental Biology Research: Hang on a Seq
Stokes, T., Cen, H. H., Kapranov, P., Gallagher, I. J., Pitsillides, A. A., Volmar, C., Kraus, W. E., Johnson, J. D., Phillips, S. M., Wahlestedt, C., et al. (2023) · Advanced Genetics · doi:10.1002/ggn2.202200024 · Cited by 28
Wei, G., Hu, G.-Q., Cui, K.-R., & Zhao, K.-J. (2012) · Methods in Enzymology · doi:10.1016/b978-0-12-391938-0.00013-6 · Cited by 28
Global Approaches to the Role of miRNAs in Drug-Induced Changes in Gene Expression
Eipper-Mains, J. E., Eipper, B. A., & Mains, R. E. (2012) · Frontiers in Genetics · doi:10.3389/fgene.2012.00109 · Cited by 28
“The density of sequence reads varies along the length of a transcript, indicating the existence of sequence bias at some point during the library preparation or sequencing process (Fu et al., 2009; Oshlack and Wakefield, 2009).”
BackgroundDapas, M., Kandpal, M., Bi, Y., & Davuluri, R. V. (2016) · Briefings in Bioinformatics · doi:10.1093/bib/bbw016 · Cited by 28
Metadata
- Authors
- Oshlack, A., & Wakefield, M. J.
- Affiliations
- Walter and Eliza Hall Institute of Medical Research (AU)
- Corresponding author
- Oshlack, Alicia
- Venue
- Biology Direct
- Published
- 2009
- Volume
- 4
- Issue
- 1
- Pages
- 14
- ISSN
- 1745-6150 (ISSN-L)
- PMC
- PMC2678084
- OpenAlex
- W2114504176
- Cited by
- 497
- References
- 12
- Citations by year
- 2026: 6 · 2025: 8 · 2024: 16 · 2023: 14 · 2022: 24 · 2021: 35 · 2020: 12 · 2019: 29 · 2018: 30 · 2017: 36 · 2016: 33 · 2015: 39 · 2014: 39 · 2013: 37 · 2012: 44
- FWCI
- 18.63
- Type
- journal article
- Language
- en
- Open access
- gold
- doi.org
- Licence
- cc-by
- Locations
- Biology Direct (publishedVersion, cc-by)
- PubMed Central (publishedVersion, cc-by)
- PubMed (publishedVersion)
- Minerva Access (University of Melbourne) (submittedVersion, cc-by)
- DOAJ (DOAJ: Directory of Open Access Journals) (submittedVersion)
- Topics
- Life Sciences › Biochemistry, Genetics and Molecular Biology › Molecular Biology › Genomics and Phylogenetic Studies
- Life Sciences › Biochemistry, Genetics and Molecular Biology › Molecular Biology › Gene expression and cancer classification
- Life Sciences › Biochemistry, Genetics and Molecular Biology › Molecular Biology › Bioinformatics and Genomic Networks
- Keywords
- RNA-seq, differentially expressed genes, gene expression profiling, pathway analysis, systems biology
- MeSH terms
- Base Sequence, Humans, RNA, Messenger, Transcription, Genetic, Bias, Oligonucleotide Array Sequence Analysis, Gene Expression Profiling, Systems Biology
About these checks
Registry, retraction, Cites and statistics results are computed, not judged, with one exception: a printed reference that no index lists is read once by a model before it counts as a citation error. Claims are extracted by a model and kept only when their quote appears verbatim in the text; each cited source is then checked, with a model’s help, for whether it says what the claim relies on. Those verdicts can be wrong — read the claim’s quote and the cited source before relying on one.
Statistics and arithmetic are recomputed, not judged.
Confidence bands are shown only for fields calibrated on our annotated test set. None is calibrated yet, so no band is shown.
What counts as a claim ›How we measure confidence ›How we check this ›
Are you an author, or do you see a problem with this page? Request a review
