

The DOI matches its Crossref record; 1 of the 1 references it cites were found in a registry or an index.
Endogenously regulated Dab2 worsens inflammatory injury in experimental autoimmune encephalomyelitis
Overview
The claims and statistics of this paper haven’t been checked yet.
Run the check — free, no account needed. It reads the open-access text and checks the sources it cites.
Integrity signals
Registry
Cites
Statistics
Figures
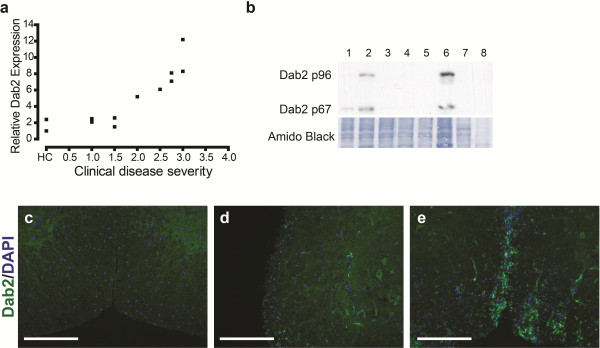
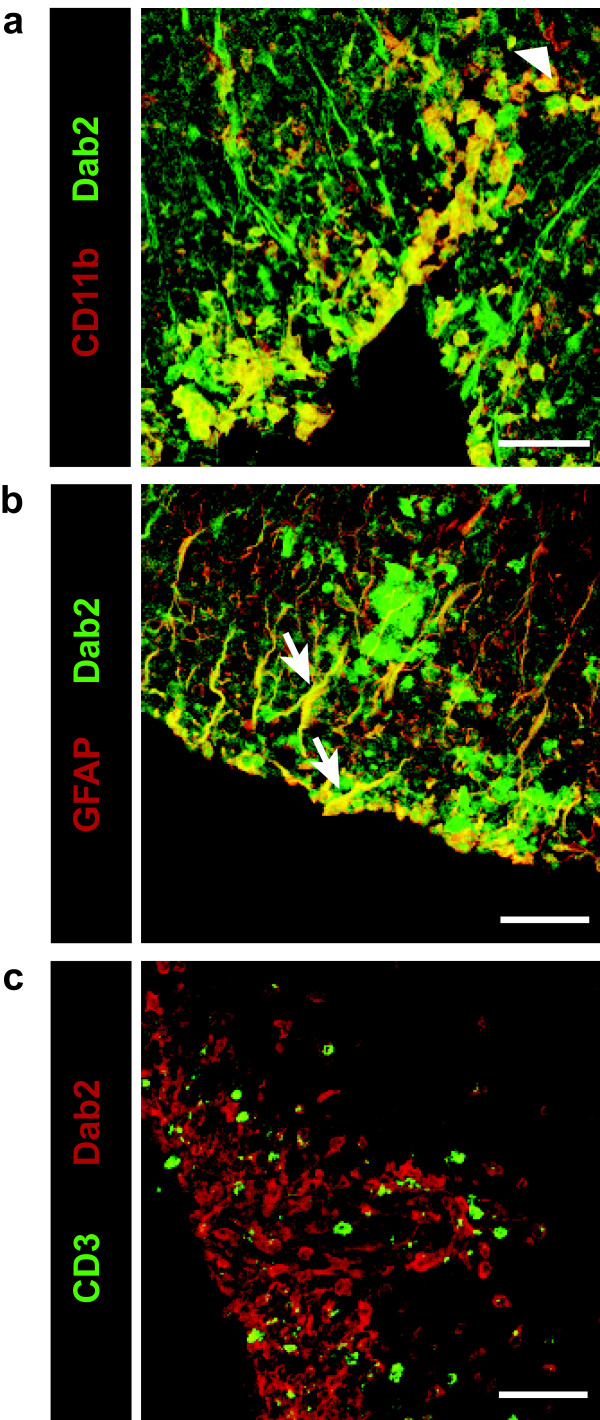
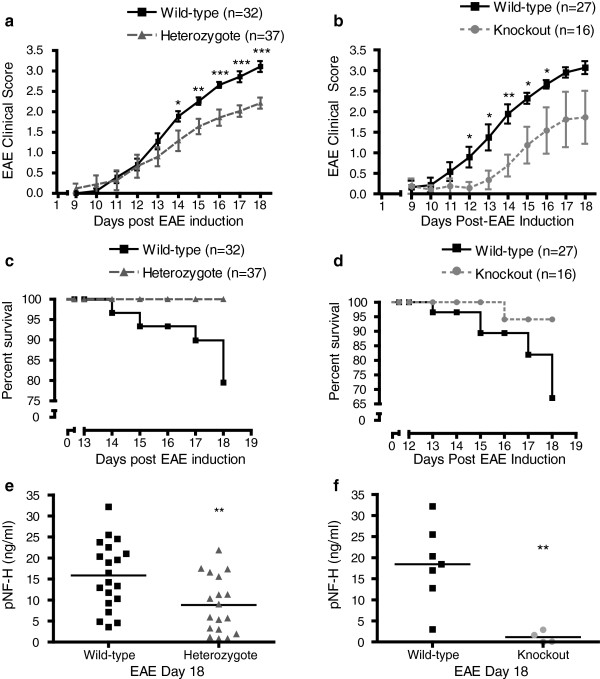
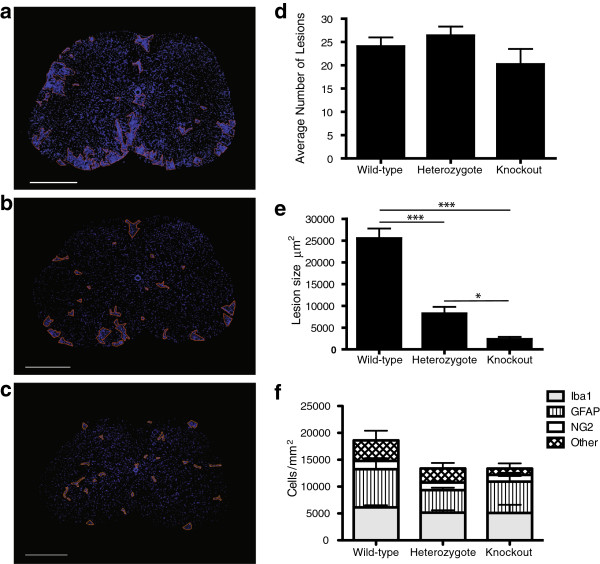
Verification
Claims the paper makes
The claims and statistics of this paper haven’t been checked yet.
Run the check — free, no account needed. It reads the open-access text and checks the sources it cites.
Claims other papers make about this one
Each is checked against this paper’s own text: does it say what the citing paper says it does?
The source backs part of the claim, not all of it — or backs it for a different population, condition or comparison.
In the citing paper
“The functions of Dab2 in macrophages were suggested to promote inflammation in brain (Jokubaitis et al., 2013), adipose tissue (Adamson et al., 2016), rat spinal cord injury (Ahn et al., 2011, 2015), and central nervous system (Moon et al., 2005).”
From Endocytosis and Physiology: Insights from Disabled-2 Deficient Mice (2016) · cites this paper as Jokubaitis et al., 2013
Experimental — accuracy not yet measured
Self-check
Percentages, sums and reported differences re-computed from the paper’s own numbers.
The self-check needs the paper’s full text.
Citations
Cites
Disabled‐2 exhibits the properties of a cargo‐selective endocytic clathrin adaptor
Mishra, S. K., Keyel, P. A., Hawryluk, M. J., Agostinelli, N. R., Watkins, S. C., & Traub, L. M. (2002) · The EMBO Journal · doi:10.1093/emboj/cdf487 · Cited by 302
Research works printed but not linked: 48
- Lucchinetti C, Bruck W, Parisi J, Scheithauer B, Rodriguez M, Lassmann H: A quantitative analysis of oligodendrocytes in multiple sclerosis lesions. A study of 113 cases. Brain 1999,122(Pt 12):2279–2295. · DOI · Paper page
- Bjartmar C, Wujek JR, Trapp BD: Axonal loss in the pathology of MS: consequences for understanding the progressive phase of the disease. J Neurol Sci 2003,206(2):165–171. 10.1016/S0022-510X(02)00069-2 · DOI · Paper page
- Trapp BD, Peterson J, Ransohoff RM, Rudick R, Mork S, Bo L: Axonal transection in the lesions of multiple sclerosis. N Engl J Med 1998,338(5):278-.. 10.1056/NEJM199801293380502 · DOI · Paper page
- Gertler FB, Bennett RL, Clark MJ, Hoffmann FM: Drosophila abl tyrosine kinase in embryonic CNS axons: a role in axonogenesis is revealed through dosage-sensitive interactions with disabled. Cell 1989,58(1):103–113. 10.1016/0092-8674(89)90407-8 · DOI · Paper page
- Howell BW, Gertler FB, Cooper JA: Mouse disabled (mDab1): a Src binding protein implicated in neuronal development. Embo J 1997,16(1):121–132. 10.1093/emboj/16.1.121 · DOI · Paper page
- Becker KG, Mattson DH, Powers JM, Gado AM, Biddison WE: Analysis of a sequenced cDNA library from multiple sclerosis lesions. J Neuroimmunol 1997,77(1):27–38. 10.1016/S0165-5728(97)00045-3 · DOI
- Fazili Z, Sun W, Mittelstaedt S, Cohen C, Xu XX: Disabled-2 inactivation is an early step in ovarian tumorigenicity. Oncogene 1999,18(20):3104–3113. 10.1038/sj.onc.1202649 · DOI · Paper page
- Morris SM, Tallquist MD, Rock CO, Cooper JA: Dual roles for the Dab2 adaptor protein in embryonic development and kidney transport. Embo J 2002,21(7):1555–1564. 10.1093/emboj/21.7.1555 · DOI · Paper page
- Xu XX, Yang W, Jackowski S, Rock CO: Cloning of a novel phosphoprotein regulated by colony-stimulating factor 1 shares a domain with the drosophila disabled gene product. J Biol Chem 1995,270(23):14184–14191. 10.1074/jbc.270.23.14184 · DOI · Paper page
- Maurer ME, Cooper JA: Endocytosis of megalin by visceral endoderm cells requires the Dab2 adaptor protein. J Cell Sci 2005,118(Pt 22):5345–5355. · DOI
- Yang DH, Smith ER, Roland IH, Sheng Z, He J, Martin WD, Hamilton TC, Lambeth JD, Xu XX: Disabled-2 is essential for endodermal cell positioning and structure formation during mouse embryogenesis. Dev Biol 2002,251(1):27–44. 10.1006/dbio.2002.0810 · DOI · Paper page
- Morris SM, Cooper JA: Disabled-2 colocalizes with the LDLR in clathrin-coated pits and interacts with AP-2. Traffic 2001,2(2):111–123. 10.1034/j.1600-0854.2001.020206.x · DOI · Paper page
- Rosenbauer F, Kallies A, Scheller M, Knobeloch KP, Rock CO, Schwieger M, Stocking C, Horak I: Disabled-2 is transcriptionally regulated by ICSBP and augments macrophage spreading and adhesion. Embo J 2002,21(3):211–220. 10.1093/emboj/21.3.211 · DOI · Paper page
- Moon C, Lee J, Ahn M, Shin T: Involvement of disabled-2 protein in the central nervous system inflammation following experimental cryoinjury of rat brains. Neurosci Lett 2005,378(2):88–91. 10.1016/j.neulet.2004.12.016 · DOI · Paper page
- Gresle MM, Shaw G, Jarrott B, Alexandrou EN, Friedhuber A, Kilpatrick TJ, Butzkueven H: Validation of a novel biomarker for acute axonal injury in experimental autoimmune encephalomyelitis. J Neurosci Res 2008,86(16):3548–3555. 10.1002/jnr.21803 · DOI
- Herrero-Herranz E, Pardo LA, Gold R, Linker RA: Pattern of axonal injury in murine myelin oligodendrocyte glycoprotein induced experimental autoimmune encephalomyelitis: implications for multiple sclerosis. Neurobiol Dis 2008,30(2):162–173. 10.1016/j.nbd.2008.01.001 · DOI
- Krishnamoorthy G, Saxena A, Mars LT, Domingues HS, Mentele R, Ben-Nun A, Lassmann H, Dornmair K, Kurschus FC, Liblau RS, Wekerle H: Myelin-specific T cells also recognize neuronal autoantigen in a transgenic mouse model of multiple sclerosis. Nat Med 2009,15(6):626–632. 10.1038/nm.1975 · DOI
- Kim SU, de Vellis J: Microglia in health and disease. J Neurosci Res 2005,81(3):302–313. 10.1002/jnr.20562 · DOI
- Muzio L, Martino G, Furlan R: Multifaceted aspects of inflammation in multiple sclerosis: the role of microglia. J Neuroimmunol 2007,191(1–2):39–44. · DOI
- Prunier C, Howe PH: Disabled-2 (Dab2) is required for transforming growth factor beta-induced epithelial to mesenchymal transition (EMT). J Biol Chem 2005,280(17):17540–17548. 10.1074/jbc.M500974200 · DOI · Paper page
- Jain N, Nguyen H, Friedline RH, Malhotra N, Brehm M, Koyanagi M, Bix M, Cooper JA, Chambers CA, Kang J: Cutting edge: Dab2 is a FOXP3 target gene required for regulatory T cell function. J Immunol 2009,183(7):4192–4196. 10.4049/jimmunol.0902041 · DOI · Paper page
- Zhuang Y, Gudas LJ: Overexpression of COUP-TF1 in murine embryonic stem cells reduces retinoic acid-associated growth arrest and increases extraembryonic endoderm gene expression. Differentiation 2008,76(7):760–771. 10.1111/j.1432-0436.2007.00258.x · DOI
- Chlon TM, Taffany DA, Welsh J, Rowling MJ: Retinoids modulate expression of the endocytic partners megalin, cubilin, and disabled-2 and uptake of vitamin D-binding protein in human mammary cells. J Nutr 2008,138(7):1323–1328. · DOI
- Kuhlmann T, Lingfeld G, Bitsch A, Schuchardt J, Bruck W: Acute axonal damage in multiple sclerosis is most extensive in early disease stages and decreases over time. Brain 2002,125(Pt 10):2202–2212. · DOI
- Ahn M, Oh H, Lee W, Kim H, Moon C, Shin T: Immunohistochemical studies on disabled-2 protein in the spinal cords of rats with experimental autoimmune encephalomyelitis. Brain Res 2011, 1416: 51–60. · DOI
- Gibbons HM, Dragunow M: Microglia induce neural cell death via a proximity-dependent mechanism involving nitric oxide. Brain Res 2006,1084(1):1–15. 10.1016/j.brainres.2006.02.032 · DOI
- Merrill JE, Ignarro LJ, Sherman MP, Melinek J, Lane TE: Microglial cell cytotoxicity of oligodendrocytes is mediated through nitric oxide. J Immunol 1993,151(4):2132–2141. · DOI
- Acar G, Idiman F, Idiman E, Kirkali G, Cakmakci H, Ozakbas S: Nitric oxide as an activity marker in multiple sclerosis. J Neurol 2003,250(5):588–592. 10.1007/s00415-003-1041-0 · DOI
- Ibragic S, Sofic E, Suljic E, Avdagic N, Bajraktarevic A, Tahirovic I: Serum nitric oxide concentrations in patients with multiple sclerosis and patients with epilepsy. J Neural Transm 2012,119(1):7–11. 10.1007/s00702-011-0686-6 · DOI
- Liu JS, Zhao ML, Brosnan CF, Lee SC: Expression of inducible nitric oxide synthase and nitrotyrosine in multiple sclerosis lesions. Am J Pathol 2001,158(6):2057–2066. 10.1016/S0002-9440(10)64677-9 · DOI
- Smith KJ, Lassmann H: The role of nitric oxide in multiple sclerosis. Lancet Neurol 2002,1(4):232–241. 10.1016/S1474-4422(02)00102-3 · DOI
- Bagasra O, Michaels FH, Zheng YM, Bobroski LE, Spitsin SV, Fu ZF, Tawadros R, Koprowski H: Activation of the inducible form of nitric oxide synthase in the brains of patients with multiple sclerosis. Proc Natl Acad Sci U S A 1995,92(26):12041–12045. 10.1073/pnas.92.26.12041 · DOI
- De Groot CJ, Ruuls SR, Theeuwes JW, Dijkstra CD, Van der Valk P: Immunocytochemical characterization of the expression of inducible and constitutive isoforms of nitric oxide synthase in demyelinating multiple sclerosis lesions. J Neuropathol Exp Neurol 1997,56(1):10–20. 10.1097/00005072-199701000-00002 · DOI
- Oleszak EL, Zaczynska E, Bhattacharjee M, Butunoi C, Legido A, Katsetos CD: Inducible nitric oxide synthase and nitrotyrosine are found in monocytes/macrophages and/or astrocytes in acute, but not in chronic, multiple sclerosis. Clin Diagn Lab Immunol 1998,5(4):438–445. · DOI
- Wu Q, Butzkueven H, Gresle M, Kirchhoff F, Friedhuber A, Yang Q, Wang H, Fang K, Lei H, Egan GF, Kilpatrick TJ: MR diffusion changes correlate with ultra-structurally defined axonal degeneration in murine optic nerve. Neuroimage 2007,37(4):1138–1147. 10.1016/j.neuroimage.2007.06.029 · DOI
- Lassmann H, van Horssen J: The molecular basis of neurodegeneration in multiple sclerosis. FEBS Lett 2011,585(23):3715–3723. 10.1016/j.febslet.2011.08.004 · DOI
- Haider L, Fischer MT, Frischer JM, Bauer J, Hoftberger R, Botond G, Esterbauer H, Binder CJ, Witztum JL, Lassmann H: Oxidative damage in multiple sclerosis lesions. Brain 2011,134(Pt 7):1914–1924. · DOI
- Spittau B, Wullkopf L, Zhou X, Rilka J, Pfeifer D, Krieglstein K: Endogenous transforming growth factor-beta promotes quiescence of primary microglia in vitro. Glia 2013,61(2):287–300. 10.1002/glia.22435 · DOI
- Xu J, Storer PD, Chavis JA, Racke MK, Drew PD: Agonists for the peroxisome proliferator-activated receptor-alpha and the retinoid X receptor inhibit inflammatory responses of microglia. J Neurosci Res 2005,81(3):403–411. 10.1002/jnr.20518 · DOI
- Shankaran M, Marino ME, Busch R, Keim C, King C, Lee J, Killion S, Awada M, Hellerstein MK: Measurement of brain microglial proliferation rates in vivo in response to neuroinflammatory stimuli: application to drug discovery. J Neurosci Res 2007,85(11):2374–2384. 10.1002/jnr.21389 · DOI
- Dheen ST, Jun Y, Yan Z, Tay SS, Ling EA: Retinoic acid inhibits expression of TNF-alpha and iNOS in activated rat microglia. Glia 2005,50(1):21–31. 10.1002/glia.20153 · DOI
- Butzkueven H, Zhang JG, Soilu-Hanninen M, Hochrein H, Chionh F, Shipham KA, Emery B, Turnley AM, Petratos S, Ernst M, Bartlett PF, Kilpatrick TJ: LIF receptor signaling limits immune-mediated demyelination by enhancing oligodendrocyte survival. Nat Med 2002,8(6):613–619. 10.1038/nm0602-613 · DOI
- Soilu-Hanninen M, Epa R, Shipham K, Butzkueven H, Bucci T, Barrett G, Bartlett PF, Kilpatrick TJ: Treatment of experimental autoimmune encephalomyelitis with antisense oligonucleotides against the low affinity neurotrophin receptor. J Neurosci Res 2000,59(6):712–721. 10.1002/(SICI)1097-4547(20000315)59:6<712::AID-JNR3>3.0.CO;2-L · DOI
- Gresle MM, Alexandrou E, Wu Q, Egan G, Jokubaitis V, Ayers M, Jonas A, Doherty W, Friedhuber A, Shaw G, Sendtner M, Emery B, Kilpatrick T, Butzkueven H: Leukemia inhibitory factor protects axons in experimental autoimmune encephalomyelitis via an oligodendrocyte-independent mechanism. PLoS One 2012,7(10):e47379. 10.1371/journal.pone.0047379 · DOI
- Allen I: Pathology of multiple sclerosis. In McAlpine’s Multiple sclerosis. 2nd edition. Edited by: Matthews W. Edinburgh: Churchill Livingstone; 1991:341–378.
- Lassmann H, Raine CS, Antel J, Prineas JW: Immunopathology of multiple sclerosis: report on an international meeting held at the institute of neurology of the university of vienna. J Neuroimmunol 1998,86(2):213–217. 10.1016/S0165-5728(98)00031-9 · DOI
- Bruck W, Porada P, Poser S, Rieckmann P, Hanefeld F, Kretzschmar HA, Lassmann H: Monocyte/macrophage differentiation in early multiple sclerosis lesions. Ann Neurol 1995,38(5):788–796. 10.1002/ana.410380514 · DOI
- Butzkueven H, Emery B, Cipriani T, Marriott MP, Kilpatrick TJ: Endogenous leukemia inhibitory factor production limits autoimmune demyelination and oligodendrocyte loss. Glia 2006,53(7):696–703. 10.1002/glia.20321 · DOI
Cited by
Sorted by citations
Endocytosis and Physiology: Insights from Disabled-2 Deficient Mice
Tao, W., Moore, R., Smith, E. R., & Xu, X.-X. (2016) · Frontiers in Cell and Developmental Biology · doi:10.3389/fcell.2016.00129 · Cited by 43
Spatially resolved gene signatures of white matter lesion progression in multiple sclerosis
Alsema, A. M., Wijering, M. H. C., Miedema, A., Kotah, J. M., Koster, M., Rijnsburger, M., van Weering, H. R. J., de Vries, H. E., Baron, W., Kooistra, S. M., et al. (2024) · Nature Neuroscience · doi:10.1038/s41593-024-01765-6 · Cited by 38
Metadata
- Authors
- Jokubaitis, V. G., Gresle, M. M., Kemper, D. A., Doherty, W., Perreau, V. M., Cipriani, T. L., Jonas, A., Shaw, G., Kuhlmann, T., Kilpatrick, T. J., & Butzkueven, H.
- Venue
- Acta Neuropathologica Communications
- Published
- 2013-07-09
- Volume
- 1
- Issue
- 1
- ISSN
- 2051-5960
- PMC
- PMC3893401
- Cited by
- 31
- References
- 1
- Language
- en
About these checks
Registry, retraction, Cites and statistics results are computed, not judged, with one exception: a printed reference that no index lists is read once by a model before it counts as a citation error. Claims are extracted by a model and kept only when their quote appears verbatim in the text; each cited source is then checked, with a model’s help, for whether it says what the claim relies on. Those verdicts can be wrong — read the claim’s quote and the cited source before relying on one.
Statistics and arithmetic are recomputed, not judged.
Confidence bands are shown only for fields calibrated on our annotated test set. None is calibrated yet, so no band is shown.
What counts as a claim ›How we measure confidence ›How we check this ›
Are you an author, or do you see a problem with this page? Request a review
