

The DOI matches its Crossref record; 63 of the 63 references it cites were found in a registry or an index.
A resting EEG study of neocortical hyperexcitability and altered functional connectivity in fragile X syndrome.
Open accessAbstract
BACKGROUND: KO mice, a mouse model of the fragile X syndrome which is the most common single gene cause of autism and intellectual disability. METHODS: We collected resting state dense-array electroencephalography data from 21 fragile X syndrome (FXS) patients and 21 age-matched healthy participants. RESULTS: FXS patients exhibited greater gamma frequency band power, which was correlated with social and sensory processing difficulties. Second, FXS patients showed increased spatial spreading of phase-synchronized high frequency neural activity in the gamma band. Third, we observed increased negative theta-to-gamma but decreased alpha-to-gamma band amplitude coupling, and the level of increased theta power was inversely related to the level of resting gamma power in FXS. CONCLUSIONS: Increased theta band power and coupling from frontal sources may represent a mechanism providing compensatory inhibition of high-frequency gamma band activity, potentially contributing to the widely varying level of neurophysiological and behavioral abnormalities and treatment response seen in full-mutation FXS patients. These findings extend preclinical observations and provide new mechanistic insights into brain alterations and their variability across FXS patients. Electrophysiological measures may provide useful translational biomarkers for advancing drug development and individualizing treatments for neurodevelopmental disorders with associated neuronal hyperexcitability.
Overview
The claims and statistics of this paper haven’t been checked yet.
Run the check — free, no account needed. It reads the open-access text and checks the sources it cites.
Integrity signals
Registry
Cites
Statistics
Figures
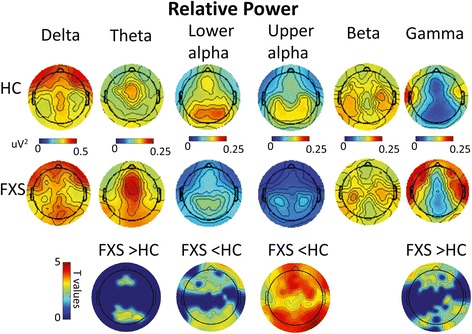
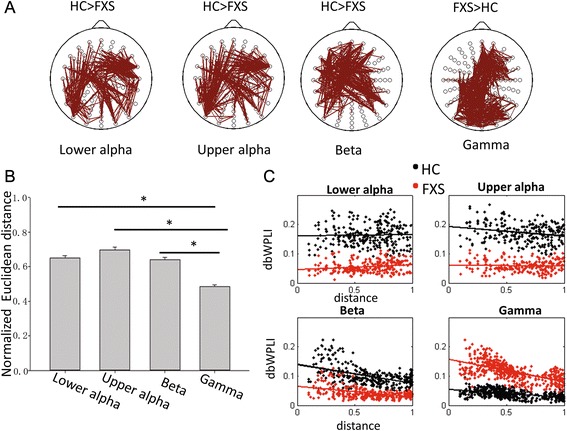
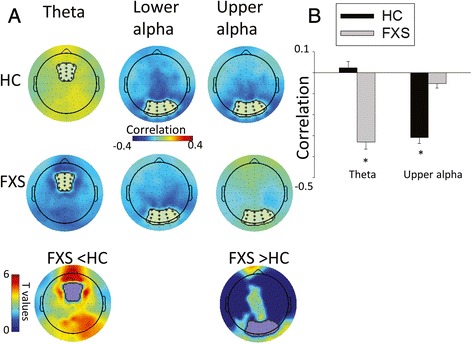
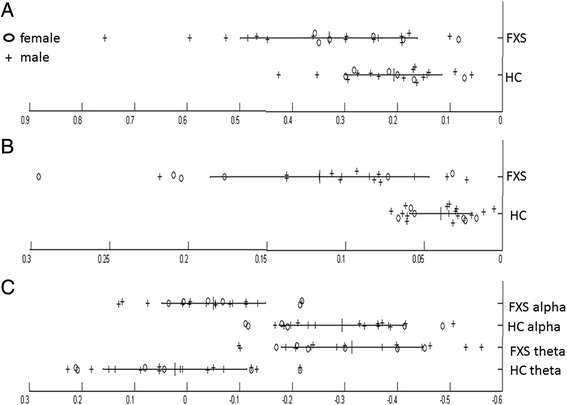
Verification
Claims the paper makes
The claims and statistics of this paper haven’t been checked yet.
Run the check — free, no account needed. It reads the open-access text and checks the sources it cites.
Claims other papers make about this one
Each is checked against this paper’s own text: does it say what the citing paper says it does?
In the citing paper
“These phenotypes in the mouse model are remarkably similar to those seen in humans with FXS (Castrén et al., 2003; Ethridge et al., 2016; Wang et al., 2017).”
From The Perineuronal ‘Safety’ Net? Perineuronal Net Abnormalities in Neurological Disorders (2018) · cites this paper as Wang et al., 2017
Self-check
Percentages, sums and reported differences re-computed from the paper’s own numbers.
The self-check needs the paper’s full text.
Citations
Cites
Delorme, A., & Makeig, S. (2004) · Journal of Neuroscience Methods · doi:10.1016/j.jneumeth.2003.10.009 · Cited by 24,371
The ten-twenty electrode system of the international federation
Jasper, H. H. (1958) · Electroencephalography and Clinical Neurophysiology · Cited by 6,567
Wechsler Abbreviated Scale of Intelligence
Dumont, R., Willis, J. O., Veizel, K., & Zibulsky, J. (2014) · Wiley eBooks · doi:10.1002/9781118660584.ese2519 · Cited by 5,546
Shaping Functional Architecture by Oscillatory Alpha Activity: Gating by Inhibition
Jensen, O., & Mazaheri, A. (2010) · Frontiers in Human Neuroscience · doi:10.3389/fnhum.2010.00186 · Cited by 3,237
Parvalbumin neurons and gamma rhythms enhance cortical circuit performance
Sohal, V. S., Zhang, F., Yizhar, O., & Deisseroth, K. (2009) · Nature · doi:10.1038/nature07991 · Cited by 2,606
Klem, G. H., Lüders, H. O., Jasper, H. H., & Elger, C. E. (1999) · PubMed · Cited by 2,361
The functional role of cross-frequency coupling
Canolty, R. T., & Knight, R. T. (2010) · Trends in Cognitive Sciences · doi:10.1016/j.tics.2010.09.001 · Cited by 2,101
Vinck, M., Oostenveld, R., van Wingerden, M., Battaglia, F., & Pennartz, C. M. A. (2011) · NeuroImage · doi:10.1016/j.neuroimage.2011.01.055 · Cited by 1,753
von Stein, A., & Sarnthein, J. (2000) · International Journal of Psychophysiology · doi:10.1016/s0167-8760(00)00172-0 · Cited by 1,553
Gamma, alpha, delta, and theta oscillations govern cognitive processes
Başar, E., Başar‐Eroğlu, C., Karakaş, S., & Schürmann, M. (2001) · International Journal of Psychophysiology · doi:10.1016/s0167-8760(00)00145-8 · Cited by 1,287
Mass univariate analysis of event‐related brain potentials/fields I: A critical tutorial review
Groppe, D. M., Urbach, T. P., & Marta Kutas, A. (2011) · Psychophysiology · doi:10.1111/j.1469-8986.2011.01273.x · Cited by 1,161
FASTER: Fully Automated Statistical Thresholding for EEG artifact Rejection
Nolan, H., Whelan, R., & Reilly, R. B. (2010) · Journal of Neuroscience Methods · doi:10.1016/j.jneumeth.2010.07.015 · Cited by 1,080
Gamma rhythms and beta rhythms have different synchronization properties
Kopell, N., Ermentrout, G. B., Whittington, M. A., & Traub, R. D. (2000) · Proceedings of the National Academy of Sciences · doi:10.1073/pnas.97.4.1867 · Cited by 1,072
Cross-frequency coupling between neuronal oscillations
Jensen, O., & Colgin, L. L. (2007) · Trends in Cognitive Sciences · doi:10.1016/j.tics.2007.05.003 · Cited by 991
van Kerkoerle, T., Self, M. W., Dagnino, B., Gariel-Mathis, M.-A., Poort, J., van der Togt, C., & Roelfsema, P. R. (2014) · Proceedings of the National Academy of Sciences · doi:10.1073/pnas.1402773111 · Cited by 918
FMR1 Protein: Conserved RNP Family Domains and Selective RNA Binding
Ashley, C. T., Wilkinson, K. D., Reines, D., & Warren, S. T. (1993) · Science · doi:10.1126/science.7692601 · Cited by 752
Thalamic Mechanisms of EEG Alpha Rhythms and Their Pathological Implications
Hughes, S. W., & Crunelli, V. (2005) · The Neuroscientist · doi:10.1177/1073858405277450 · Cited by 565
Resting State Cortical Connectivity Reflected in EEG Coherence in Individuals With Autism
Murias, M., Webb, S. J., Greenson, J., & Dawson, G. (2007) · Biological Psychiatry · doi:10.1016/j.biopsych.2006.11.012 · Cited by 550
Resting state EEG abnormalities in autism spectrum disorders
Wang, J., Barstein, J., Ethridge, L. E., Mosconi, M. W., Takarae, Y., & Sweeney, J. A. (2013) · Journal of Neurodevelopmental Disorders · doi:10.1186/1866-1955-5-24 · Cited by 547
Self-citationBalas, B., Nelson, C. A., Westerlund, A., Vogel‐Farley, V. K., Riggins, T., & Kuefner, D. (2010) · Frontiers in Human Neuroscience · doi:10.3389/neuro.09.001.2010 · Cited by 544
Feng, Y., Gutekunst, C.-A., Eberhart, D. E., Yi, H., Warren, S. T., & Hersch, S. M. (1997) · The Journal of Neuroscience · doi:10.1523/jneurosci.17-05-01539.1997 · Cited by 532
Gibson, J. R., Bartley, A. F., Hays, S. A., & Huber, K. M. (2008) · Journal of Neurophysiology · doi:10.1152/jn.90752.2008 · Cited by 529
The Electrophysiological Dynamics of Interference during the Stroop Task
Hanslmayr, S., Pastötter, B., Bäuml, K.-H., Gruber, S., Wimber, M., & Klimesch, W. (2008) · Journal of Cognitive Neuroscience · doi:10.1162/jocn.2008.20020 · Cited by 510
Altered Neuronal and Circuit Excitability in Fragile X Syndrome
Contractor, A., Klyachko, V. A., & Portera‐Cailliau, C. (2015) · Neuron · doi:10.1016/j.neuron.2015.06.017 · Cited by 418
Asada, H., Fukuda, Y., Tsunoda, S., Yamaguchi, M., & Tonoike, M. (1999) · Neuroscience Letters · doi:10.1016/s0304-3940(99)00679-5 · Cited by 411 · cited 2×
“The functional role of theta oscillation is related to its neural sources in the prefrontal and anterior cingulate cortex (ACC) [52], which play important roles in inhibitory control of behavior, behavioral flexibility, and error monitoring [53, 54].”
BackgroundLonati, E., Brambilla, A., Milani, C., Masserini, M., Palestini, P., & Bulbarelli, A. (2014) · Frontiers in Cellular Neuroscience · doi:10.3389/fncel.2014.00001 · Cited by 348
Wang, C., Ulbert, I., Schomer, D. L., Marinković, K., & Halgren, E. (2005) · Journal of Neuroscience · doi:10.1523/jneurosci.4151-04.2005 · Cited by 311
Cortically projecting basal forebrain parvalbumin neurons regulate cortical gamma band oscillations
Kim, T., Thankachan, S., McKenna, J. T., McNally, J. M., Yang, C. Z., Choi, J. H., Chen, L., Kocsis, B., Deisseroth, K. A., Strecker, R. E., et al. (2015) · Proceedings of the National Academy of Sciences · doi:10.1073/pnas.1413625112 · Cited by 282
Circuit level defects in the developing neocortex of fragile X mice
Gonçalves, J. T., Anstey, J. E., Golshani, P., & Portera-Cailliau, C. (2013) · Nature Neuroscience · doi:10.1038/nn.3415 · Cited by 279
Fanselow, E. E., Richardson, K. A., & Connors, B. W. (2008) · Journal of Neurophysiology · doi:10.1152/jn.90691.2008 · Cited by 262
Prestimulus alpha and mu activity predicts failure to inhibit motor responses
Mazaheri, A., Nieuwenhuis, I. L. C., van Dijk, H., & Jensen, O. B. (2009) · Human Brain Mapping · doi:10.1002/hbm.20763 · Cited by 261
Brain-Derived Neurotrophic Factor Rescues Synaptic Plasticity in a Mouse Model of Fragile X Syndrome
Lauterborn, J. C., Rex, C. S., Kramár, E. A., Chen, L. Y., Pandyarajan, V., LYNCH, G. S., & Gall, C. M. (2007) · Journal of Neuroscience · doi:10.1523/jneurosci.2624-07.2007 · Cited by 241
Cantero, J. L., Atienza, M., & Salas, R. M. (2002) · Neurophysiologie Clinique · doi:10.1016/s0987-7053(01)00289-1 · Cited by 225
Theta-Burst Transcranial Magnetic Stimulation Alters Cortical Inhibition
Benali, A., Trippe, J., Weiler, E., Mix, A., Petrasch‐Parwez, E., Girzalsky, W., Eysel, U., Erdmann, R., & Funke, K. (2011) · Journal of Neuroscience · doi:10.1523/jneurosci.1379-10.2011 · Cited by 218
EEG hyper-connectivity in high-risk infants is associated with later autism
The BASIS Team, Orekhova, E. V., Elsabbagh, M., Jones, E. J., Dawson, G., Charman, T., & Johnson, M. H. (2014) · Journal of Neurodevelopmental Disorders · doi:10.1186/1866-1955-6-40 · Cited by 210
Traub, R. D., Cunningham, M. O., Gloveli, T., LeBeau, F. E. N., Bibbig, A., Buhl, E., & Whittington, M. A. (2003) · Proceedings of the National Academy of Sciences · doi:10.1073/pnas.1934854100 · Cited by 205
Ethridge, L. E., White, S. P., Mosconi, M. W., Wang, J., Byerly, M. J., & Sweeney, J. A. (2016) · Translational Psychiatry · doi:10.1038/tp.2016.48 · Cited by 188
Self-citationTrippe, J., Mix, A., Aydın-Abidin, S., Funke, K., & Benali, A. (2009) · Experimental Brain Research · doi:10.1007/s00221-009-1961-8 · Cited by 185
Temporal fluctuations in coherence of brain waves.
Bullock, T. H., McClune, M. C., Achimowicz, J. Z., Iragui‐Madoz, V., Duckrow, R. B., & Spencer, S. S. (1995) · Proceedings of the National Academy of Sciences · doi:10.1073/pnas.92.25.11568 · Cited by 163
Altered auditory processing in a mouse model of fragile X syndrome
Rotschafer, S. E., & Razak, K. A. (2013) · Brain Research · doi:10.1016/j.brainres.2013.02.038 · Cited by 138
Therapeutic implications of the mGluR theory of fragile X mental retardation
Bear, M. F. (2005) · Genes, Brain and Behavior · doi:10.1111/j.1601-183x.2005.00135.x · Cited by 137
Strumbos, J. G., Brown, M. R., Kronengold, J., Polley, D. B., & Kaczmarek, L. K. (2010) · The Journal of Neuroscience · doi:10.1523/jneurosci.1125-10.2010 · Cited by 135
Augmentation of auditory N1 in children with fragile X syndrome.
Castrén, M., Pääkkönen, A., Tarkka, I. M., Ryynänen, M., & Partanen, J. (2003) · Brain Topography · doi:10.1023/a:1022606200636 · Cited by 123
Brown, C. E., Tollefson, N., Dunn, W., Cromwell, R. L., & Filion, D. L. (2001) · PsycTESTS Dataset · doi:10.1037/t56705-000 · Cited by 114
Associations of HLA alleles with specific language impairment
Nudel, R., Simpson, N. H., Baird, G., O'Hare, A. E., Conti‐Ramsden, G., Bolton, P., Hennessy, E. R., Monaco, A. P., Knight, J. C., WINNEY, B. J., et al. (2014) · Journal of Neurodevelopmental Disorders · doi:10.1186/1866-1955-6-1 · Cited by 108
Correlations between ERP parameters and intelligence: a reconsideration
Jaušovec, N., & Jaušovec, K. (2000) · Biological Psychology · doi:10.1016/s0301-0511(00)00076-4 · Cited by 107
Eadie, B. D., Cushman, J. D., Kannangara, T. S., Fanselow, M. S., & Christie, B. R. (2010) · Hippocampus · doi:10.1002/hipo.20890 · Cited by 103
Synaptic Mechanisms of Tight Spike Synchrony at Gamma Frequency in Cerebral Cortex
Salkoff, D. B., Zagha, E., Yüzgeç, Ö., & McCormick, D. A. (2015) · Journal of Neuroscience · doi:10.1523/jneurosci.0828-15.2015 · Cited by 100
Yun, S. H., & Trommer, B. L. (2010) · Journal of Neuroscience Research · doi:10.1002/jnr.22546 · Cited by 97
Auditory change detection in fragile X syndrome males: A brain potential study
van der Molen, M. J. W., van der Molen, M. W., Ridderinkhof, K. R., Hamel, B. C. J., Curfs, L., & Ramakers, G. J. A. (2011) · Clinical Neurophysiology · doi:10.1016/j.clinph.2011.11.039 · Cited by 90
Task-related modulation of anterior theta and posterior alpha EEG reflects top-down preparation
Min, B., & Park, H. (2010) · BMC Neuroscience · doi:10.1186/1471-2202-11-79 · Cited by 89
Owen, E. R., Baumgartner, H. A., & Rivera, S. M. (2013) · Journal of Neurodevelopmental Disorders · doi:10.1186/1866-1955-5-1 · Cited by 75
Impaired Critical Period Plasticity in Primary Auditory Cortex of Fragile X Model Mice
Kim, H., Gibboni, R., Kirkhart, C., & Bao, S. (2013) · The Journal of Neuroscience · doi:10.1523/jneurosci.3246-12.2013 · Cited by 74
Auditory evoked magnetic fields in adults with fragile X syndrome.
Rojas, D. C., Benkers, T. L., Rogers, S. J., Teale, P. D., Reite, M. L., & Hagerman, R. J. (2001) · Neuroreport · doi:10.1097/00001756-200108080-00056 · Cited by 73
Reduced alpha and exaggerated theta power during the resting-state EEG in fragile X syndrome
van der Molen, M. J. W., & van der Molen, M. W. (2012) · Biological Psychology · doi:10.1016/j.biopsycho.2012.11.013 · Cited by 69
The contribution of inhibitory interneurons to circuit dysfunction in Fragile X Syndrome
Rio, C. A. C.-D., & Huntsman, M. M. (2014) · Frontiers in Cellular Neuroscience · doi:10.3389/fncel.2014.00245 · Cited by 68
Rescue of NMDAR-Dependent Synaptic Plasticity in Fmr1 Knock-Out Mice
Bostrom, C. A., Majaess, N. M., Morch, K., White, E. R., Eadie, B. D., & Christie, B. R. (2013) · Cerebral Cortex · doi:10.1093/cercor/bht237 · Cited by 67
Hiyoshi, T., Kambe, D., Karasawa, J.-I., & Chaki, S. (2014) · Neuropharmacology · doi:10.1016/j.neuropharm.2014.05.037 · Cited by 65
Radwan, B., Dvorak, D., & Fenton, A. A. (2016) · Neurobiology of Disease · doi:10.1016/j.nbd.2016.01.003 · Cited by 63
van der Molen, M. J. W., Stam, C. J., & van der Molen, M. W. (2014) · PLoS ONE · doi:10.1371/journal.pone.0088451 · Cited by 61
Human reversal learning under conditions of certain versus uncertain outcomes
D'Cruz, A.-M., Ragozzino, M. E., Mosconi, M. W., Pavuluri, M. N., & Sweeney, J. A. (2011) · NeuroImage · doi:10.1016/j.neuroimage.2011.01.068 · Cited by 54
Self-citationDisrupted Cortical State Regulation in a Rat Model of Fragile X Syndrome
Berzhanskaya, J., Phillips, M. A., Gorin, A., Lai, C., Shen, J., & Colonnese, M. T. (2016) · Cerebral Cortex · doi:10.1093/cercor/bhv331 · Cited by 46
Involvement and Therapeutic Potential of the GABAergic System in the Fragile X Syndrome
Heulens, I., D’Hulst, C., Braat, S., Rooms, L., & Kooy, R. F. (2010) · The Scientific World JOURNAL · doi:10.1100/tsw.2010.211 · Cited by 19
Research works printed but not linked: 2
- Rutter M, Bailey A, Lord C. SCQ: the Social Communication Questionnaire. Torrance: WPS; 2003.
- Roid GH. Stanford-Binet Intelligence Scales, 5th edition (SB:V). Itasca: Riverside Publishing; 2003.
Cited by
Sorted by citations
Translation-relevant EEG phenotypes in a mouse model of Fragile X Syndrome.
Lovelace, J. W., Ethell, I. M., Binder, D. K., & Razak, K. A. (2018) · Neurobiology of Disease · doi:10.1016/j.nbd.2018.03.012 · Cited by 154
Self-citationThe Perineuronal ‘Safety’ Net? Perineuronal Net Abnormalities in Neurological Disorders
Wen, T. H., Binder, D. K., Ethell, I. M., & Razak, K. A. (2018) · Frontiers in Molecular Neuroscience · doi:10.3389/fnmol.2018.00270 · Cited by 170
Self-citationWen, T. H., Afroz, S., Reinhard, S. M., Palacios, A. R., Tapia, K., Binder, D. K., Razak, K. A., & Ethell, I. M. (2018) · Cerebral Cortex · doi:10.1093/cercor/bhx258 · Cited by 165
Self-citationHyperexcitability and homeostasis in fragile X Syndrome.
Liu, X., Kumar, V., Tsai, N.-P., & Auerbach, B. D. (2022) · Frontiers in Molecular Neuroscience · doi:10.3389/fnmol.2021.805929 · Cited by 53
Janz, P., Bainier, M., Marashli, S., Gross, S., & Redondo, R. L. (2025) · Neuropharmacology · doi:10.1016/j.neuropharm.2024.110182 · Cited by 11
Metadata
- Authors
- Wang, J., Ethridge, L. E., Mosconi, M. W., White, S. P., Binder, D. K., Pedapati, E. V., Erickson, C. A., Byerly, M. J., & Sweeney, J. A.
- Affiliations
- Zhejiang Normal University (CN)
- University of Oklahoma Health Sciences Center (US)
- University of Kansas (US)
- The University of Texas Southwestern Medical Center (US)
- University of California, Riverside (US)
- Cincinnati Children's Hospital Medical Center (US)
- Montana State University (US)
- University of Cincinnati (US)
- Corresponding author
- Wang, Jun
- ORCID
- Venue
- Journal of Neurodevelopmental Disorders
- Published
- 2017-03-14
- Volume
- 9
- Issue
- 1
- Pages
- 11-11
- ISSN
- 1866-1947 (ISSN-L)
- 1866-1955
- PMC
- PMC5351111
- OpenAlex
- W2596913176
- Cited by
- 176
- References
- 63
- Citations by year
- 2026: 19 · 2025: 17 · 2024: 24 · 2023: 16 · 2022: 26 · 2021: 21 · 2020: 17 · 2019: 20 · 2018: 12 · 2017: 4
- FWCI
- 9.62
- Type
- journal article
- Language
- en
- Open access
- gold
- doi.org
- Locations
- Journal of Neurodevelopmental Disorders (publishedVersion, cc-by)
- Europe PMC (PubMed Central) (publishedVersion, cc-by)
- PubMed Central (publishedVersion, cc-by)
- PubMed (publishedVersion)
- KU ScholarWorks (University of Kansas) (submittedVersion, cc-by)
- Funders
- National Institute of Child Health and Human Development (U54 HD082008-01)
- Topics
- Life Sciences › Biochemistry, Genetics and Molecular Biology › Genetics › Genetics and Neurodevelopmental Disorders
- Life Sciences › Neuroscience › Cognitive Neuroscience › Autism Spectrum Disorder Research
- Life Sciences › Neuroscience › Cognitive Neuroscience › Neural dynamics and brain function
- Keywords
- fragile X syndrome, resting-state EEG, functional connectivity, gamma power, theta power, amplitude coupling, autism spectrum disorder, intellectual disability, biomarkers, neurodevelopmental disorders
About these checks
Registry, retraction, Cites and statistics results are computed, not judged, with one exception: a printed reference that no index lists is read once by a model before it counts as a citation error. Claims are extracted by a model and kept only when their quote appears verbatim in the text; each cited source is then checked, with a model’s help, for whether it says what the claim relies on. Those verdicts can be wrong — read the claim’s quote and the cited source before relying on one.
Statistics and arithmetic are recomputed, not judged.
Confidence bands are shown only for fields calibrated on our annotated test set. None is calibrated yet, so no band is shown.
What counts as a claim ›How we measure confidence ›How we check this ›
Are you an author, or do you see a problem with this page? Request a review
