

The DOI matches its Crossref record; 51 of the 53 references it cites were found in a registry or an index.
BTR: training asynchronous Boolean models using single-cell expression data
Open accessAbstract
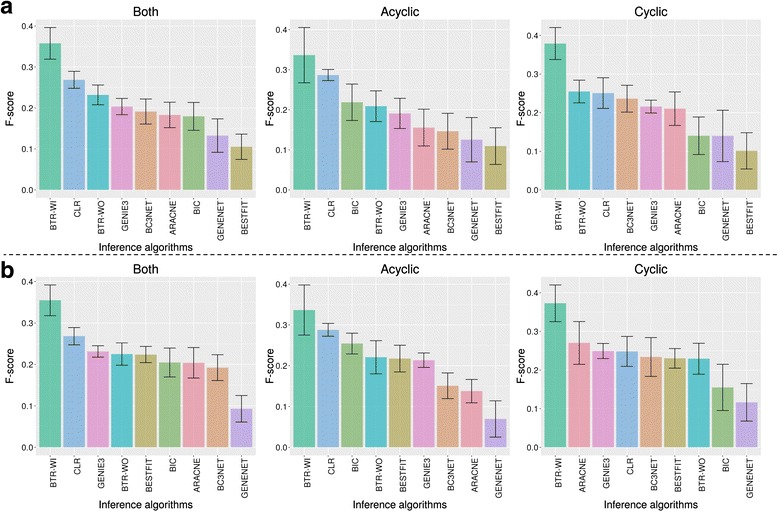
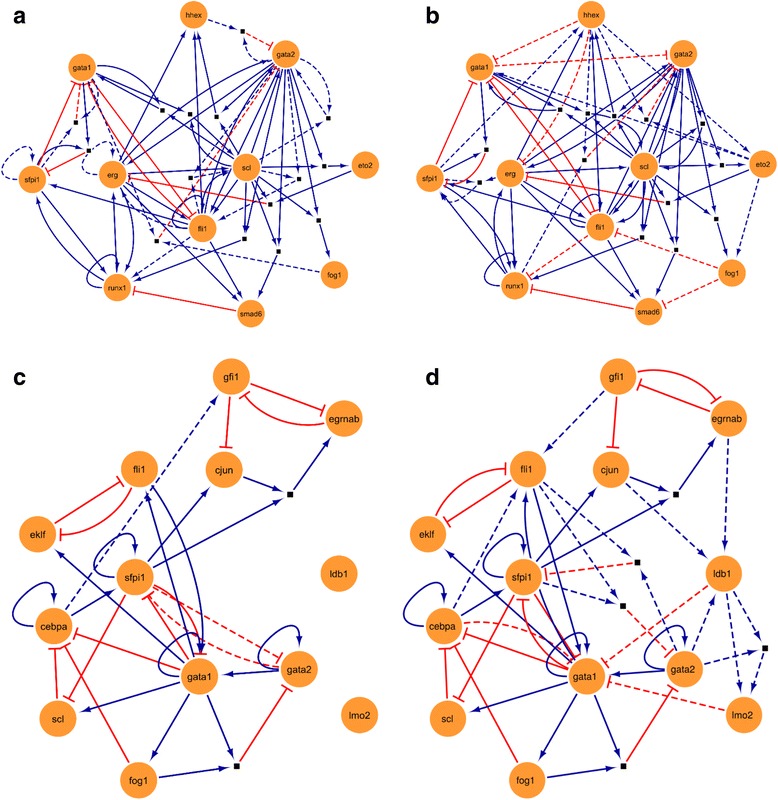
Background: Rapid technological innovation for the generation of single-cell genomics data presents new challenges and opportunities for bioinformatics analysis. One such area lies in the development of new ways to train gene regulatory networks. The use of single-cell expression profiling technique allows the profiling of the expression states of hundreds of cells, but these expression states are typically noisier due to the presence of technical artefacts such as drop-outs. While many algorithms exist to infer a gene regulatory network, very few of them are able to harness the extra expression states present in single-cell expression data without getting adversely affected by the substantial technical noise present. Results: Here we introduce BTR, an algorithm for training asynchronous Boolean models with single-cell expression data using a novel Boolean state space scoring function. BTR is capable of refining existing Boolean models and reconstructing new Boolean models by improving the match between model prediction and expression data. We demonstrate that the Boolean scoring function performed favourably against the BIC scoring function for Bayesian networks. In addition, we show that BTR outperforms many other network inference algorithms in both bulk and single-cell synthetic expression data. Lastly, we introduce two case studies, in which we use BTR to improve published Boolean models in order to generate potentially new biological insights. Conclusions: BTR provides a novel way to refine or reconstruct Boolean models using single-cell expression data. Boolean model is particularly useful for network reconstruction using single-cell data because it is more robust to the effect of drop-outs. In addition, BTR does not assume any relationship in the expression states among cells, it is useful for reconstructing a gene regulatory network with as few assumptions as possible. Given the simplicity of Boolean models and the rapid adoption of single-cell genomics by biologists, BTR has the potential to make an impact across many fields of biomedical research.
Overview
The claims and statistics of this paper haven’t been checked yet.
Run the check — free, no account needed. It reads the open-access text and checks the sources it cites.
Integrity signals
Registry
Cites
Statistics
Figures
Verification
Claims the paper makes
The claims and statistics of this paper haven’t been checked yet.
Run the check — free, no account needed. It reads the open-access text and checks the sources it cites.
Claims other papers make about this one
Each is checked against this paper’s own text: does it say what the citing paper says it does?
In the citing paper
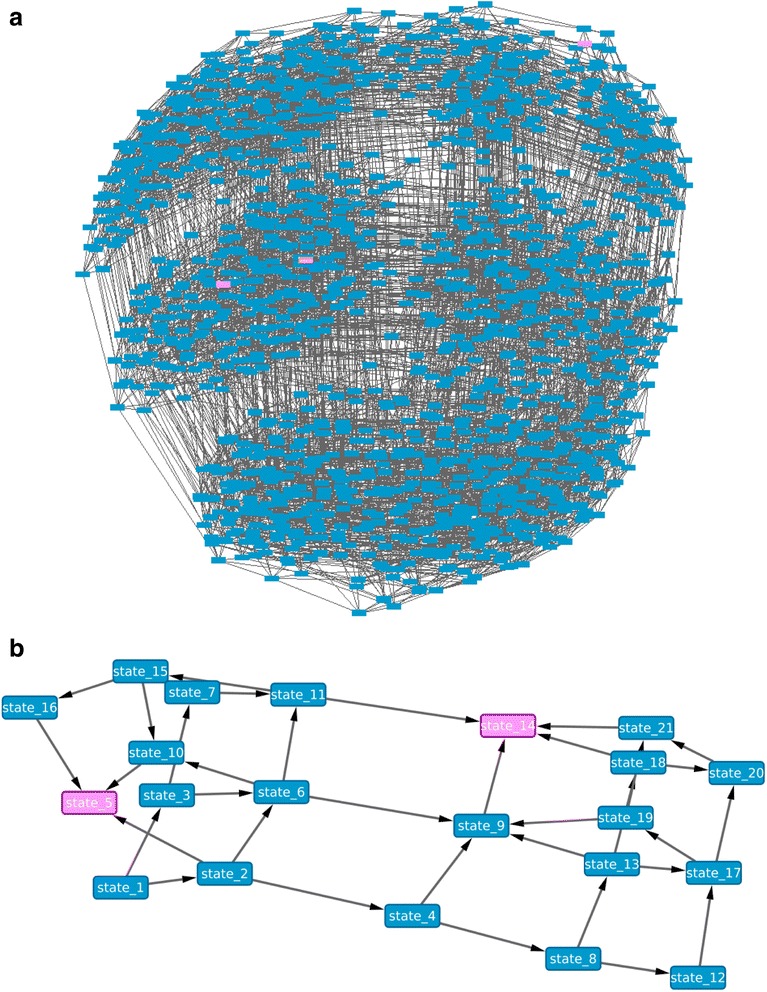
“The resulting state-graph provides insight into key TFs involved in state changes, and can be used to predict the effect of over-expression or knock-down of a TF.”
From Mapping gene regulatory networks from single-cell omics data (2018) · cites this paper as [29]
Self-check
Percentages, sums and reported differences re-computed from the paper’s own numbers.
The self-check needs the paper’s full text.
Citations
Cites
Cytoscape: A software Environment for integrated models of biomolecular interaction networks
Shannon, P., Markiel, A., Ozier, O., Baliga, N. S., Wang, J. T., Ramage, D., Amin, N., Schwikowski, B., & Ideker, T. (2003) · Genome Research · doi:10.1101/gr.1239303 · Cited by 51,888
ggplot2: Elegant Graphics for Data Analysis
Wickham, H. (2009) · doi:10.1007/978-0-387-98141-3 · Cited by 14,447
mRNA-Seq whole-transcriptome analysis of a single cell
Tang, F., Barbacioru, C., Wang, Y., Nordman, E., Lee, C., Xu, N., Wang, X., Bodeau, J., Tuch, B. B., Siddiqui, A., et al. (2009) · Nature Methods · doi:10.1038/nmeth.1315 · Cited by 3,969
Modeling and Simulation of Genetic Regulatory Systems: A Literature Review
de Jong, H. (2002) · Journal of Computational Biology · doi:10.1089/10665270252833208 · Cited by 2,663
Advances in Neural Information Processing Systems 27 (NIPS 2014)
Zhong, M., Goddard, N., & Sutton, C. A. (2014) · Cited by 2,440
Margolin, A. A., Nemenman, I., Basso, K., Wiggins, C., Stolovitzky, G., Favera, R. D., & Califano, A. (2006) · BMC Bioinformatics · doi:10.1186/1471-2105-7-s1-s7 · Cited by 2,420
Margolin, A. A., Nemenman, I. M., Basso, K., Wiggins, C. H., Stolovitzky, G. A., Favera, R. D., & Califano, A. (2006) · BMC Bioinformatics · doi:10.7916/d8g15zbp · Cited by 2,259
Unbiased classification of sensory neuron types by large-scale single-cell RNA sequencing
Usoskin, D., Furlan, A., Islam, S., Abdo, H., Lönnerberg, P., Lou, D., Hjerling-Leffler, J., Haeggström, J., Kharchenko, O., Kharchenko, P. V., et al. (2015) · Nature Neuroscience · doi:10.1038/nn.3881 · Cited by 2,136
Inferring Regulatory Networks from Expression Data Using Tree-Based Methods
Huynh-Thu, V. A., Irrthum, A., Wehenkel, L., & Geurts, P. (2010) · PLoS ONE · doi:10.1371/journal.pone.0012776 · Cited by 2,131
Beyond Accuracy, F-Score and ROC: A Family of Discriminant Measures for Performance Evaluation
Sokolova, M., Japkowicz, N., & Szpakowicz, S. (2006) · Lecture Notes in Computer Science · doi:10.1007/11941439_114 · Cited by 1,974
Cited by
Benchmarking algorithms for gene regulatory network inference from single-cell transcriptomic data
Pratapa, A., Jalihal, A. P., Law, J. N., Bharadwaj, A., & Murali, T. M. (2020) · Nature Methods · doi:10.1038/s41592-019-0690-6 · Cited by 792
Statistics or biology: the zero-inflation controversy about scRNA-seq data
Jiang, R., Sun, T., Song, D., & Li, J. J. (2022) · Genome Biology · doi:10.1186/s13059-022-02601-5 · Cited by 614
Matsumoto, H., Kiryu, H., Furusawa, C., Ko, M. S. H., Ko, S. B. H., Gouda, N., Hayashi, T., & Nikaido, I. (2017) · Bioinformatics · doi:10.1093/bioinformatics/btx194 · Cited by 439
Mapping gene regulatory networks from single-cell omics data
Fiers, M. W. E. J., Minnoye, L., Aibar, S., Bravo González-Blas, C., Kalender Atak, Z., & Aerts, S. (2018) · Briefings in Functional Genomics · doi:10.1093/bfgp/elx046 · Cited by 235
Chen, S., & Mar, J. C. (2018) · BMC Bioinformatics · doi:10.1186/s12859-018-2217-z · Cited by 235
Metadata
- Authors
- Lim, C. Y., Wang, H., Woodhouse, S., Piterman, N., Wernisch, L., Fisher, J., & Göttgens, B.
- Affiliations
- Wellcome/MRC Cambridge Stem Cell Institute (GB)
- University of Leicester (GB)
- MRC Biostatistics Unit (GB)
- University of Cambridge (GB)
- Corresponding author
- Göttgens, Berthold
- Venue
- BMC Bioinformatics
- Published
- 2016-09-06
- Volume
- 17
- Issue
- 1
- Pages
- 355-355
- ISSN
- 1471-2105 (ISSN-L)
- PMC
- PMC5012073
- OpenAlex
- W2460857593
- Cited by
- 81
- References
- 53
- Citations by year
- 2026: 3 · 2025: 9 · 2024: 4 · 2023: 11 · 2022: 8 · 2021: 15 · 2020: 9 · 2019: 7 · 2018: 7 · 2017: 7 · 2016: 1
- FWCI
- 3.81
- Type
- journal article
- Language
- en
- Open access
- gold
- doi.org
- Licence
- cc-by
- creativecommons.org/licenses/by/4.0 (tdm)
- creativecommons.org/licenses/by/4.0 (vor)
- Locations
- BMC Bioinformatics (publishedVersion, cc-by)
- PubMed Central (publishedVersion, cc-by)
- PubMed (publishedVersion)
- Figshare (submittedVersion, cc-by)
- Leicester Research Archive (University of Leicester) (submittedVersion, cc-by)
- Queen Mary Research Online (Queen Mary University of London) (submittedVersion, cc-by)
- Apollo (University of Cambridge) (submittedVersion, cc-by)
- Apollo (cc-by)
- Funders
- Bloodwise (12029)
- Biotechnology and Biological Sciences Research Council (BB/I00050X/1)
- Cambridge Institute for Medical Research, University of Cambridge (RP-PG-0310-1002)
- Microsoft Research (2012-023)
- Wellcome Trust (100140/Z/12/Z; 097922/Z/11/Z)
- Topics
- Life Sciences › Biochemistry, Genetics and Molecular Biology › Molecular Biology › Gene Regulatory Network Analysis
- Life Sciences › Biochemistry, Genetics and Molecular Biology › Molecular Biology › Single-cell and spatial transcriptomics
- Life Sciences › Biochemistry, Genetics and Molecular Biology › Molecular Biology › Microbial Metabolic Engineering and Bioproduction
- Keywords
- gene regulatory networks, single-cell gene expression
- MeSH terms
- Algorithms, Animals, Bayes Theorem, Cells, Humans, Models, Genetic, Computational Biology, Gene Expression Profiling, Gene Regulatory Networks, Single-Cell Analysis
About these checks
Registry, retraction, Cites and statistics results are computed, not judged, with one exception: a printed reference that no index lists is read once by a model before it counts as a citation error. Claims are extracted by a model and kept only when their quote appears verbatim in the text; each cited source is then checked, with a model’s help, for whether it says what the claim relies on. Those verdicts can be wrong — read the claim’s quote and the cited source before relying on one.
Statistics and arithmetic are recomputed, not judged.
Confidence bands are shown only for fields calibrated on our annotated test set. None is calibrated yet, so no band is shown.
What counts as a claim ›How we measure confidence ›How we check this ›
Are you an author, or do you see a problem with this page? Request a review
How to cite
Cite CoChat for the checks on this page, and the paper for its own findings.
- This page
- CoChat. (2026). Citation check: BTR: training asynchronous Boolean models using single-cell expression data. https://app.cochat.ai/papers/10.1186/s12859-016-1235-y
- The paper
- Lim, C. Y., Wang, H., Woodhouse, S., Piterman, N., Wernisch, L., Fisher, J., & Göttgens, B. (2016). BTR: training asynchronous Boolean models using single-cell expression data. BMC Bioinformatics. https://doi.org/10.1186/s12859-016-1235-y
Data sources
Bibliographic data: Semantic Scholar, OpenAlex, Crossref.
Contains information from the Semantic Scholar Academic Graph Datasets, made available under the ODC Attribution License (ODC-BY 1.0).
Semantic Scholar’s data is described in: Kinney, R., et al. (2023). The Semantic Scholar Open Data Platform. arXiv:2301.10140.
