

The DOI matches its Crossref record; 50 of the 50 references it cites were found in a registry or an index.
Evaluating methods of inferring gene regulatory networks highlights their lack of performance for single cell gene expression data
Open accessAbstract
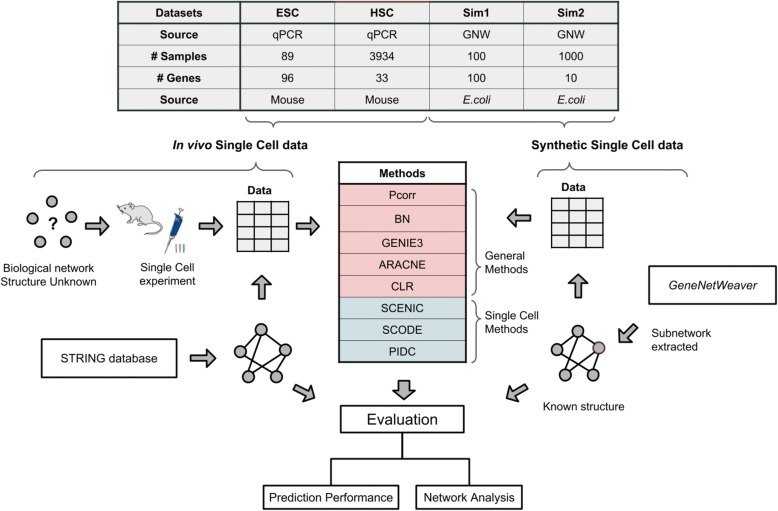
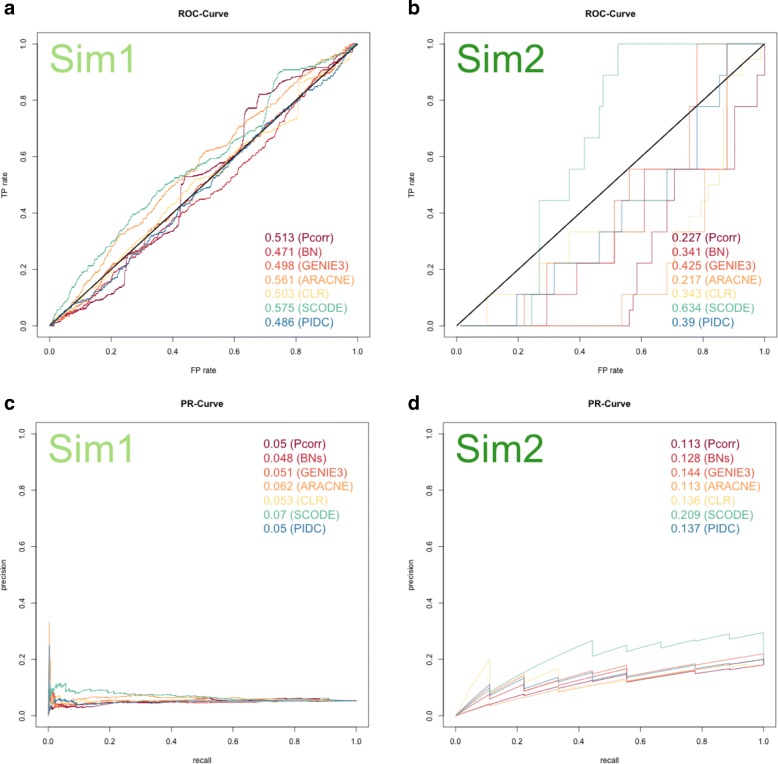
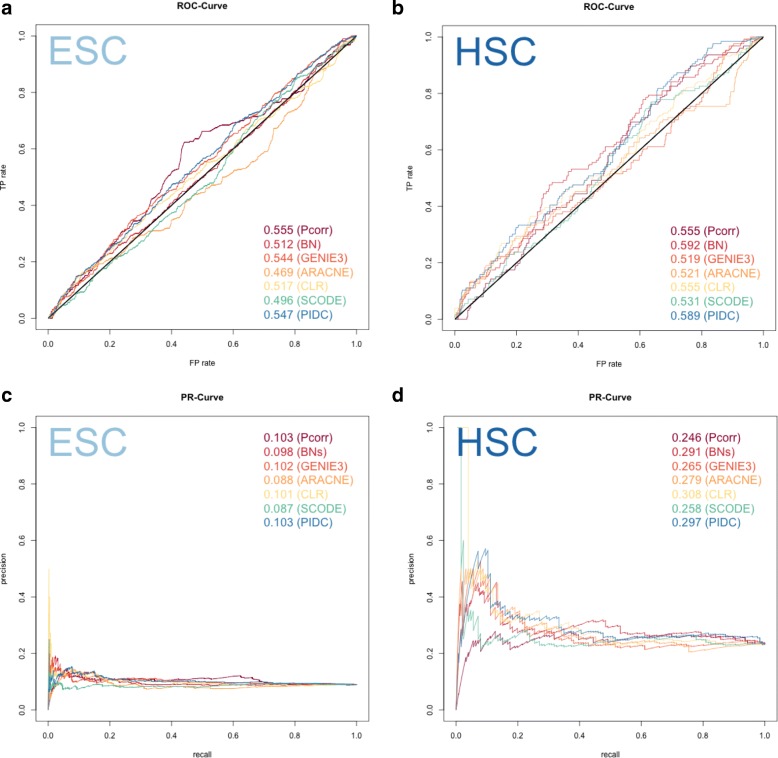
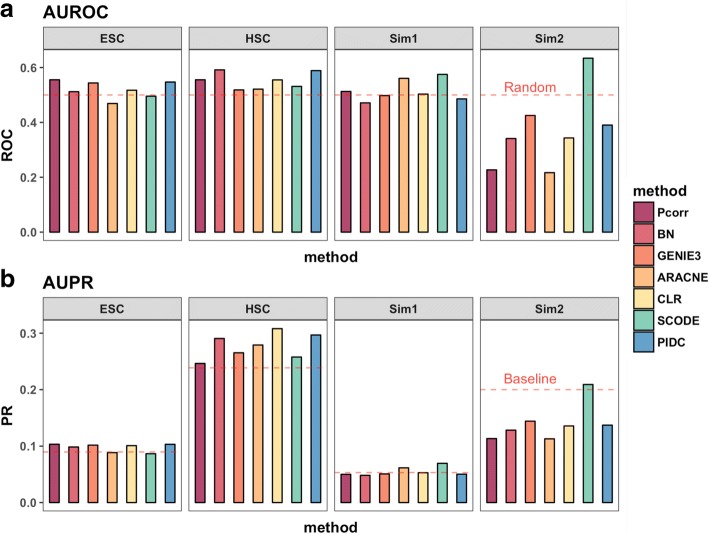
BACKGROUND: A fundamental fact in biology states that genes do not operate in isolation, and yet, methods that infer regulatory networks for single cell gene expression data have been slow to emerge. With single cell sequencing methods now becoming accessible, general network inference algorithms that were initially developed for data collected from bulk samples may not be suitable for single cells. Meanwhile, although methods that are specific for single cell data are now emerging, whether they have improved performance over general methods is unknown. In this study, we evaluate the applicability of five general methods and three single cell methods for inferring gene regulatory networks from both experimental single cell gene expression data and in silico simulated data. RESULTS: Standard evaluation metrics using ROC curves and Precision-Recall curves against reference sets sourced from the literature demonstrated that most of the methods performed poorly when they were applied to either experimental single cell data, or simulated single cell data, which demonstrates their lack of performance for this task. Using default settings, network methods were applied to the same datasets. Comparisons of the learned networks highlighted the uniqueness of some predicted edges for each method. The fact that different methods infer networks that vary substantially reflects the underlying mathematical rationale and assumptions that distinguish network methods from each other. CONCLUSIONS: This study provides a comprehensive evaluation of network modeling algorithms applied to experimental single cell gene expression data and in silico simulated datasets where the network structure is known. Comparisons demonstrate that most of these assessed network methods are not able to predict network structures from single cell expression data accurately, even if they are specifically developed for single cell methods. Also, single cell methods, which usually depend on more elaborative algorithms, in general have less similarity to each other in the sets of edges detected. The results from this study emphasize the importance for developing more accurate optimized network modeling methods that are compatible for single cell data. Newly-developed single cell methods may uniquely capture particular features of potential gene-gene relationships, and caution should be taken when we interpret these results.
Overview
The claims and statistics of this paper haven’t been checked yet.
Run the check — free, no account needed. It reads the open-access text and checks the sources it cites.
Integrity signals
Registry
Cites
Statistics
Figures
Verification
Claims the paper makes
The claims and statistics of this paper haven’t been checked yet.
Run the check — free, no account needed. It reads the open-access text and checks the sources it cites.
Claims other papers make about this one
Each is checked against this paper’s own text: does it say what the citing paper says it does?
In the citing paper
“While there exist GRN inference methods that were specifically developed for scRNA‐seq data (SCONE: Matsumoto et al, 2017; PIDC: Chan et al, 2017; SCENIC: Aibar et al, 2017), a recent comparison has shown both bulk and single‐cell methods to perform poorly on these data (Chen & Mar, 2018).”
From Current best practices in single-cell RNA-seq analysis: a tutorial (2019) · cites this paper as Chen & Mar, 2018
Self-check
Percentages, sums and reported differences re-computed from the paper’s own numbers.
The self-check needs the paper’s full text.
Citations
Cites
Emergence of Scaling in Random Networks
Barabási, A.-L., & Albert, R. (1999) · Science · doi:10.1126/science.286.5439.509 · Cited by 36,135
STRING v10: protein–protein interaction networks, integrated over the tree of life
Szklarczyk, D., Franceschini, A., Wyder, S., Forslund, K., Heller, D., Huerta-Cepas, J., Simonovic, M., Roth, A., Santos, A., Tsafou, K. P., et al. (2015) · Nucleic Acids Research · doi:10.1093/nar/gku1003 · Cited by 10,436
The igraph software package for complex network research
Csárdi, G., & Nepusz, T. (2006) · Medical Entomology and Zoology · Cited by 10,078
Trapnell, C., Cacchiarelli, D., Grimsby, J., Pokharel, P., Li, S., Morse, M., Lennon, N. J., Livak, K. J., Mikkelsen, T. S., & Rinn, J. L. (2014) · Nature Biotechnology · doi:10.1038/nbt.2859 · Cited by 7,314
Scenic: single-cell regulatory network inference and clustering.
Aibar, S., González-Blas, C. B., Moerman, T., Huynh-Thu, V. A., Imrichova, H., Hulselmans, G., Rambow, F., Marine, J.-C., Geurts, P., Aerts, J., et al. (2017) · Nature Methods · doi:10.1038/nmeth.4463 · Cited by 6,520
Finak, G., McDavid, A., Yajima, M., Deng, J., Gersuk, V., Shalek, A. K., Slichter, C. K., Miller, H. W., McElrath, M. J., Prlic, M., et al. (2015) · Genome Biology · doi:10.1186/s13059-015-0844-5 · Cited by 3,159
More powerful procedures for multiple significance testing
Hochberg, Y., & Benjamini, Y. (1990) · Statistics in Medicine · doi:10.1002/sim.4780090710 · Cited by 2,715
Margolin, A. A., Nemenman, I., Basso, K., Wiggins, C., Stolovitzky, G., Favera, R. D., & Califano, A. (2006) · BMC Bioinformatics · doi:10.1186/1471-2105-7-s1-s7 · Cited by 2,420
Margolin, A. A., Nemenman, I. M., Basso, K., Wiggins, C. H., Stolovitzky, G. A., Favera, R. D., & Califano, A. (2006) · BMC Bioinformatics · doi:10.7916/d8g15zbp · Cited by 2,260
Inferring Regulatory Networks from Expression Data Using Tree-Based Methods
Huynh-Thu, V. A., Irrthum, A., Wehenkel, L., & Geurts, P. (2010) · PLoS ONE · doi:10.1371/journal.pone.0012776 · Cited by 2,131
Learning Bayesian Networks with the bnlearn R Package
Scutari, M. (2010) · Journal of Statistical Software · doi:10.18637/jss.v035.i03 · Cited by 1,978
Single-cell mRNA quantification and differential analysis with Census
Qiu, X., Hill, A. J., Packer, J. S., Lin, D., Ma, Y.-A., & Trapnell, C. (2017) · Nature Methods · doi:10.1038/nmeth.4150 · Cited by 1,904
Wisdom of crowds for robust gene network inference
The DREAM5 Consortium, Marbach, D., Costello, J. C., Küffner, R., Vega, N. M., Prill, R. J., Camacho, D. M., Allison, K. R., Kellis, M., Collins, J. J., et al. (2012) · Nature Methods · doi:10.1038/nmeth.2016 · Cited by 1,667
Faith, J. J., Hayete, B., Thaden, J. T., Mogno, I., Wierzbowski, J., Cottarel, G., Kasif, S., Collins, J. J., & Gardner, T. S. (2007) · PLoS Biology · doi:10.1371/journal.pbio.0050008 · Cited by 1,563
Estimation of entropy and mutual information
Paninski, L. (2003) · Neural Computation · doi:10.1162/089976603321780272 · Cited by 1,442
Bayesian approach to single-cell differential expression analysis
Kharchenko, P. V., Silberstein, L., & Scadden, D. T. (2014) · Nature Methods · doi:10.1038/nmeth.2967 · Cited by 1,348
Nonnegative Decomposition of Multivariate InformationPreprint
Williams, P. L., & Beer, R. (2010) · arXiv.org · doi:10.48550/arxiv.1004.2515 · Cited by 814
Buganim, Y., Faddah, D. A., Cheng, A. W., Itskovich, E., Markoulaki, S., Ganz, K., Klemm, S. L., van Oudenaarden, A., & Jaenisch, R. (2012) · Cell · doi:10.1016/j.cell.2012.08.023 · Cited by 793
Gene Regulatory Network Inference from Single-Cell Data Using Multivariate Information Measures
Chan, T. E., Stumpf, M. P. H., & Babtie, A. C. (2017) · Cell Systems · doi:10.1016/j.cels.2017.08.014 · Cited by 578
ZIFA: Dimensionality reduction for zero-inflated single-cell gene expression analysis
Pierson, E., & Yau, C. (2015) · Genome Biology · doi:10.1186/s13059-015-0805-z · Cited by 577
GeneNetWeaver: in silico benchmark generation and performance profiling of network inference methods
Schaffter, T., Marbach, D., & Floreano, D. (2011) · Bioinformatics · doi:10.1093/bioinformatics/btr373 · Cited by 549
CIDR: Ultrafast and accurate clustering through imputation for single-cell RNA-seq data
Lin, P., Troup, M., & Ho, J. W. K. (2017) · Genome biology · doi:10.1186/s13059-017-1188-0 · Cited by 541
Matsumoto, H., Kiryu, H., Furusawa, C., Ko, M. S. H., Ko, S. B. H., Gouda, N., Hayashi, T., & Nikaido, I. (2017) · Bioinformatics · doi:10.1093/bioinformatics/btx194 · Cited by 439
Moignard, V., Woodhouse, S., Haghverdi, L., Lilly, A. J., Tanaka, Y., Wilkinson, A. C., Buettner, F., Macaulay, I. C., Jawaid, W., Diamanti, E., et al. (2015) · Nature Biotechnology · doi:10.1038/nbt.3154 · Cited by 380
SINCERA: A Pipeline for Single-Cell RNA-Seq Profiling Analysis
Guo, M., Wang, H., Potter, S. S., Whitsett, J. A., & Xu, Y. J. (2015) · PLoS Computational Biology · doi:10.1371/journal.pcbi.1004575 · Cited by 357
Gama‐Castro, S., Salgado, H., Peralta-Gil, M., Santos-Zavaleta, A., Muñiz-Rascado, L., Solano-Lira, H., Jacinto, V. J., Weiss, V., García-Sotelo, J. S., López-Fuentes, A., et al. (2010) · Nucleic Acids Research · doi:10.1093/nar/gkq1110 · Cited by 353
Cell fate inclination within 2-cell and 4-cell mouse embryos revealed by single-cell RNA sequencingPreprint
Biase, F. H., Cao, X., & Zhong, S. (2014) · Genome Research · doi:10.1101/gr.177725.114 · Cited by 316
BASiCS: Bayesian Analysis of Single-Cell Sequencing Data
Vallejos, C. A., Marioni, J. C., & Richardson, S. (2015) · PLOS Computational Biology · doi:10.1371/journal.pcbi.1004333 · Cited by 302
A statistical approach for identifying differential distributions in single-cell RNA-seq experiments
Korthauer, K. D., Chu, L.-F., Newton, M. A., Li, Y., Thomson, J., Stewart, R., & Kendziorski, C. (2016) · Genome Biology · doi:10.1186/s13059-016-1077-y · Cited by 273
Greenfield, A., Madar, A., Ostrer, H., & Bonneau, R. (2010) · PLoS ONE · doi:10.1371/journal.pone.0013397 · Cited by 255
Mapping gene regulatory networks from single-cell omics data
Fiers, M. W. E. J., Minnoye, L., Aibar, S., Bravo González-Blas, C., Kalender Atak, Z., & Aerts, S. (2018) · Briefings in Functional Genomics · doi:10.1093/bfgp/elx046 · Cited by 235
Specht, A. T., & Li, J. (2017) · Bioinformatics · doi:10.1093/bioinformatics/btw729 · Cited by 193
Oscope identifies oscillatory genes in unsynchronized single-cell RNA-seq experiments
Leng, N., Chu, L., Barry, C., Li, Y., Choi, J., Li, X., Jiang, P., Stewart, R. M., Thomson, J. A., & Kendziorski, C. M. (2015) · Nature Methods · doi:10.1038/nmeth.3549 · Cited by 171
Single-cell RNA-seq reveals distinct injury responses in different types of DRG sensory neurons
Hu, G., Huang, K. Y., Hu, Y., Du, G., Xue, Z., Zhu, X., & Fan, G. (2016) · Scientific Reports · doi:10.1038/srep31851 · Cited by 159
Beta-Poisson model for single-cell RNA-seq data analyses
Vu, T. N., Wills, Q. F., Kalari, K. R., Niu, N., Wang, L., Rantalainen, M., & Pawitan, Y. (2016) · Bioinformatics · doi:10.1093/bioinformatics/btw202 · Cited by 157
Pseudotime estimation: deconfounding single cell time series
(2016) · doi:10.1093/bioinformatics/btw372 · Cited by 128
Delmans, M., & Hemberg, M. (2016) · BMC Bioinformatics · doi:10.1186/s12859-016-0944-6 · Cited by 111
Delmans, M., & Hemberg, M. (2015) · doi:10.1101/020735 · Cited by 111
Single-Cell RNA-Sequencing: Assessment of Differential Expression Analysis Methods
Dal Molin, A., Baruzzo, G., & Di Camillo, B. (2017) · Frontiers in Genetics · doi:10.3389/fgene.2017.00062 · Cited by 107
Comparison of methods to detect differentially expressed genes between single-cell populations
Jaakkola, M. K., Seyednasrollah, F., Mehmood, A., & Elo, L. L. (2016) · Briefings in Bioinformatics · doi:10.1093/bib/bbw057 · Cited by 86
BTR: training asynchronous Boolean models using single-cell expression data
Lim, C. Y., Wang, H., Woodhouse, S., Piterman, N., Wernisch, L., Fisher, J., & Göttgens, B. (2016) · BMC Bioinformatics · doi:10.1186/s12859-016-1235-y · Cited by 81
Single-cell network analysis identifies DDIT3 as a nodal lineage regulator in hematopoiesis
Pina, C., Teles, J., Fugazza, C., May, G., Wang, D., Guo, Y., Soneji, S., Brown, J., Edén, P., Ohlsson, M., et al. (2015) · Cell Reports · doi:10.1016/j.celrep.2015.05.016 · Cited by 72
Campbell, K. R., & Yau, C. (2016) · PLoS Computational Biology · doi:10.1371/journal.pcbi.1005212 · Cited by 66
Bellot, P., Olsen, C., Salembier, P., Oliveras, A., & Meyer, P. E. (2015) · BMC Bioinformatics · doi:10.1186/s12859-015-0728-4 · Cited by 50
Papatsenko, D., Darr, H., Kulakovskiy, I. V., Waghray, A., Makeev, V. J., MacArthur, B. D., & Lemischka, I. R. (2015) · Stem Cell Reports · doi:10.1016/j.stemcr.2015.07.004 · Cited by 44
Modeling the ascorbate-glutathione cycle in chloroplasts under light/dark conditions
Valero, E., Macià, H., la Fuente, I. M. D., Hernández, J. A., González-Sánchez, M.-I., & García‐Carmona, F. (2015) · BMC Systems Biology · doi:10.1186/s12918-015-0239-y · Cited by 41
Bayesian Inference for Single-cell Clustering and Imputing
Azizi, E., Prabhakaran, S., Carr, A., & Pe’er, D. (2017) · Genomics and Computational Biology · doi:10.18547/gcb.2017.vol3.iss1.e46 · Cited by 39
Guo, J., & Zheng, J. (2017) · Bioinformatics · doi:10.1093/bioinformatics/btx232 · Cited by 37
Integrated single cell data analysis reveals cell specific networks and novel coactivation markers
Ghazanfar, S., Bisogni, A. J., Ormerod, J. T., Lin, D. M., & Yang, J. Y. H. (2016) · BMC Systems Biology · doi:10.1186/s12918-016-0370-4 · Cited by 25
Processing, visualising and reconstructing network models from single‐cell data
Woodhouse, S., Moignard, V., Göttgens, B., & Fisher, J. (2015) · Immunology and Cell Biology · doi:10.1038/icb.2015.102 · Cited by 18
Cited by
Sorted by citations
Current best practices in single-cell RNA-seq analysis: a tutorial
Luecken, M. D., & Theis, F. J. (2019) · Molecular Systems Biology · doi:10.15252/msb.20188746 · Cited by 2,231
Benchmarking algorithms for gene regulatory network inference from single-cell transcriptomic data
Pratapa, A., Jalihal, A. P., Law, J. N., Bharadwaj, A., & Murali, T. M. (2020) · Nature Methods · doi:10.1038/s41592-019-0690-6 · Cited by 792
Single-cell multiomics: technologies and data analysis methods
Lee, J., Hyeon, D. Y., & Hwang, D. (2020) · Experimental & Molecular Medicine · doi:10.1038/s12276-020-0420-2 · Cited by 524
Concepts and limitations for learning developmental trajectories from single cell genomics
Tritschler, S., Büttner, M., Fischer, D. S., Lange, M., Bergen, V., Lickert, H., & Theis, F. J. (2019) · Development · doi:10.1242/dev.170506 · Cited by 242
The single-cell eQTLGen consortium
van der Wijst, M. G. P., de Vries, D., Groot, H. E., Trynka, G., Hon, C.-C., Bonder, M. J., Stegle, O., Nawijn, M. C., Idaghdour, Y., van der Harst, P., et al. (2020) · eLife · doi:10.7554/elife.52155 · Cited by 218
Metadata
- Authors
- Chen, S., & Mar, J. C.
- Affiliations
- Albert Einstein College of Medicine (US)
- Corresponding author
- Mar, Jessica C.
- Venue
- BMC Bioinformatics
- Published
- 2018-06-19
- Volume
- 19
- Issue
- 1
- Pages
- 232-232
- ISSN
- 1471-2105 (ISSN-L)
- PMC
- PMC6006753
- OpenAlex
- W2808743742
- Cited by
- 235
- References
- 49
- Citations by year
- 2026: 14 · 2025: 19 · 2024: 24 · 2023: 36 · 2022: 35 · 2021: 44 · 2020: 38 · 2019: 19 · 2018: 6
- FWCI
- 9.52
- Type
- journal article
- Language
- en
- Open access
- gold
- doi.org
- Licence
- Locations
- BMC Bioinformatics (publishedVersion, cc-by)
- Europe PMC (PubMed Central) (publishedVersion, other-oa)
- PubMed Central (publishedVersion, cc-by)
- PubMed (publishedVersion)
- DOAJ (DOAJ: Directory of Open Access Journals) (submittedVersion, cc-by-sa)
- Funders
- NYSTEM Training Grant (C030292GG)
- NYSTEM (C029154)
- Topics
- Life Sciences › Biochemistry, Genetics and Molecular Biology › Molecular Biology › Gene Regulatory Network Analysis
- Life Sciences › Biochemistry, Genetics and Molecular Biology › Molecular Biology › Single-cell and spatial transcriptomics
- Life Sciences › Biochemistry, Genetics and Molecular Biology › Molecular Biology › Bioinformatics and Genomic Networks
- Keywords
- gene regulatory network inference, single-cell gene expression, gene-gene interaction
- MeSH terms
- Algorithms, Hematopoietic Stem Cells, Humans, Computational Biology, Gene Expression Profiling, Gene Regulatory Networks, Embryonic Stem Cells, Single-Cell Analysis
About these checks
Registry, retraction, Cites and statistics results are computed, not judged, with one exception: a printed reference that no index lists is read once by a model before it counts as a citation error. Claims are extracted by a model and kept only when their quote appears verbatim in the text; each cited source is then checked, with a model’s help, for whether it says what the claim relies on. Those verdicts can be wrong — read the claim’s quote and the cited source before relying on one.
Statistics and arithmetic are recomputed, not judged.
Confidence bands are shown only for fields calibrated on our annotated test set. None is calibrated yet, so no band is shown.
What counts as a claim ›How we measure confidence ›How we check this ›
Are you an author, or do you see a problem with this page? Request a review
