

The DOI matches its Crossref record; 117 of the 117 references it cites were found in a registry or an index.
Systemic inflammation in early neonatal mice induces transient and lasting neurodegenerative effects
Open accessAbstract
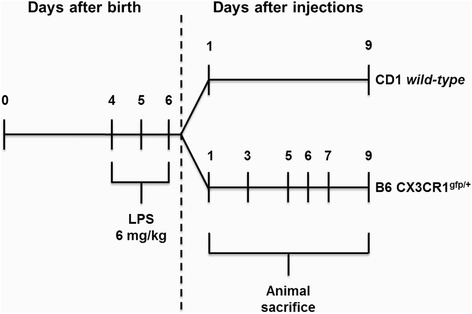
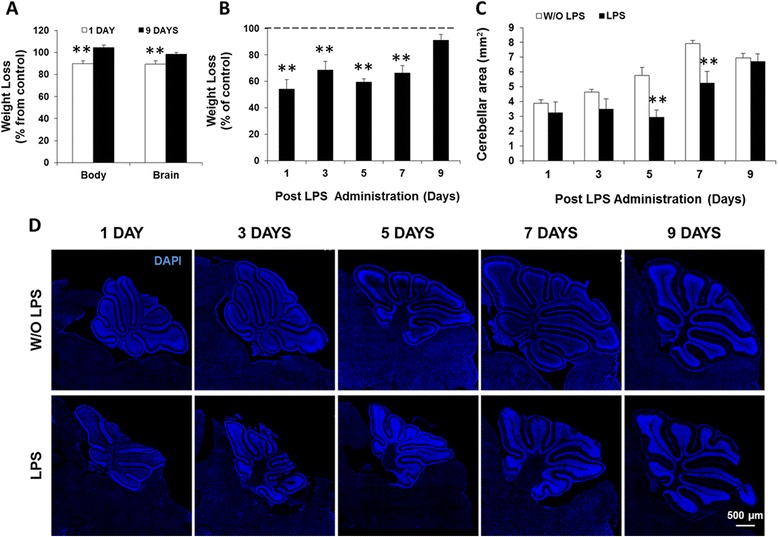
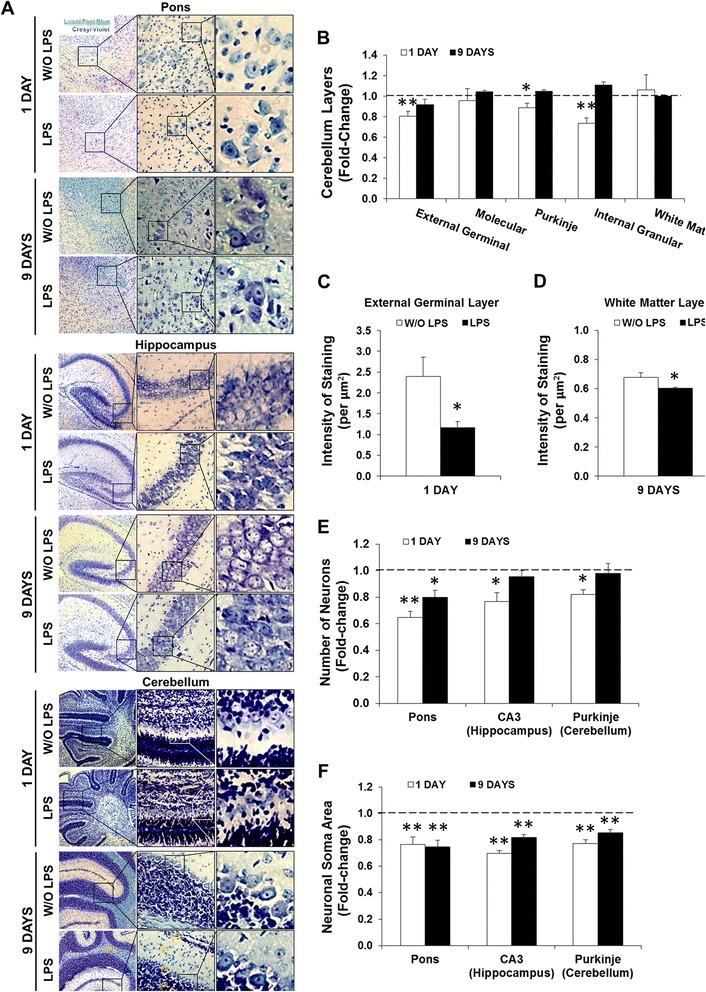
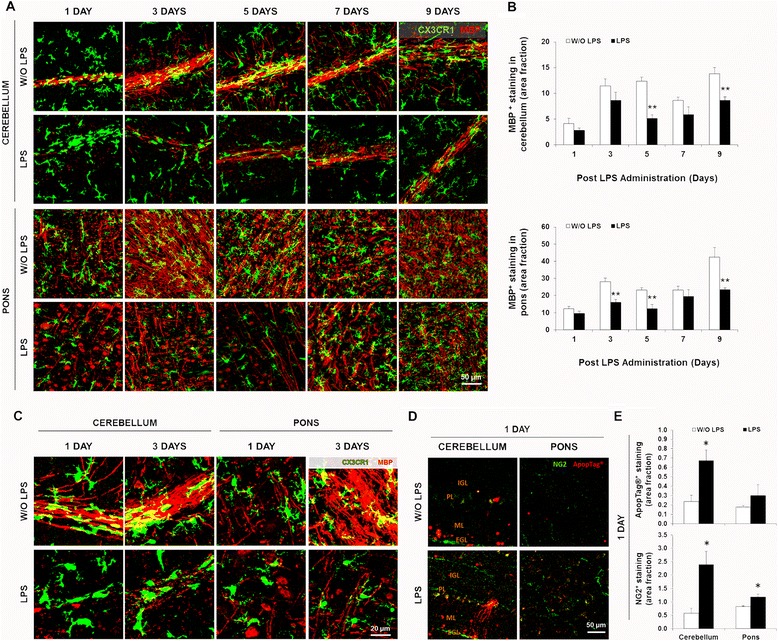
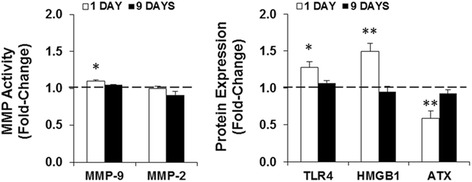
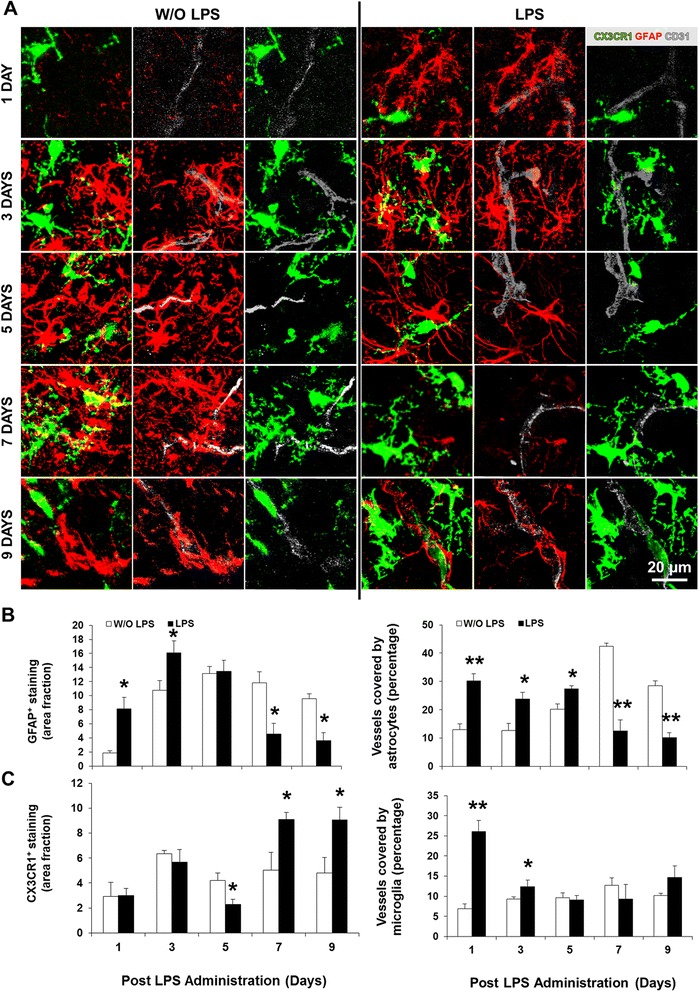
BACKGROUND: The inflammatory mediator lipopolysaccharide (LPS) has been shown to induce acute gliosis in neonatal mice. However, the progressive effects on the murine neurodevelopmental program over the week that follows systemic inflammation are not known. Thus, we investigated the effects of repeated LPS administration in the first postnatal week in mice, a condition mimicking sepsis in late preterm infants, on the developing central nervous system (CNS). METHODS: Systemic inflammation was induced by daily intraperitoneal administration (i.p.) of LPS (6 mg/kg) in newborn mice from postnatal day (PND) 4 to PND6. The effects on neurodevelopment were examined by staining the white matter and neurons with Luxol Fast Blue and Cresyl Violet, respectively. The inflammatory response was assessed by quantifying the expression/activity of matrix metalloproteinases (MMP), toll-like receptor (TLR)-4, high mobility group box (HMGB)-1, and autotaxin (ATX). In addition, B6 CX3CR1(gfp/+) mice combined with cryo-immunofluorescence were used to determine the acute, delayed, and lasting effects on myelination, microglia, and astrocytes. RESULTS: LPS administration led to acute body and brain weight loss as well as overt structural changes in the brain such as cerebellar hypoplasia, neuronal loss/shrinkage, and delayed myelination. The impaired myelination was associated with alterations in the proliferation and differentiation of NG2 progenitor cells early after LPS administration, rather than with excessive phagocytosis by CNS myeloid cells. In addition to disruptions in brain architecture, a robust inflammatory response to LPS was observed. Quantification of inflammatory biomarkers revealed decreased expression of ATX with concurrent increases in HMGB1, TLR-4, and MMP-9 expression levels. Acute astrogliosis (GFAP(+) cells) in the brain parenchyma and at the microvasculature interface together with parenchymal microgliosis (CX3CR1(+) cells) were also observed. These changes preceded the migration/proliferation of CX3CR1(+) cells around the vessels at later time points and the subsequent loss of GFAP(+) astrocytes. CONCLUSION: Collectively, our study has uncovered a complex innate inflammatory reaction and associated structural changes in the brains of neonatal mice challenged peripherally with LPS. These findings may explain some of the neurobehavioral abnormalities that develop following neonatal sepsis.
Overview
The claims and statistics of this paper haven’t been checked yet.
Run the check — free, no account needed. It reads the open-access text and checks the sources it cites.
Integrity signals
Registry
Cites
Statistics
Figures
Verification
Claims the paper makes
The claims and statistics of this paper haven’t been checked yet.
Run the check — free, no account needed. It reads the open-access text and checks the sources it cites.
Claims other papers make about this one
Each is checked against this paper’s own text: does it say what the citing paper says it does?
In the citing paper
“For instance, experimentally-induced systemic inflammation during infancy leads to neuronal loss and delayed myelination for up to a week (Cardoso et al., 2015).”
From Developmental psychoneuroendocrine and psychoneuroimmune pathways from childhood adversity to disease (2017) · cites this paper as Cardoso et al., 2015
Self-check
Percentages, sums and reported differences re-computed from the paper’s own numbers.
The self-check needs the paper’s full text.
Citations
Cites
How Matrix Metalloproteinases Regulate Cell Behavior
Sternlicht, M. D., & Werb, Z. (2001) · Annual Review of Cell and Developmental Biology · doi:10.1146/annurev.cellbio.17.1.463 · Cited by 3,959
Global, regional, and national causes of child mortality in 2008: a systematic analysis
Black, R. E., Cousens, S. N., Johnson, H. L., Lawn, J. E., Rudan, I., Bassani, D. G., Jha, P., Campbell, H. J., Walker, C. L. F., Cibulskis, R. E., et al. (2010) · The Lancet · doi:10.1016/s0140-6736(10)60549-1 · Cited by 3,062
Jung, S., Aliberti, J., Graemmel, P., Sunshine, M. J., Kreutzberg, G. W., Sher, A., & Littman, D. R. (2000) · Molecular and Cellular Biology · doi:10.1128/mcb.20.11.4106-4114.2000 · Cited by 2,632
MD-2, a Molecule that Confers Lipopolysaccharide Responsiveness on Toll-like Receptor 4
Shimazu, R., Akashi, S., Ogata, H., Nagai, Y., Fukudome, K., Miyake, K., & Kimoto, M. (1999) · The Journal of Experimental Medicine · doi:10.1084/jem.189.11.1777 · Cited by 2,187
Pericytes are required for blood–brain barrier integrity during embryogenesis
Daneman, R., Zhou, L., Kebede, A. A., & Barres, B. A. (2010) · Nature · doi:10.1038/nature09513 · Cited by 2,128
Thrombospondins are astrocyte-secreted proteins that promote CNS synaptogenesis
Christopherson, K. S., Ullian, E. M., Stokes, C. C. A., Mullowney, C. E., Hell, J. W., Agah, A., Lawler, J., Mosher, D. F., Bornstein, P., & Barres, B. A. (2005) · Cell · doi:10.1016/j.cell.2004.12.020 · Cited by 1,688
Sepsis and septic shock—A review of laboratory models and a proposal
Wichterman, K. A., Baue, A. E., & Chaudry, I. H. (1980) · Journal of Surgical Research · doi:10.1016/0022-4804(80)90037-2 · Cited by 1,466
HMGB1 is a therapeutic target for sterile inflammation and infection
Andersson, U., & Tracey, K. J. (2011) · Annual Review of Immunology · doi:10.1146/annurev-immunol-030409-101323 · Cited by 1,437
Zhan, Y., Paolicelli, R. C., Sforazzini, F., Weinhard, L., Bolasco, G., Pagani, F., Vyssotski, A. L., Bifone, A., Gozzi, A., Ragozzino, D., et al. (2014) · Nature Neuroscience · doi:10.1038/nn.3641 · Cited by 1,236
Microglia development and function
Nayak, D., Roth, T. L., & McGavern, D. B. (2014) · Annual Review of Immunology · doi:10.1146/annurev-immunol-032713-120240 · Cited by 1,154
Self-citationRosenberg, G. A., Estrada, E. Y., & Dencoff, J. E. (1998) · Stroke · doi:10.1161/01.str.29.10.2189 · Cited by 861
Microglia and neurodegeneration: The role of systemic inflammation
Cunningham, C. (2013) · Glia · doi:10.1002/glia.22350 · Cited by 769
Sepsis, severe sepsis and septic shock: changes in incidence, pathogens and outcomes
Martin, G. S. (2012) · Expert Review of Anti-infective Therapy · doi:10.1586/eri.12.50 · Cited by 680
Looking at the blood–brain barrier: Molecular anatomy and possible investigation approaches
Cardoso, F. L., Brites, D. M. T. O., & Brito, M. A. (2010) · Brain Research Reviews · doi:10.1016/j.brainresrev.2010.05.003 · Cited by 604
Self-citationThe blood-brain barrier and immune function and dysfunction
Banks, W. A., & Erickson, M. A. (2010) · Neurobiology of Disease · doi:10.1016/j.nbd.2009.07.031 · Cited by 523
Morrison, H. W., & Filosa, J. A. (2013) · Journal of Neuroinflammation · doi:10.1186/1742-2094-10-4 · Cited by 506
New MR Imaging Assessment Tool to Define Brain Abnormalities in Very Preterm Infants at Term
Kidokoro, H., Neil, J. J., & Inder, T. E. (2013) · American Journal of Neuroradiology · doi:10.3174/ajnr.a3521 · Cited by 476
Walker, A. K., Budac, D. P., Bisulco, S., Lee, A. W., Smith, R. A., Beenders, B., Kelley, K. W., & Dantzer, R. (2013) · Neuropsychopharmacology · doi:10.1038/npp.2013.71 · Cited by 432
Nitric oxide suppresses NLRP3 inflammasome activation and protects against LPS-induced septic shock
Mao, K., Chen, S., Chen, M., Ma, Y., Wang, Y., Huang, B., He, Z., Zeng, Y., Hu, Y., Sun, S., et al. (2013) · Cell Research · doi:10.1038/cr.2013.6 · Cited by 408
Systemic inflammation disrupts the developmental program of white matter
Favrais, G., van de Looij, Y., Fleiss, B., Ramanantsoa, N., Bonnin, P., Stoltenburg, G., Lacaud, A., Saliba, É., Dammann, O., Gallego, J., et al. (2011) · Annals of Neurology · doi:10.1002/ana.22489 · Cited by 403
Challenges in the diagnosis and management of neonatal sepsis
Vera, A. G. Z., & Ochoa, T. J. (2015) · Journal of Tropical Pediatrics · doi:10.1093/tropej/fmu079 · Cited by 387
Tertiary mechanisms of brain damage: a new hope for treatment of cerebral palsy?
Fleiss, B., & Gressèns, P. (2012) · The Lancet Neurology · doi:10.1016/s1474-4422(12)70058-3 · Cited by 380
Schlapbach, L. J., Aebischer, M. C., Adams, M., Natalucci, G., Bonhoeffer, J., Latzin, P., Nelle, M., Bucher, H. U., Latal, B., & the Swiss Neonatal Network and Follow-Up Group (2011) · PEDIATRICS · doi:10.1542/peds.2010-3338 · Cited by 363
Minimal penetration of lipopolysaccharide across the murine blood–brain barrier
Banks, W. A., & Robinson, S. M. (2010) · Brain, Behavior, and Immunity · doi:10.1016/j.bbi.2009.09.001 · Cited by 356
Behavioral functions of the CA3 subregion of the hippocampusPreprint
Kesner, R. P. (2007) · Learning & Memory · doi:10.1101/lm.688207 · Cited by 337
Morphometric characterization of microglial phenotypes in human cerebral cortex
Torres-Platas, S. G., Comeau, S., Rachalski, A., Bo, G. D., Cruceanu, C., Turecki, G., Giros, B., & Mechawar, N. (2014) · Journal of Neuroinflammation · doi:10.1186/1742-2094-11-12 · Cited by 329
Huang, D., Shi, F., Jung, S., Pien, G. C., Wang, J., Salazar‐Mather, T. P., He, T. T., Weaver, J., Ljunggren, H., Biron, C. A., et al. (2006) · The FASEB Journal · doi:10.1096/fj.05-5465com · Cited by 292
Neurovascular Unit: a Focus on Pericytes
Sá-Pereira, I., Brites, D. M. T. O., & Brito, M. A. (2012) · Molecular Neurobiology · doi:10.1007/s12035-012-8244-2 · Cited by 280
Self-citationInfection-induced inflammation and cerebral injury in preterm infants
Strunk, T., Inder, T. E., Wang, X., Burgner, D. P., Mallard, C. E., & Levy, O. (2014) · The Lancet Infectious Diseases · doi:10.1016/s1473-3099(14)70710-8 · Cited by 269
Erickson, M. A., & Banks, W. A. (2011) · Brain Behavior and Immunity · doi:10.1016/j.bbi.2011.06.006 · Cited by 262
Lysoglycerophospholipids in chronic inflammatory disorders: The PLA2/LPC and ATX/LPA axes
Sevastou, I. G., Kaffe, E., Mouratis, M.-A., & Aidinis, V. (2012) · Biochimica et Biophysica Acta (BBA) - Molecular and Cell Biology of Lipids · doi:10.1016/j.bbalip.2012.07.019 · Cited by 250
Microglia in the developing brain: a potential target with lifetime effects
Harry, G. J., & Kraft, A. D. (2012) · NeuroToxicology · doi:10.1016/j.neuro.2012.01.012 · Cited by 250
Nguyen, M. D., D'Aigle, T., Gowing, G., Julien, J.-P., & Rivest, S. (2004) · The Journal of Neuroscience · doi:10.1523/jneurosci.4786-03.2004 · Cited by 248
Neurodegeneration by Activation of the Microglial Complement-Phagosome Pathway
Bodea, L.-G., Wang, Y., Linnartz-Gerlach, B., Kopatz, J., Sinkkonen, L., Musgrove, R., Kaoma, T., Muller, A., Vallar, L., Di Monte, D. A., et al. (2014) · Journal of Neuroscience · doi:10.1523/jneurosci.5002-13.2014 · Cited by 234
Lutz, S. E., Zhao, Y., Gulinello, M. E., Lee, S. C., Raine, C. S., & Brosnan, C. F. (2009) · Journal of Neuroscience · doi:10.1523/jneurosci.0341-09.2009 · Cited by 228
Modeling sepsis in the laboratory: merging sound science with animal well-being.
Nemzek, J. A., Hugunin, K. M. S., & Opp, M. R. (2008) · PubMed Central · Cited by 221
Nishioku, T., Dohgu, S., Takata, F., Eto, T., Ishikawa, N., Kodama, K., Nakagawa, S., Yamauchi, A., & Kataoka, Y. (2008) · Cellular and Molecular Neurobiology · doi:10.1007/s10571-008-9322-x · Cited by 213
Neonatal Infection and 5-year Neurodevelopmental Outcome of Very Preterm Infants
Mitha, A., Foix-L'Hélias, L., Arnaud, C., Marret, S., Vieux, R., Aujard, Y., Thiriez, G., Larroque, B., Cambonie, G., Burguet, A., et al. (2013) · PEDIATRICS · doi:10.1542/peds.2012-3979 · Cited by 205
Mechanisms of Mortality in Early and Late Sepsis
Xiao, H., Siddiqui, J., & Remick, D. G. (2006) · Infection and Immunity · doi:10.1128/iai.01220-05 · Cited by 197
Basement Membrane Proteins Influence Brain Capillary Endothelial Barrier Function In Vitro
Tilling, T., Korte, D., Hoheisel, D., & Galla, H. (1998) · Journal of Neurochemistry · doi:10.1046/j.1471-4159.1998.71031151.x · Cited by 192
Qiu, J., Xu, J., Zheng, Y., Wei, Y., Zhu, X., Lo, E. H., Moskowitz, M. A., & Sims, J. R. (2010) · Stroke · doi:10.1161/strokeaha.110.590463 · Cited by 190
Rousset, C. I., Chalon, S., Cantagrel, S., Bodard, S., Andres, C. R., Gressèns, P., & Saliba, É. (2006) · Pediatric Research · doi:10.1203/01.pdr.0000199905.08848.55 · Cited by 181
Systemic Stimulation of TLR2 Impairs Neonatal Mouse Brain Development
Du, X., Fleiss, B., Li, H., D’Angelo, B., Sun, Y., Zhu, C., Hagberg, H., Levy, O., Mallard, C. E., & Wang, X. (2011) · PLoS ONE · doi:10.1371/journal.pone.0019583 · Cited by 178
Neuronal damage accompanies perinatal white-matter damage
Leviton, A., & Gressèns, P. (2007) · Trends in Neurosciences · doi:10.1016/j.tins.2007.05.009 · Cited by 175
Lipopolysaccharide-induced sepsis induces long-lasting affective changes in the mouse
Anderson, S. T., Commins, S., Moynagh, P. N., & Coogan, A. N. (2014) · Brain Behavior and Immunity · doi:10.1016/j.bbi.2014.07.007 · Cited by 175
Long-term impact of systemic bacterial infection on the cerebral vasculature and microglia
Püntener, U., Booth, S. G., Perry, V. H., & Teeling, J. L. (2012) · Journal of Neuroinflammation · doi:10.1186/1742-2094-9-146 · Cited by 172
Lipopolysaccharide Sensitizes Neonatal Hypoxic-Ischemic Brain Injury in a MyD88-Dependent Manner
Wang, X., Stridh, L., Li, W., Dean, J. M., Elmgren, A., Gan, L., Eriksson, K., Hagberg, H., & Mallard, C. E. (2009) · The Journal of Immunology · doi:10.4049/jimmunol.0900762 · Cited by 171
Tripathi, A. K., Sha, W., Shulaev, V., Stins, M. F., & Sullivan, D. J. (2009) · Blood · doi:10.1182/blood-2009-06-226415 · Cited by 166
Hyper innate responses in neonates lead to increased morbidity and mortality after infection
Zhao, J., Kim, K. D., Yang, X., Auh, S. L., Fu, Y., & Tang, H. (2008) · Proceedings of the National Academy of Sciences · doi:10.1073/pnas.0800152105 · Cited by 164
Microglia change from a reactive to an age-like phenotype with the time in culture
Caldeira, C., Oliveira, A. F., Cunha, C., Vaz, A. R., Falcão, A. S., Fernandes, A., & Brites, D. (2014) · Frontiers in Cellular Neuroscience · doi:10.3389/fncel.2014.00152 · Cited by 156
Self-citationAlshaikh, B. N., Yusuf, K., & SAUVE, R. S. (2013) · Journal of Perinatology · doi:10.1038/jp.2012.167 · Cited by 155
Agnello, D., Wang, H., Yang, H., Tracey, K. J., & Ghezzi, P. (2002) · Cytokine · doi:10.1006/cyto.2002.0890 · Cited by 148
Microglia and synapse interactions: fine tuning neural circuits and candidate molecules
Miyamoto, A., Wake, H., Moorhouse, A. J., & Nabekura, J. (2013) · Frontiers in Cellular Neuroscience · doi:10.3389/fncel.2013.00070 · Cited by 147
Erickson, M. A., Hartvigson, P. E., Morofuji, Y., Owen, J. B., Butterfield, D. A., & Banks, W. A. (2012) · Journal of Neuroinflammation · doi:10.1186/1742-2094-9-150 · Cited by 145
Bland, S. T., Beckley, J. T., Young, S., Tsang, V., Watkins, L. R., Maier, S. F., & Bilbo, S. D. (2009) · Brain Behavior and Immunity · doi:10.1016/j.bbi.2009.09.012 · Cited by 140
Dinel, A., Joffre, C., Trifilieff, P., Aubert, A., Foury, A., Ruyet, P. L., & Layé, S. (2014) · Journal of Neuroinflammation · doi:10.1186/s12974-014-0155-x · Cited by 139
Brochu, M., Girard, S., Lavoie, K., & Sébire, G. (2011) · Journal of Neuroinflammation · doi:10.1186/1742-2094-8-55 · Cited by 128
Prolonged Neuroinflammation after Lipopolysaccharide Exposure in Aged Rats
Fu, H. Q., Yang, T., Xiao, W. L., Fan, L., Wu, Y., Terrando, N., & Wang, T. L. (2014) · PLoS ONE · doi:10.1371/journal.pone.0106331 · Cited by 127
Cardoso, F. L., Kittel, Á., Veszelka, S., Palmela, I., Tóth, A. E., Brites, D. M. T. O., Deli, M. A., & Brito, M. A. (2012) · PLoS ONE · doi:10.1371/journal.pone.0035919 · Cited by 111
Self-citationIn vivo dynamics of innate immune sentinels in the CNS
Nayak, D., Zinselmeyer, B. H., Corps, K. N., & McGavern, D. B. (2012) · IntraVital · doi:10.4161/intv.22823 · Cited by 109
Self-citationJeong, H., Jou, I., & Joe, E.-H. (2010) · Experimental & Molecular Medicine · doi:10.3858/emm.2010.42.12.085 · Cited by 104
Girard, S., Sébire, H., Brochu, M., Briota, S., Sarret, P., & Sébire, G. (2012) · Brain Behavior and Immunity · doi:10.1016/j.bbi.2012.09.001 · Cited by 102
Systemic inflammation, oligodendroglial maturation, and the encephalopathy of prematurity
Volpe, J. J. (2011) · Annals of Neurology · doi:10.1002/ana.22533 · Cited by 98
Pang, Y., Fan, L., Tien, L., Dai, X., Zheng, B., Cai, Z., Lin, R. C. S., & Bhatt, A. (2013) · Brain and Behavior · doi:10.1002/brb3.152 · Cited by 98
Sherwin, C. M. T., & Fern, R. F. (2005) · The Journal of Immunology · doi:10.4049/jimmunol.175.1.155 · Cited by 94
Hulshof, S. C. J., van Haastert, E. S., Kuipers, H. F., van den Elsen, P. J., Groot, C. J. A. D., van der Valk, P., Ravid, R., & Biber, K. P. H. (2003) · Journal of Neuropathology & Experimental Neurology · doi:10.1093/jnen/62.9.899 · Cited by 93
Innate Immune Deficiency of Extremely Premature Neonates Can Be Reversed by Interferon-γ
Tissières, P., Ochoda, A., Dunn-Siegrist, I., Drifte, G., Morales, M. A., Pfister, R. E., Berner, M. E., & Pugin, J. (2012) · PLoS ONE · doi:10.1371/journal.pone.0032863 · Cited by 84
Smith, P. L. P., Hagberg, H., Naylor, A. S., & Mallard, C. E. (2014) · Developmental Neuroscience · doi:10.1159/000359950 · Cited by 83
Falcão, A. S., Fernandes, A. M. A., Brito, M. A., Silva, R. F. M., & Brites, D. M. T. O. (2005) · Neurobiology of Disease · doi:10.1016/j.nbd.2005.03.001 · Cited by 83
Self-citationGranger, J. I., Ratti, P.-L., Datta, S. C., Raymond, R. M., & Opp, M. R. (2013) · Psychoneuroendocrinology · doi:10.1016/j.psyneuen.2012.10.010 · Cited by 82 · cited 1×
“A sustained glial response to LPS was recently described in the hippocampus and brainstem of adult mice following induction of sepsis [100].”
BackgroundStarr, M. E., Ueda, J., Takahashi, H., Weiler-Guettler, H., Esmon, C. T., Evers, B. M., & Saitō, H. (2010) · Blood · doi:10.1182/blood-2009-10-246678 · Cited by 82
Chronic Sepsis Mortality Characterized by an Individualized Inflammatory Response
Osuchowski, M. F., Welch, K. B., Yang, H., Siddiqui, J., & Remick, D. G. (2007) · The Journal of Immunology · doi:10.4049/jimmunol.179.1.623 · Cited by 82
Hentges, C. R., Silveira, R. C., Procianoy, R. S., Carvalho, C. G., Filipouski, G. R., Fuentefria, R. D. N., Marquezotti, F., & Terrazzan, A. C. (2013) · Jornal de Pediatria · doi:10.1016/j.jped.2013.10.002 · Cited by 81
Lawson, M. A., McCusker, R. H., & Kelley, K. W. (2013) · Journal of Neuroinflammation · doi:10.1186/1742-2094-10-54 · Cited by 80
Perinatal Infections and Cerebral Palsy
Hermansen, M. C., & Hermansen, M. G. (2006) · Clinics in Perinatology · doi:10.1016/j.clp.2006.03.002 · Cited by 80
Lamar, C. D., Hurley, R. A., & Taber, K. H. (2011) · Journal of Neuropsychiatry · doi:10.1176/jnp.23.3.jnp237 · Cited by 77
Pentoxifylline decreases body weight loss and muscle protein wasting characteristics of sepsis
Breuillé, D., Farge, M. C., Rose, F., Arnal, M., Attaix, D., & Obled, C. (1993) · American Journal of Physiology-Endocrinology and Metabolism · doi:10.1152/ajpendo.1993.265.4.e660 · Cited by 77
Lin, H.-Y., Huang, C., & Chang, K. F. (2009) · Pediatric Research · doi:10.1203/pdr.0b013e3181b0d336 · Cited by 76
Chung, D. W., Yoo, K., Hwang, I. K., Kim, D. W., Chung, J. Y., Lee, C. H., Choi, J. H., Choi, S. Y., Youn, H. Y., Lee, I. S., et al. (2009) · Cellular and Molecular Neurobiology · doi:10.1007/s10571-009-9477-0 · Cited by 73
Effects of intrauterine inflammation on the developing mouse brain
Wang, X., Hagberg, H., Zhu, C., Jacobsson, B., & Mallard, C. E. (2007) · Brain Research · doi:10.1016/j.brainres.2007.01.083 · Cited by 72
Nimmervoll, B. V., White, R., Yang, J., An, S., Henn, C., Sun, J., & Luhmann, H. J. (2012) · Cerebral Cortex · doi:10.1093/cercor/bhs156 · Cited by 71
Fan, L.-W., Kaizaki, A., Tien, L., Pang, Y., Tanaka, S., Numazawa, S., Bhatt, A., & Cai, Z. (2013) · Neuroscience · doi:10.1016/j.neuroscience.2013.02.041 · Cited by 70
Lu, D. C.-T., Zador, Z. E., Yao, J., Fazlollahi, F., & Manley, G. T. (2011) · Journal of Neurotrauma · doi:10.1089/neu.2011.2114 · Cited by 68
Aïd, S., Silva, A. C., Candelario‐Jalil, E., Choi, S., Rosenberg, G. A., & Bosetti, F. (2009) · Journal of Cerebral Blood Flow & Metabolism · doi:10.1038/jcbfm.2009.223 · Cited by 68
Gómez‐Nicola, D., Valle‐Argos, B., Pita-Thomas, D. W., & Nieto‐Sampedro, M. (2008) · Glia · doi:10.1002/glia.20628 · Cited by 67
Unique Features of the Human Brainstem and Cerebellum
Baizer, J. S. (2014) · Frontiers in Human Neuroscience · doi:10.3389/fnhum.2014.00202 · Cited by 65
Dohgu, S., Fleegal, M. A., & Banks, W. A. (2011) · Journal of Neuroinflammation · doi:10.1186/1742-2094-8-167 · Cited by 60
Autotaxin Downregulates LPS‐Induced Microglia Activation and Pro‐Inflammatory Cytokines Production
Awada, R., Saulnier‐Blache, J. S., Grès, S., Bourdon, E., Rondeau, P., Parimisetty, A., Orihuela, R., Harry, G. J., & d’Hellencourt, C. L. (2014) · Journal of Cellular Biochemistry · doi:10.1002/jcb.24889 · Cited by 58
Maternal Exposure to Lipopolysaccharide Leads to Transient Motor Dysfunction in Neonatal Rats
Rousset, C. I., Kassem, J., Aubert, A., Planchenault, D., Gressèns, P., Chalon, S., Belzung, C., & Saliba, É. (2013) · Developmental Neuroscience · doi:10.1159/000346579 · Cited by 57
Ikeda, T., Li, Y., Ikenoue, T., Mallard, C. E., & Hagberg, H. (2005) · Pediatric Research · doi:10.1203/01.pdr.0000191140.87314.ce · Cited by 54
Ming, Z., Sawicki, G., & Bekar, L. (2015) · Neuroscience Letters · doi:10.1016/j.neulet.2015.01.081 · Cited by 54
Quality of life after septic illness
Lazosky, A., Young, G. B., Zirul, S., & Phillips, R. (2009) · Journal of Critical Care · doi:10.1016/j.jcrc.2009.10.001 · Cited by 53
Thomas, R. C., Bath, M., Stover, C. M., Lambert, D. G., & Thompson, J. P. (2014) · Peptides · doi:10.1016/j.peptides.2014.08.009 · Cited by 53
Albert, J., Radomski, A. D., Soop, A., Sollevi, A., FROSTELL, C. G., & Radomski, M. W. (2003) · Acta Anaesthesiologica Scandinavica · doi:10.1034/j.1399-6576.2003.00059.x · Cited by 49
Infection-Induced Vulnerability of Perinatal Brain Injury
Mallard, C. E., & Wang, X. (2011) · Neurology Research International · doi:10.1155/2012/102153 · Cited by 48
Kaya, M., Palandüz, A., Kalaycı, R., Kemikler, G., Şimşek, G., Bılgıç, B., Ahıshalı, B., Arıcan, N., Kocyildiz, Z. C., Elmas, İ., et al. (2004) · Brain Research · doi:10.1016/j.brainres.2004.05.102 · Cited by 47
Autotaxin protects microglial cells against oxidative stress
Awada, R., Rondeau, P., Grès, S., Saulnier‐Blache, J. S., d’Hellencourt, C. L., & Bourdon, E. (2011) · Free Radical Biology and Medicine · doi:10.1016/j.freeradbiomed.2011.11.014 · Cited by 46
van den Heuij, L. G., Mathai, S., Davidson, J. O., Lear, C. A., Booth, L. C., Fraser, M., Gunn, A. J., & Bennet, L. (2014) · Journal of Neuroinflammation · doi:10.1186/1742-2094-11-89 · Cited by 43
Jin, L., Li, J., Nation, R. L., & Nicolazzo, J. A. (2010) · Antimicrobial Agents and Chemotherapy · doi:10.1128/aac.01273-10 · Cited by 42
Decreased survival of newborn neurons in the dorsal hippocampus after neonatal LPS exposure in mice
Järlestedt, K., Naylor, A. S., Dean, J. M., Hagberg, H., & Mallard, C. E. (2013) · Neuroscience · doi:10.1016/j.neuroscience.2013.08.040 · Cited by 42
White Matter Damage After Chronic Subclinical Inflammation in Newborn Mice
Wang, X., Hellgren, G., Löfqvist, C., Li, W., Hellström, A., Hagberg, H., & Mallard, C. E. (2009) · Journal of Child Neurology · doi:10.1177/0883073809338068 · Cited by 41
Brites, D. M. T. O., & Fernandes, A. M. A. (2014) · Seminars in Fetal and Neonatal Medicine · doi:10.1016/j.siny.2014.12.002 · Cited by 40
Self-citationPredictors of Mortality in Neonatal Septicemia in an Underresourced Setting
Ogunlesi, T. A., & Ogunfowora, O. B. (2010) · Journal of the National Medical Association · doi:10.1016/s0027-9684(15)30710-0 · Cited by 40
Kato, S., Hussein, M. H., Kakita, H., Goto, T., Daoud, G. A.-H., Kato, T., Sugiura, T., Nobata, M., Nakajima, Y., Endo, T., et al. (2009) · Shock · doi:10.1097/shk.0b013e3181a2b886 · Cited by 35
Grab, D. J., Chakravorty, S. J., van der Heyde, H., & Stins, M. F. (2011) · Cellular Microbiology · doi:10.1111/j.1462-5822.2011.01661.x · Cited by 35
Cerebral Palsy: Science and Clinical Practice
Boltshauser, E. (2015) · Neuropediatrics · doi:10.1055/s-0035-1547342 · Cited by 34
Perinatal inflammation results in decreased oligodendrocyte numbers in adulthood
Graf, A. E., Haines, K. M., Pierson, C. R., Bolon, B. N., Houston, R. H., Velten, M., Heyob, K. M., & Rogers, L. K. (2013) · Life Sciences · doi:10.1016/j.lfs.2013.11.015 · Cited by 31
Ratilal, B. O., Arroja, M. M. C., Rocha, J. P., Fernandes, A. M. A., Barateiro, A. P., Brites, D. M. T. O., Pinto, R. M. A., Sepodes, B. M. N., & Mota‐Filipe, H. (2014) · Journal of neurosurgery · doi:10.3171/2014.2.jns132197 · Cited by 29
Self-citationPang, Y., Fan, L., Zheng, B., Campbell, L. R., Cai, Z., & Rhodes, P. G. (2012) · Pediatric Research · doi:10.1038/pr.2012.9 · Cited by 23
Goto, T., Hussein, M. H., Kato, S., Daoud, G. A.-H., Kato, T., Kakita, H., Mizuno, H., Imai, M., Ito, T., Kato, I., et al. (2010) · Intensive Care Medicine · doi:10.1007/s00134-010-2040-0 · Cited by 19
Purkinje cell loss and motor coordination defects in profilin1 mutant mice
Kullmann, J. A., Neumeyer, A., Wickertsheim, I., Böttcher, R. T., Costell, M., Deitmer, J. W., Witke, W., Friauf, E., & Rust, M. B. (2012) · Neuroscience · doi:10.1016/j.neuroscience.2012.07.055 · Cited by 19
Cardiac Function and Circulating Cytokines Following Endotoxin Exposure in Neonatal Mice
Mukherjee, R. D., McQuinn, T. C., Dugan, M. A., Saul, J. P., & Spinale, F. G. (2010) · Pediatric Research · doi:10.1203/pdr.0b013e3181efbe10 · Cited by 18
Cross-Talk Between Neurons and Astrocytes in Response to Bilirubin: Adverse Secondary Impacts
Falcão, A. S., Silva, R. F. M., Vaz, A. R., Gomes, C., Fernandes, A. M. A., Barateiro, A. P., Tiribelli, C., & Brites, D. M. T. O. (2013) · Neurotoxicity Research · doi:10.1007/s12640-013-9427-y · Cited by 17
Self-citationShi, W., Zhao, C.-Z., Zhao, B., Zheng, X.-L., Fang, S., Lu, Y., Zhang, W.-P., Chen, Z., & Wei, E.-Q. (2012) · Neuroscience Bulletin · doi:10.1007/s12264-012-1063-7 · Cited by 17
Dilek, M., Kumral, A., Okyay, E., Özbal, S., Tuğyan, K., Tüzün, F., Sever, A., Yılmaz, O., Duman, N., & Özkan, H. (2013) · The Journal of Maternal-Fetal & Neonatal Medicine · doi:10.3109/14767058.2013.798290 · Cited by 12
Energy and Tissue Fuel in Human Injury and Sepsis
Kinney, J. M., Gump, F. E., & Long, C. L. (1973) · Advances in experimental medicine and biology · doi:10.1007/978-1-4684-3228-2_41 · Cited by 9
Cited by
Sorted by citations
The blood-brain barrier in systemic inflammation
Varatharaj, A., & Galea, I. (2017) · Brain, Behavior, and Immunity · doi:10.1016/j.bbi.2016.03.010 · Cited by 1,172
The blood-brain barrier in aging and neurodegeneration
Knox, E. G., Aburto, M. R., Clarke, G., Cryan, J. F., & O’Driscoll, C. M. (2022) · Molecular Psychiatry · doi:10.1038/s41380-022-01511-z · Cited by 738
Disrupting the blood–brain barrier by focused ultrasound induces sterile inflammation
Kovacs, Z. I., Kim, S., Jikaria, N., Qureshi, F., Milo, B., Lewis, B. K., Bresler, M., Burks, S. R., & Frank, J. A. (2017) · Proceedings of the National Academy of Sciences · doi:10.1073/pnas.1614777114 · Cited by 458
Systemic inflammation impairs microglial Aβ clearance through NLRP3 inflammasome
Tejera, D., Mercan, D., Sanchez‐Caro, J. M., Hanan, M., Greenberg, D., Soreq, H., Latz, E., Golenbock, D., & Heneka, M. T. (2019) · The EMBO Journal · doi:10.15252/embj.2018101064 · Cited by 351
The Impact of Systemic Inflammation on Alzheimer’s Disease Pathology
Xie, J., Van Hoecke, L., & Vandenbroucke, R. E. (2022) · Frontiers in Immunology · doi:10.3389/fimmu.2021.796867 · Cited by 324
Metadata
- Authors
- Cardoso, F. L., Herz, J., Fernandes, A., Rocha, J., Sepodes, B., Brito, M. A., McGavern, D. B., & Brites, D.
- Affiliations
- University of Lisbon (PT)
- National Institutes of Health (US)
- Corresponding author
- McGavern, Dorian B
- Brites, Dora
- ORCID
- Venue
- Journal of Neuroinflammation
- Published
- 2015-04-29
- Volume
- 12
- Issue
- 1
- Pages
- 82-82
- ISSN
- 1742-2094 (ISSN-L)
- PMC
- PMC4440597
- OpenAlex
- W2031096177
- Cited by
- 103
- References
- 117
- Citations by year
- 2026: 4 · 2025: 3 · 2024: 7 · 2023: 13 · 2022: 13 · 2021: 3 · 2020: 18 · 2019: 12 · 2018: 6 · 2017: 13 · 2016: 10 · 2015: 1
- FWCI
- 5.33
- Type
- journal article
- Language
- en
- Open access
- gold
- doi.org
- Locations
- Journal of Neuroinflammation (publishedVersion, cc-by)
- PubMed Central (publishedVersion, cc-by)
- PubMed (publishedVersion)
- Funders
- Universidade de Lisboa
- Fundação Luso-Americana para o Desenvolvimento
- National Institutes of Health
- Fundação para a Ciência e a Tecnologia (COMPETE, PTDC/SAU-FAR/118787/2010, SFRH/BD/62959/2009, /2009)
- Topics
- Life Sciences › Neuroscience › Neurology › Neuroinflammation and Neurodegeneration Mechanisms
- Health Sciences › Medicine › Pediatrics, Perinatology and Child Health › Neonatal and fetal brain pathology
- Health Sciences › Medicine › Pediatrics, Perinatology and Child Health › Neonatal and Maternal Infections
- Keywords
- systemic inflammation, lipopolysaccharide, neonatal sepsis, brain development, myelination, cerebellar hypoplasia, neuroinflammation, astrocyte activation, microglial activation, autotaxin, HMGB1, TLR4, MMP-9, CX3CR1, astrocyte loss
- MeSH terms
- CX3C Chemokine Receptor 1, Age Factors, Anethole Trithione, Animals, Animals, Newborn, Body Weight, Cerebellum, Developmental Disabilities, Demyelinating Diseases, Myelin Basic Protein, Gene Expression Regulation, Inflammation, Lipopolysaccharides, Mice, Inbred C57BL, Mice, Transgenic, Nervous System Malformations, Time Factors, Microglia, Neurodegenerative Diseases, Receptors, Chemokine, HMGB1 Protein, Green Fluorescent Proteins, Toll-Like Receptor 4, Mice
About these checks
Registry, retraction, Cites and statistics results are computed, not judged, with one exception: a printed reference that no index lists is read once by a model before it counts as a citation error. Claims are extracted by a model and kept only when their quote appears verbatim in the text; each cited source is then checked, with a model’s help, for whether it says what the claim relies on. Those verdicts can be wrong — read the claim’s quote and the cited source before relying on one.
Statistics and arithmetic are recomputed, not judged.
Confidence bands are shown only for fields calibrated on our annotated test set. None is calibrated yet, so no band is shown.
What counts as a claim ›How we measure confidence ›How we check this ›
Are you an author, or do you see a problem with this page? Request a review
