

The DOI matches its Crossref record; 95 of the 95 references it cites were found in a registry or an index.
Ultrastructural evidence of microglial heterogeneity in Alzheimer’s disease amyloid pathology
Open accessAbstract
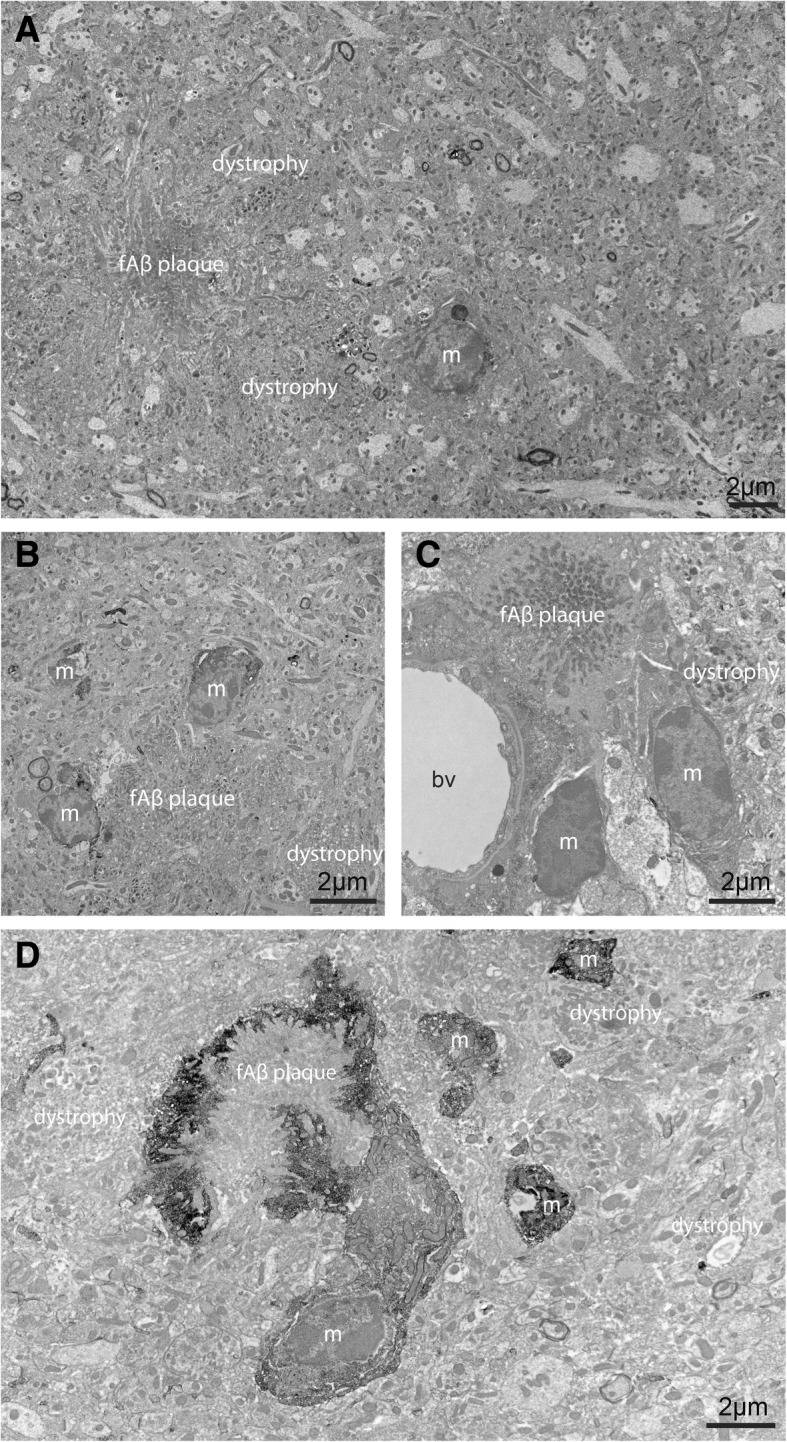
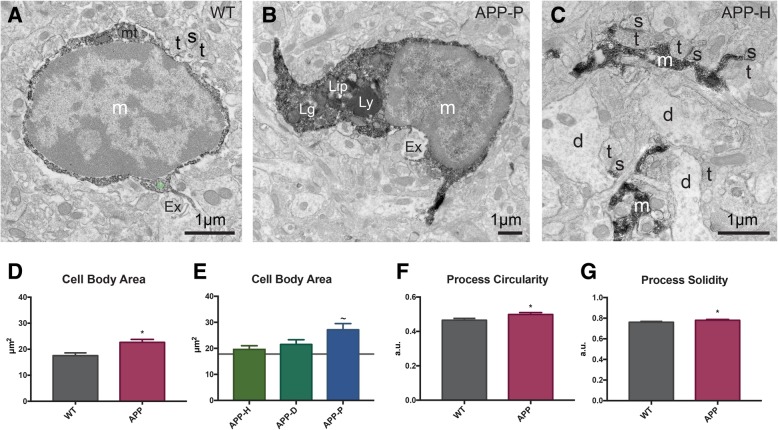
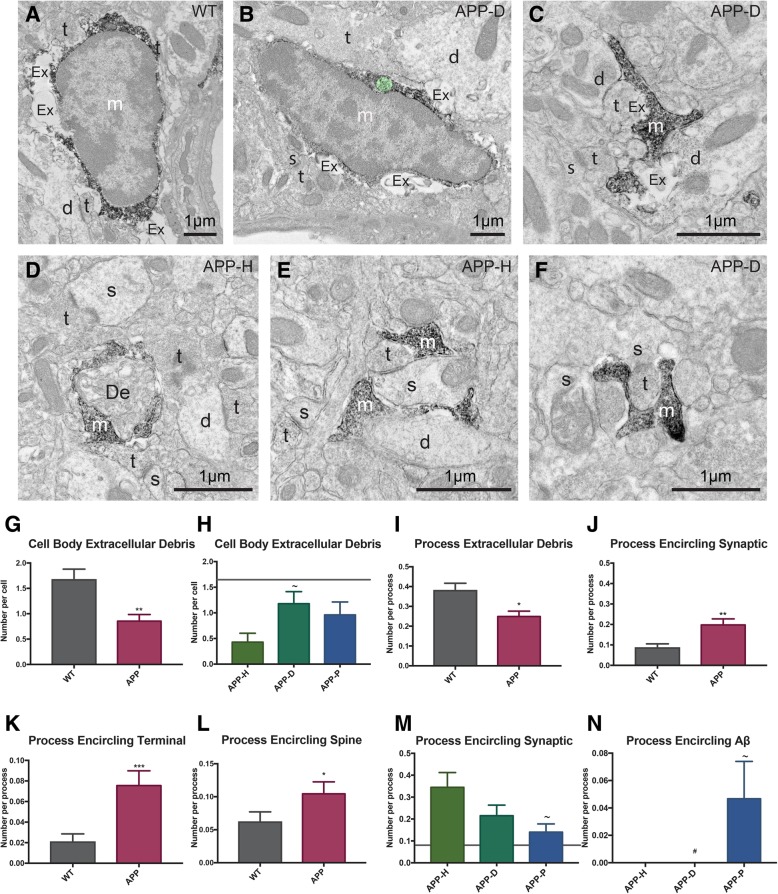
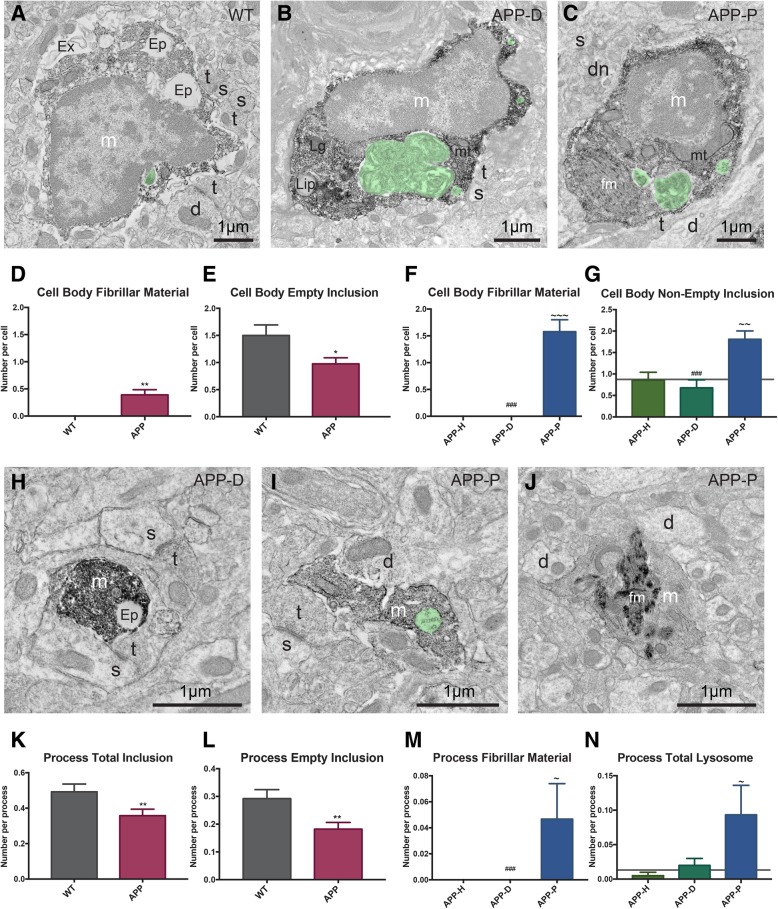
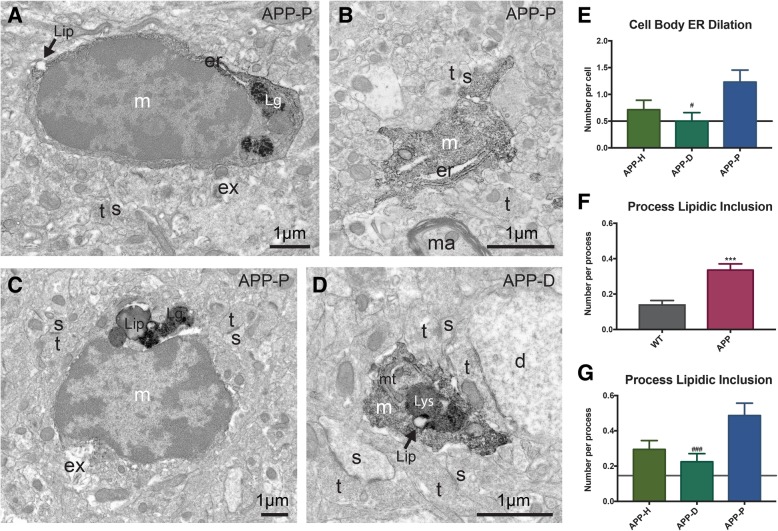
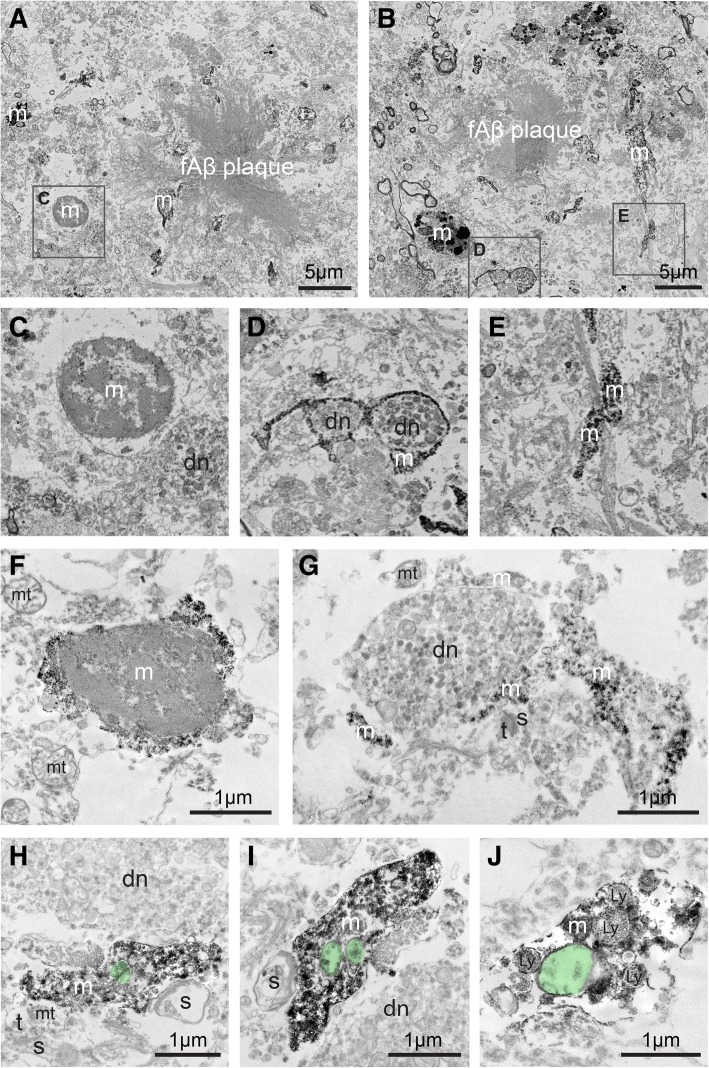
Alzheimer’s disease (AD) is the most common neurodegenerative disease, characterized by the deposition of extracellular fibrillar amyloid β (fΑβ) and the intracellular accumulation of neurofibrillary tangles. As AD progresses, Aβ drives a robust and prolonged inflammatory response via its recognition by microglia, the brain’s immune cells. Microglial reactivity to fAβ plaques may impair their normal surveillance duties, facilitating synaptic loss and neuronal death, as well as cognitive decline in AD. In the current study, we performed correlative light, transmission, and scanning electron microscopy to provide insights into microglial structural and functional heterogeneity. We analyzed microglial cell bodies and processes in areas containing fAβ plaques and neuronal dystrophy, dystrophy only, or appearing healthy, among the hippocampus CA1 of 14-month-old APPSwe-PS1Δe9 mice versus wild-type littermates. Our quantitative analysis revealed that microglial cell bodies in the AD model mice were larger and displayed ultrastructural signs of cellular stress, especially nearby plaques. Microglial cell bodies and processes were overall less phagocytic in AD model mice. However, they contained increased fibrillar materials and non-empty inclusions proximal to plaques. Microglial cell bodies and processes in AD model mice also displayed reduced association with extracellular space pockets that contained debris. In addition, microglial processes in healthy subregions of AD model mice encircled synaptic elements more often compared with plaque-associated processes. These observations in mice were qualitatively replicated in post-mortem hippocampal samples from two patients with AD (Braak stage 5). Together, our findings identify at the ultrastructural level distinct microglial transformations common to mouse and human in association with amyloid pathology.
Overview
The claims and statistics of this paper haven’t been checked yet.
Run the check — free, no account needed. It reads the open-access text and checks the sources it cites.
Integrity signals
Registry
Cites
Statistics
Figures
Verification
Claims the paper makes
The claims and statistics of this paper haven’t been checked yet.
Run the check — free, no account needed. It reads the open-access text and checks the sources it cites.
Claims other papers make about this one
Each is checked against this paper’s own text: does it say what the citing paper says it does?
The cited source says what the claim attributes to it.
In the citing paper
“In addition, in areas with limited plaque pathology, microglial processes encircled synaptic elements more often compared with plaque-associated processes [57].”
From Microglia specific deletion of miR-155 in Alzheimer’s disease mouse models reduces amyloid-β pathology but causes hyperexcitability and seizures (2023) · cites this paper as [57]
The cited source says what the claim attributes to it.
In the citing paper
“Previous studies have shown that cell bodies of microglia in AD model mice were larger and displayed ultrastructural signs of cellular stress, especially those nearby plaques and that these cells were overall less phagocytic [57].”
From Microglia specific deletion of miR-155 in Alzheimer’s disease mouse models reduces amyloid-β pathology but causes hyperexcitability and seizures (2023) · cites this paper as [57]
Self-check
Percentages, sums and reported differences re-computed from the paper’s own numbers.
The self-check needs the paper’s full text.
Citations
Cites
The Mouse Brain in Stereotaxic Coordinates
Paxinos, G. (2001) · Cited by 12,859
Sperling, R. A., Aisen, P. S., Beckett, L. A., Bennett, D. A., Craft, S., Fagan, A. M., Iwatsubo, T., Jack, C. R., Kaye, J., Montine, T. J., et al. (2011) · Alzheimer's & Dementia · doi:10.1016/j.jalz.2011.03.003 · Cited by 7,155
Resting microglial cells are highly dynamic surveillants of brain parenchyma in vivo
Nimmerjahn, A., Kirchhoff, F., & Helmchen, F. (2005) · Science · doi:10.1126/science.1110647 · Cited by 5,827
A Unique Microglia Type Associated with Restricting Development of Alzheimer’s Disease
Keren-Shaul, H., Spinrad, A., Weiner, A., Matcovitch-Natan, O., Dvir-Szternfeld, R., Ulland, T. K., David, E., Baruch, K., Lara-Astaiso, D., Toth, B., et al. (2017) · Cell · doi:10.1016/j.cell.2017.05.018 · Cited by 5,493 · cited 1×
“Microglial implication in the pathological process of AD is contextual [31, 32] and heterogeneous, as illustrated by recent single cell transcriptomic studies [33].”
BackgroundTerry, R. D., Masliah, E., Salmon, D. P., Butters, N., DeTeresa, R., Hill, R., Hansen, L. A., & Katzman, R. (1991) · Annals of Neurology · doi:10.1002/ana.410300410 · Cited by 4,397
Meta-Analysis of 74,046 Individuals Identifies 11 New Susceptibility Loci for Alzheimer’s Disease
(EADI), E. A. D. I., Lambert, J.-C., (GERAD), G. A. E. R. I. A. D., Alzheimer's Disease Genetic Consortium (ADGC), (CHARGE), C. F. H. A. A. R. I. G. E., Ibrahim-Verbaas, C. A., Harold, D., Naj, A. C., Sims, R., Bellenguez, C., et al. (2013) · Nature Genetics · doi:10.1038/ng.2802 · Cited by 4,336
Complement and microglia mediate early synapse loss in Alzheimer mouse models
Hong, S., Beja-Glasser, V. F., Nfonoyim, B. M., Frouin, A., Li, S., Ramakrishnan, S., Merry, K. M., Shi, Q., Rosenthal, A., Barres, B. A., et al. (2016) · Science · doi:10.1126/science.aad8373 · Cited by 3,343
Krasemann, S., Madore, C., Cialic, R., Baufeld, C., Calcagno, N., El Fatimy, R., Beckers, L., O’Loughlin, E., Xu, Y., Fanek, Z., et al. (2017) · Immunity · doi:10.1016/j.immuni.2017.08.008 · Cited by 2,979 · cited 1×
“Microglial implication in the pathological process of AD is contextual [31, 32] and heterogeneous, as illustrated by recent single cell transcriptomic studies [33].”
BackgroundVariant of TREM2 Associated with the Risk of Alzheimer's Disease
Jonsson, T., Stefansson, H., Steinberg, S., Jonsdottir, I., Jonsson, P. V., Snaedal, J., Bjornsson, S., Huttenlocher, J., Levey, A. I., Lah, J. J., et al. (2013) · New England Journal of Medicine · doi:10.1056/nejmoa1211103 · Cited by 2,558
Extensive Involvement of Autophagy in Alzheimer Disease: An Immuno-Electron Microscopy Study
Nixon, R. A., Wegiel, J., Kumar, A., Yu, W. H., Peterhoff, C., Cataldo, A., & Cuervo, A. M. (2005) · Journal of Neuropathology & Experimental Neurology · doi:10.1093/jnen/64.2.113 · Cited by 1,588
Microglial interactions with synapses are modulated by visual experience
Tremblay, M.-È., Lowery, R. L., & Majewska, A. K. (2010) · PLoS Biology · doi:10.1371/journal.pbio.1000527 · Cited by 1,542 · cited 2×
“In the healthy adolescent brain, pockets of extracellular space are tightly associated with microglial cell bodies and processes, without noticeable accumulation of materials [45].”
BackgroundSelf-citationActivation of microglial cells by β-amyloid protein and interferon-γ
Meda, L., Cassatella, M. A., Szendrei, G. I., Otvos, L., Baron, P., Villalba, M., Ferrari, D., & Rossi, F. (1995) · Nature · doi:10.1038/374647a0 · Cited by 1,314
Gosselin, D., Link, V. M., Romanoski, C. E., Fonseca, G. J., Eichenfield, D. Z., Spann, N. J., Stender, J. D., Chun, H. B., Garner, H., Geissmann, F., et al. (2014) · Cell · doi:10.1016/j.cell.2014.11.023 · Cited by 1,307
Simard, A. R., Soulet, D., Gowing, G., Julien, J.-P., & Rivest, S. (2006) · Neuron · doi:10.1016/j.neuron.2006.01.022 · Cited by 1,265
Self-citationAn environment-dependent transcriptional network specifies human microglia identity
Gosselin, D., Skola, D., Coufal, N. G., Holtman, I. R., Schlachetzki, J. C. M., Sajti, E., Jaeger, B. N., O’Connor, C., Fitzpatrick, C., Pasillas, M. P., et al. (2017) · Science · doi:10.1126/science.aal3222 · Cited by 1,220
Soluble oligomers of the amyloid β-protein impair synaptic plasticity and behavior
Selkoe, D. J. (2008) · Behavioural Brain Research · doi:10.1016/j.bbr.2008.02.016 · Cited by 1,038
Borchelt, D. R., Ratovitski, T., van Lare, J., Lee, M. K., Gonzales, V., Jenkins, N. A., Copeland, N. G., Price, D. L., & Sisodia, S. S. (1997) · Neuron · doi:10.1016/s0896-6273(00)80974-5 · Cited by 1,023
Alzheimer’s Disease Risk Gene CD33 Inhibits Microglial Uptake of Amyloid Beta
Griciuc, A., Serrano-Pozo, A., Parrado, A. R., Lesinski, A. N., Asselin, C. N., Mullin, K., Hooli, B., Choi, S. H., Hyman, B. T., & Tanzi, R. E. (2013) · Neuron · doi:10.1016/j.neuron.2013.04.014 · Cited by 1,004
Neurotoxicity of Amyloid -Protein: Synaptic and Network Dysfunction
Mucke, L., & Selkoe, D. J. (2012) · Cold Spring Harbor Perspectives in Medicine · doi:10.1101/cshperspect.a006338 · Cited by 1,000 · cited 1×
“Numerous in vitro and in vivo studies across various models of AD have identified profound synaptic deficits in response to small oligomeric and sAβ [8].”
BackgroundRapid appearance and local toxicity of amyloid-β plaques in a mouse model of Alzheimer’s disease
Meyer-Luehmann, M., Spires-Jones, T. L., Prada, C., Garcia-Alloza, M., de Calignon, A., Rozkalne, A., Koenigsknecht-Talboo, J., Holtzman, D. M., Bacskai, B. J., & Hyman, B. T. (2008) · Nature · doi:10.1038/nature06616 · Cited by 987
Microglial Phagocytosis of Live Neurons
Brown, G. C., & Neher, J. J. (2014) · Nature Reviews Neuroscience · doi:10.1038/nrn3710 · Cited by 853
Koffie, R. M., Meyer-Luehmann, M., Hashimoto, T., Adams, K. W., Mielke, M. L., Garcia-Alloza, M., Micheva, K. D., Smith, S. J., Kim, M. L., Lee, V. M., et al. (2009) · Proceedings of the National Academy of Sciences · doi:10.1073/pnas.0811698106 · Cited by 850
TREM2-mediated early microglial response limits diffusion and toxicity of amyloid plaques
Wang, Y., Ulland, T. K., Ulrich, J. D., Song, W., Tzaferis, J. A., Hole, J. T., Yuan, P., Mahan, T. E., Shi, Y., Gilfillan, S., et al. (2016) · Journal of Experimental Medicine · doi:10.1084/jem.20151948 · Cited by 840 · cited 1×
“Microglia are also instrumental in slowing down the plaque growth and reducing synaptic loss by preventing Aβ diffusion and toxicity [22, 23], while they perform valuable roles in the clearance of both sAβ and fAβ [24, 25].”
BackgroundAPP mouse models for Alzheimer’s disease preclinical studies.
Sasaguri, H., Nilsson, P., Hashimoto, S., Nagata, K., Saito, T., De Strooper, B., Hardy, J., Vassar, R., Winblad, B., & Saido, T. C. (2017) · The EMBO Journal · doi:10.15252/embj.201797397 · Cited by 793
Microglia remodel synapses by presynaptic trogocytosis and spine head filopodia induction
Weinhard, L., di Bartolomei, G., Bolasco, G., Machado, P., Schieber, N. L., Neniskyte, U., Exiga, M., Vadisiute, A., Raggioli, A., Schertel, A., et al. (2018) · Nature Communications · doi:10.1038/s41467-018-03566-5 · Cited by 790
Autophagy, amyloidogenesis and Alzheimer disease
Nixon, R. A. (2007) · Journal of Cell Science · doi:10.1242/jcs.019265 · Cited by 749
Temporal Tracking of Microglia Activation in Neurodegeneration at Single-Cell Resolution
Mathys, H., Adaikkan, C., Gao, F., Young, J. Z., Manet, E., Hemberg, M., De Jager, P. L., Ransohoff, R. M., Regev, A., & Tsai, L.-H. (2017) · Cell Reports · doi:10.1016/j.celrep.2017.09.039 · Cited by 740
McClean, P. L., Parthsarathy, V., Faivre, E., & Hölscher, C. (2011) · The Journal of Neuroscience · doi:10.1523/jneurosci.0529-11.2011 · Cited by 698
Friedman, B. A., Srinivasan, K., Ayalon, G., Meilandt, W. J., Lin, H., Huntley, M. A., Cao, Y., Lee, S.-H., Haddick, P. C. G., Ngu, H., et al. (2018) · Cell Reports · doi:10.1016/j.celrep.2017.12.066 · Cited by 662
Autophagy failure in Alzheimer's disease—locating the primary defect
Nixon, R. A., & Yang, D.-S. (2011) · Neurobiology of Disease · doi:10.1016/j.nbd.2011.01.021 · Cited by 595
Mechanisms of Aβ Clearance and Degradation by Glial Cells
Ries, M., & Sastre, M. (2016) · Frontiers in Aging Neuroscience · doi:10.3389/fnagi.2016.00160 · Cited by 527
CD36 Mediates the Innate Host Response to β-Amyloid
El Khoury, J. B., Moore, K. J., Means, T. K., Leung, J., Terada, K., Toft, M., Freeman, M. W., & Luster, A. D. (2003) · The Journal of Experimental Medicine · doi:10.1084/jem.20021546 · Cited by 483
Krabbe, G., Halle, A., Matyash, V., Rinnenthal, J. L., Eom, G. D., Bernhardt, U., Miller, K. R., Prokop, S., Kettenmann, H., & Heppner, F. L. (2013) · PLoS ONE · doi:10.1371/journal.pone.0060921 · Cited by 478
A role for TREM2 ligands in the phagocytosis of apoptotic neuronal cells by microglia
Hsieh, C. L., Koike, M., Spusta, S. C., Niemi, E. C., Yenari, M., Nakamura, M. C., & Seaman, W. E. (2009) · Journal of Neurochemistry · doi:10.1111/j.1471-4159.2009.06042.x · Cited by 475
Microglial Phagocytosis of Fibrillar β-Amyloid through a β1Integrin-Dependent Mechanism
Koenigsknecht-Talboo, J., & Landreth, G. E. (2004) · Journal of Neuroscience · doi:10.1523/jneurosci.2557-04.2004 · Cited by 457
Dark microglia: A new phenotype predominantly associated with pathological states
Bisht, K., Sharma, K. P., Lecours, C., Gabriela Sánchez, M., El Hajj, H., Milior, G., Olmos‐Alonso, A., Gómez‐Nicola, D., Luheshi, G., Vallières, L., et al. (2016) · Glia · doi:10.1002/glia.22966 · Cited by 421
Self-citationde Duve, C. (1963) · Scientific American · doi:10.1038/scientificamerican0563-64 · Cited by 388
Matrix Metalloproteinase-9 Degrades Amyloid-β Fibrils in Vitro and Compact Plaques in Situ
Yan, P., Hu, X., Song, H., Yin, K., Bateman, R. J., Cirrito, J. R., Xiao, Q., Hsu, F. F., Turk, J. W., Xu, J., et al. (2006) · Journal of Biological Chemistry · doi:10.1074/jbc.m602440200 · Cited by 380 · cited 1×
“Additionally, microglia were involved in extracellular degradation of Aβ both in vitro and in vivo [29, 30].”
BackgroundFerreira, S. T., Lourenco, M. V., Oliveira, M. M., & De Felice, F. G. (2015) · Frontiers in Cellular Neuroscience · doi:10.3389/fncel.2015.00191 · Cited by 373
Declarative memory impairments in Alzheimer's disease and semantic dementia
Nestor, P. J., Fryer, T. D., & Hodges, J. R. (2006) · NeuroImage · doi:10.1016/j.neuroimage.2005.10.008 · Cited by 370
Bisht, K., Sharma, K. P., & Tremblay, M. (2018) · Neurobiology of Stress · doi:10.1016/j.ynstr.2018.05.003 · Cited by 366
Self-citationMicroglial Activation Resulting from CD40-CD40L Interaction After β-Amyloid Stimulation
Tan, J., Town, T., Paris, D., Mori, T., Suo, Z., Crawford, F., Mattson, M. P., Flavell, R. A., & MULLAN, M. J. (1999) · Science · doi:10.1126/science.286.5448.2352 · Cited by 353
Doens, D., & Fernández, P. L. (2014) · Journal of Neuroinflammation · doi:10.1186/1742-2094-11-48 · Cited by 348
Kim, D.-G., Krenz, A., Toussaint, L. E., Maurer, K. J., Robinson, S.-A., Yan, A., Torres, L., & Bynoe, M. S. (2016) · Journal of Neuroinflammation · doi:10.1186/s12974-015-0467-5 · Cited by 330
Batsch, N., & Mittelman, M. S. (2012) · Cited by 325
Šišková, Z., Justus, D., Kaneko, H., Friedrichs, D., Henneberg, N., Beutel, T., Pitsch, J., Schoch, S., Becker, A., von der Kammer, H., et al. (2014) · Neuron · doi:10.1016/j.neuron.2014.10.024 · Cited by 320 · cited 2×
“The best neuropathological correlates of cognitive decline in AD are neuronal dystrophy and synaptic loss, which are associated with increased network excitability, notably of the hippocampus, and precede neuronal death [3, 4].”
BackgroundLYSOSOMES AND GERL IN NORMAL AND CHROMATOLYTIC NEURONS OF THE RAT GANGLION NODOSUM
Holtzman, E., Novikoff, A. B., & Villaverde, H. (1967) · The Journal of Cell Biology · doi:10.1083/jcb.33.2.419 · Cited by 318
Gender differences in the amount and deposition of amyloidβ in APPswe and PS1 double transgenic mice
Wang, J., Tanila, H., Puoliväli, J., Kadish, I., & Groen, T. V. (2003) · Neurobiology of Disease · doi:10.1016/j.nbd.2003.08.009 · Cited by 316 · cited 1×
“in this study considering sex differences in amyloid deposition that were described in APP-PS1Δe9 mice [42].”
BackgroundHow nascent phagosomes mature to become phagolysosomes
Fairn, G. D., & Grinstein, S. (2012) · Trends in Immunology · doi:10.1016/j.it.2012.03.003 · Cited by 313
Patterson, C. (2018) · Cited by 313
Microglia in Health and Disease
Ransohoff, R. M., & Khoury, J. E. (2016) · Cold Spring Harbor Perspectives in Biology · doi:10.1101/cshperspect.a020560 · Cited by 303
Singh, N., Hopkins, S. J., Hulme, S., Galea, J. P., Hoadley, M. E., Vail, A., Hutchinson, P. J., Grainger, S., Rothwell, N. J., King, A. T., et al. (2014) · Journal of Neuroinflammation · doi:10.1186/1742-2094-11-1 · Cited by 284
Frackowiak, J., Wisniewski, H. M., Wegiel, J., Merz, G. S., Iqbal, K., & Wang, K. C. (1992) · Acta Neuropathologica · doi:10.1007/bf00227813 · Cited by 276 · cited 1×
“In fact, in vitro studies have found intact fAβ remains within microglia as long as 20 days after incubation with amyloid [83].”
BackgroundSlow Degradation of Aggregates of the Alzheimer's Disease Amyloid β-Protein by Microglial Cells
Paresce, D. M., Chung, H., & Maxfield, F. R. (1997) · Journal of Biological Chemistry · doi:10.1074/jbc.272.46.29390 · Cited by 275
Activation of Microglia Acidifies Lysosomes and Leads to Degradation of Alzheimer Amyloid Fibrils
Majumdar, A., Cruz, D., Asamoah, N., Buxbaum, A., Sohar, I., Lobel, P., & Maxfield, F. R. (2007) · Molecular Biology of the Cell · doi:10.1091/mbc.e06-10-0975 · Cited by 271
Putcha, D., Brickhouse, M. J., O’Keefe, K., Sullivan, C., Rentz, D. M., Marshall, G. A., Dickerson, B. C., & Sperling, R. A. (2011) · Journal of Neuroscience · doi:10.1523/jneurosci.4740-11.2011 · Cited by 268
Fractalkine receptor deficiency impairs microglial and neuronal responsiveness to chronic stress
Milior, G., Lecours, C., Samson, L., Bisht, K., Poggini, S., Pagani, F., Deflorio, C., Lauro, C., Alboni, S., Limatola, C., et al. (2015) · Brain Behavior and Immunity · doi:10.1016/j.bbi.2015.07.024 · Cited by 259
Self-citationEvidence for impaired amyloid β clearance in Alzheimer's disease
Wildsmith, K. R., Holley, M., Savage, J. C., Skerrett, R., & Landreth, G. E. (2013) · Alzheimer s Research & Therapy · doi:10.1186/alzrt187 · Cited by 249
Self-citationMorphologic association between microglia and senile plaque amyloid in Alzheimer's disease
Perlmutter, L. S., Barron, E., & Chui, H. C. (1990) · Neuroscience Letters · doi:10.1016/0304-3940(90)90748-x · Cited by 240
TDP-43 depletion in microglia promotes amyloid clearance but also induces synapse loss
Paolicelli, R. C., Jawaid, A., Henstridge, C. M., Valeri, A., Merlini, M., Robinson, J. L., Lee, E. B., Rose, J., Appel, S., Lee, V. M.-Y., et al. (2017) · Neuron · doi:10.1016/j.neuron.2017.05.037 · Cited by 239
Sanchez-Varo, R., Trujillo-Estrada, L., Sanchez-Mejias, E., Torres, M., Baglietto-Vargas, D., Moreno-Gonzalez, I., De Castro, V., Jimenez, S., Ruano, D., Vizuete, M., et al. (2012) · Acta Neuropathologica · doi:10.1007/s00401-011-0896-x · Cited by 222
Boissonneault, V., Filali, M., Lessard, M., Relton, J., Wong, G., & Rivest, S. (2008) · Brain · doi:10.1093/brain/awn331 · Cited by 221
Self-citationTamboli, I. Y., Barth, E., Christian, L., Siepmann, M., Kumar, S., Singh, S., Tolksdorf, K., Heneka, M. T., Lütjohann, D., Wunderlich, P., et al. (2010) · Journal of Biological Chemistry · doi:10.1074/jbc.m110.149468 · Cited by 220 · cited 1×
“Additionally, microglia were involved in extracellular degradation of Aβ both in vitro and in vivo [29, 30].”
BackgroundDeerinck, T., Bushong, E., Thor, A., Ellisman, M. H., Deerinck, T. J., Bushong, E. A., & Thor, C. A. (2010) · Cited by 211
Severely dystrophic axons at amyloid plaques remain continuous and connected to viable cell bodies
Adalbert, R., Nogradi, A., Babetto, E., Janeckova, L., Walker, S. A., Kerschensteiner, M., Misgeld, T., & Coleman, M. P. (2009) · Brain · doi:10.1093/brain/awn312 · Cited by 177
Microglial activation in Alzheimer's disease: an (R)-[11C]PK11195 positron emission tomography study
Schuitemaker, A., Kropholler, M. A., Boellaard, R., van der Flier, W. M., Kloet, R. W., van der Doef, T. F., Knol, D. L., Windhorst, A. D., Luurtsema, G., Barkhof, F., et al. (2012) · Neurobiology of Aging · doi:10.1016/j.neurobiolaging.2012.04.021 · Cited by 175
Microglia limit the expansion of β-amyloid plaques in a mouse model of Alzheimer’s disease
Zhao, R., Hu, W., Tsai, J., Li, W., & Gan, W.-B. (2017) · Molecular Neurodegeneration · doi:10.1186/s13024-017-0188-6 · Cited by 151 · cited 1×
“Microglia are also instrumental in slowing down the plaque growth and reducing synaptic loss by preventing Aβ diffusion and toxicity [22, 23], while they perform valuable roles in the clearance of both sAβ and fAβ [24, 25].”
BackgroundKoenigsknecht-Talboo, J., Meyer-Luehmann, M., Parsadanian, M., Garcia-Alloza, M., Finn, M. B., Hyman, B. T., Bacskai, B. J., & Holtzman, D. M. (2008) · The Journal of Neuroscience · doi:10.1523/jneurosci.4147-08.2008 · Cited by 149 · cited 2×
“This finding additionally suggests that microglia may remain in close proximity to amyloid after recognition via cell-surface receptor complexes, as supported by previous two-photon in vivo imaging observations in the cerebral cortex of AD model mice [71].”
ResultFan, Z., Okello, A. A., Brooks, D. J., & Edison, P. (2015) · Brain · doi:10.1093/brain/awv288 · Cited by 135
Haka, A. S., Barbosa-Lorenzi, V. C., Lee, H. J., Falcone, D. J., Hudis, C. A., Dannenberg, A. J., & Maxfield, F. R. (2016) · Journal of Lipid Research · doi:10.1194/jlr.m064089 · Cited by 135
The endocytic pathway in microglia during health, aging and Alzheimer’s disease
Solé-Domènech, S., Cruz, D. L., Capetillo-Zarate, E., & Maxfield, F. R. (2016) · Ageing Research Reviews · doi:10.1016/j.arr.2016.07.002 · Cited by 133
Hippocampal Aβ42 Levels Correlate with Spatial Memory Deficit in APP and PS1 Double Transgenic Mice
Puoliväli, J. T., Wang, J., Heikkinen, T., Heikkilä, M., Tapiola, T., van Groen, T., & Tanila, H. (2002) · Neurobiology of Disease · doi:10.1006/nbdi.2002.0481 · Cited by 125
Kruth, H. S. (2011) · Current Opinion in Lipidology · doi:10.1097/mol.0b013e32834adadb · Cited by 122
Sasaki, S. (2010) · Journal of Neuropathology & Experimental Neurology · doi:10.1097/nen.0b013e3181d44992 · Cited by 121
Cummings, B. J., Su, J. H., Geddes, J. W., Van Nostrand, W. E., Wagner, S. L., Cunningham, D. D., & Cotman, C. W. (1992) · Neuroscience · doi:10.1016/0306-4522(92)90265-4 · Cited by 120
Stalder, M., Deller, T., Staufenbiel, M., & Jucker, M. (2001) · Neurobiology of Aging · doi:10.1016/s0197-4580(01)00209-3 · Cited by 118
ElAli, A., & Rivest, S. (2013) · Frontiers in Physiology · doi:10.3389/fphys.2013.00045 · Cited by 115
Self-citationHexokinases link DJ-1 to the PINK1/parkin pathway
Hauser, D. N., Mamais, A., Conti, M. M., Primiani, C. T., Kumaran, R., Dillman, A., Langston, R. G., Beilina, A. G., Garcia, J. H., Díaz‐Ruiz, A., et al. (2017) · Molecular Neurodegeneration · doi:10.1186/s13024-017-0212-x · Cited by 112
Degradation of Alzheimer's amyloid fibrils by microglia requires delivery of ClC-7 to lysosomes
Majumdar, A., Capetillo‐Zarate, E., Cruz, D. L., Gouras, G. K., & Maxfield, F. R. (2011) · Molecular Biology of the Cell · doi:10.1091/mbc.e10-09-0745 · Cited by 109
Microglial Activation in Alzheimers Disease
Schlachetzki, J. C. M., & Hüll, M. (2009) · Current Alzheimer Research · doi:10.2174/156720509790147179 · Cited by 105 · cited 1×
“The main pathological hallmarks of AD are the deposition of extracellular amyloid beta (Aβ) plaques, comprising insoluble Aβ fibrils (fAβ), and intraneuronal fibrillar tangles of tau protein [7].”
BackgroundSavage, J. C., Picard, K., Ibáñez, F. G., & Tremblay, M. (2018) · Frontiers in Immunology · doi:10.3389/fimmu.2018.00803 · Cited by 96
Self-citationEndoplasmic Reticulum Dysfunction in Alzheimer’s Disease
Li, J., Yu, J., Jiang, T., & Tan, L. (2014) · Molecular Neurobiology · doi:10.1007/s12035-014-8695-8 · Cited by 86 · cited 1×
“It has been described in several neurodegenerative diseases, including amyotrophic lateral sclerosis and AD [63, 64].”
BackgroundHippocampal volume is an independent predictor of cognitive performance in CADASIL
O'Sullivan, M., Ngo, E., Viswanathan, A., Jouvent, E., Gschwendtner, A., Saemann, P. G., Duering, M., Pachai, C., Bousser, M.-G., Chabriat, H., et al. (2009) · Neurobiology of Aging · doi:10.1016/j.neurobiolaging.2007.09.002 · Cited by 85
Chavez‐Valdez, R., Flock, D. L., Martin, L. J., & Northington, F. J. (2015) · International Journal of Developmental Neuroscience · doi:10.1016/j.ijdevneu.2015.11.007 · Cited by 75
Malm, T., Koıstınaho, J., & Kanninen, K. M. (2011) · International Journal of Alzheimer s Disease · doi:10.4061/2011/517160 · Cited by 74 · cited 1×
“To provide further insights into the implication of microglial diversity in AD, the present study aimed to define the spatial heterogeneity of microglial ultrastructure with relation to fAβ plaques, as well as neuronal dystrophy and synaptic loss, using APP-PS1Δe9 mice [38].”
MethodProperties of neuronal lipofuscin pigment in mice
Nandy, K. (1971) · Acta Neuropathologica · doi:10.1007/bf00690951 · Cited by 69
Remodeling of lipid bodies by docosahexaenoic acid in activated microglial cells
Tremblay, M.-E., Zhang, I., Bisht, K., Savage, J. C., Lecours, C., Parent, M., Titorenko, V., & Maysinger, D. (2016) · Journal of Neuroinflammation · doi:10.1186/s12974-016-0580-0 · Cited by 66 · cited 11×
“However, after ultrathin sections were made, they were collected onto polished silicon chips and treated with 2% osmium tetroxide in 1.5% potassium ferrocyanide solution, followed by 1% thiocarbohydrazide, and 1% osmium, as described in the National Center for Microscopy and Imaging Research serial blockface SEM proto…”
BackgroundMethodInfluentialSelf-citationAcharjee, S., Verbeek, M., Gómez, C., Bisht, K., Lee, B., Benoit, L., Sharkey, K. A., Benediktsson, A. M., Tremblay, M., & Pittman, Q. J. (2018) · Journal of Neuroscience · doi:10.1523/jneurosci.0398-18.2018 · Cited by 63
Self-citationPreparation of Mouse Brain Tissue for Immunoelectron Microscopy
Tremblay, M., Riad, M., & Majewska, A. K. (2010) · Journal of Visualized Experiments · doi:10.3791/2021 · Cited by 55 · cited 1×
“Transverse sections of the brain (50-μm-thick) were cut in PBS using a vibratome (Leica VT1000S) and kept in a cryoprotectant solution containing glycerol and ethylene glycol at − 20 °C until further processing [41, 43].”
MethodSelf-citationMega, M. S., Small, G. W., Xu, M. L., Felix, J., Manese, M., Tran, N. P., Dailey, J. I., Ercoli, L. M., Bookheimer, S. Y., & Toga, A. W. (2002) · Psychosomatic Medicine · doi:10.1097/00006842-200205000-00013 · Cited by 50
Hui, C. W., St‐Pierre, M., Detuncq, J., Aumailley, L., Dubois, M.-J., Couture, V., Skuk, D., Marette, A., Tremblay, J. P., Lebel, M., et al. (2018) · Brain Behavior and Immunity · doi:10.1016/j.bbi.2018.06.007 · Cited by 47
Self-citationDifferential effect of angiotensin II and blood pressure on hippocampal inflammation in mice
Iulita, M. F., Vallerand, D., Beauvillier, M., Haupert, N., Ulysse, C. A., Gagné, A., Vernoux, N., Duchemin, S., Boily, M., Tremblay, M., et al. (2018) · Journal of Neuroinflammation · doi:10.1186/s12974-018-1090-z · Cited by 36
Self-citationCorrelative Light and Electron Microscopy to Study Microglial Interactions with β-Amyloid Plaques
Bisht, K., Hajj, H. E., Savage, J. C., Sanchez, M. G., & Tremblay, M. (2016) · Journal of Visualized Experiments · doi:10.3791/54060 · Cited by 28 · cited 5×
“Areas of interest were excised from the embedded sections, glued to resin blocks [41], and sectioned at 70–80 nm using a Leica UC7 ultramicrotome.”
MethodInfluentialSelf-citationNuntagij, P., Oddo, S., LaFerla, F. M., Kotchabhakdi, N., Ottersen, O. P., & Torp, R. (2009) · Journal of Alzheimer s Disease · doi:10.3233/jad-2009-0962 · Cited by 21
Esparza, T. J., Gangolli, M., Cairns, N. J., & Brody, D. L. (2018) · PLoS ONE · doi:10.1371/journal.pone.0200251 · Cited by 16
Research works printed but not linked: 4
- International AD. World Alzheimer Report 2016; 2016. p. 1–140.
- Alzheimer Association. 2018 Alzheimer’s disease facts and figures. Alzheimer’s Dement. 2018;2018:1–88.
- Ferreira ST, Lourenco MV, Oliveira MM, De Felice FG. Soluble amyloid-beta oligomers as synaptotoxins leading to cognitive impairment in Alzheimer’s disease. Front Cell Neurosci. 2015;9:9498.
- Solé-Domènech S, Cruz DL, Capetillo-Zarate E, Maxfield FR. Ageing research reviews Ageing Research Reviews. Elsevier B.V; 2016;32:89–103.
Cited by
Sorted by citations
Synaptic degeneration in Alzheimer disease
Tzioras, M., McGeachan, R. I., Durrant, C. S., & Spires-Jones, T. L. (2023) · Nature Reviews Neurology · doi:10.1038/s41582-022-00749-z · Cited by 504
Impact of TREM2R47H variant on tau pathology–induced gliosis and neurodegeneration
Gratuze, M., Leyns, C. E. G., Sauerbeck, A. D., St-Pierre, M.-K., Xiong, M., Kim, N., Serrano, J. R., Tremblay, M.-È., Kummer, T. T., Colonna, M., et al. (2020) · Journal of Clinical Investigation · doi:10.1172/jci138179 · Cited by 252
“(endoplasmic reticulum dilation, condensation of the nucleo- and cytoplasm, altered mitochondria) (67, 68) and have been seen previously in pathological conditions, such as AD (69).”
BackgroundSelf-citationTherapeutic B-cell depletion reverses progression of Alzheimer’s disease
Kim, K., Wang, X., Ragonnaud, E., Bodogai, M., Illouz, T., DeLuca, M., McDevitt, R. A., Gusev, F., Okun, E., Rogaev, E., et al. (2021) · Nature Communications · doi:10.1038/s41467-021-22479-4 · Cited by 206
Lombardi, M., Parolisi, R., Scaroni, F., Bonfanti, E., Gualerzi, A., Gabrielli, M., de Rosbo, N. K., Uccelli, A., Giussani, P., Viani, P., et al. (2019) · Acta Neuropathologica · doi:10.1007/s00401-019-02049-1 · Cited by 191
“Importantly, microglia exhibited condensed, electron-dense cytoplasm and nucleoplasm, resembling “dark” microglia, a recently described phenotype of reactive cells [7] [27], characterized by pronounced chromatin remodeling, which is indicative of altered gene expression.”
BackgroundSubramanian, J., Savage, J. C., & Tremblay, M. (2020) · Frontiers in Cellular Neuroscience · doi:10.3389/fncel.2020.592607 · Cited by 127
Self-citation
Metadata
- Authors
- El Hajj, H., Savage, J. C., Bisht, K., Parent, M., Vallières, L., Rivest, S., & Tremblay, M.-È.
- Affiliations
- Centre de recherche du CHU de Québec-Université Laval (CA)
- Université Laval (CA)
- Corresponding author
- Tremblay, Marie-Ève
- Venue
- Journal of Neuroinflammation
- Published
- 2019-04-16
- Volume
- 16
- Issue
- 1
- Pages
- 87-87
- ISSN
- 1742-2094 (ISSN-L)
- PMC
- PMC6469225
- OpenAlex
- W2946033659
- Cited by
- 119
- References
- 95
- Citations by year
- 2026: 7 · 2025: 11 · 2024: 23 · 2023: 16 · 2022: 22 · 2021: 18 · 2020: 18 · 2019: 4
- FWCI
- 6.82
- Type
- journal article
- Language
- en
- Open access
- gold
- doi.org
- Licence
- Locations
- Journal of Neuroinflammation (publishedVersion, cc-by)
- PubMed Central (publishedVersion, cc-by)
- PubMed (publishedVersion)
- DOAJ (DOAJ: Directory of Open Access Journals) (submittedVersion)
- Funders
- Fonds de recherche en santé du Québec
- Lebanese Ministry of Education and Higher Education
- Fondation du CHU de Québec
- The Banting Research Foundation
- The Scottish Rite Charitable Foundation of Canada
- NEURON-ERANET
- Topics
- Life Sciences › Neuroscience › Neurology › Neuroinflammation and Neurodegeneration Mechanisms
- Life Sciences › Neuroscience › Cellular and Molecular Neuroscience › Alzheimer's disease research and treatments
- Life Sciences › Neuroscience › Neurology › Neurological Disease Mechanisms and Treatments
- Keywords
- Alzheimer's disease, microglial heterogeneity, amyloid plaques, amyloid fibrils, APPswe/PS1ΔE9 mice, hippocampal CA1, microglial phagocytosis, neuronal dystrophy, Braak stages, neuroinflammation
- MeSH terms
- Aged, Aged, 80 and over, Alzheimer Disease, Animals, Hippocampus, Humans, Amyloid beta-Peptides, Microglia, Mice
About these checks
Registry, retraction, Cites and statistics results are computed, not judged, with one exception: a printed reference that no index lists is read once by a model before it counts as a citation error. Claims are extracted by a model and kept only when their quote appears verbatim in the text; each cited source is then checked, with a model’s help, for whether it says what the claim relies on. Those verdicts can be wrong — read the claim’s quote and the cited source before relying on one.
Statistics and arithmetic are recomputed, not judged.
Confidence bands are shown only for fields calibrated on our annotated test set. None is calibrated yet, so no band is shown.
What counts as a claim ›How we measure confidence ›How we check this ›
Are you an author, or do you see a problem with this page? Request a review
